Day Return
YTD Return
1-Year Return
3-Year Return
5-Year Return
Note: Sector performance is calculated based on the previous closing price of all sector constituents
Industries in This Sector
Select an Industry for a Visual Breakdown
| Industry | Market Weight | YTD Return | |
|---|---|---|---|
| All Industries | 100.00% | 8.20% | |
| Aerospace & Defense | 18.85% | 26.80% | |
| Specialty Industrial Machinery | 15.01% | -7.03% | |
| Railroads | 8.24% | -1.16% | |
| Farm & Heavy Construction Machinery | 7.19% | 7.79% | |
| Building Products & Equipment | 6.56% | 19.92% | |
| Specialty Business Services | 5.38% | 11.54% | |
| Integrated Freight & Logistics | 4.41% | -10.31% | |
| Waste Management | 4.10% | 12.66% | |
| Industrial Distribution | 3.95% | 8.15% | |
| Engineering & Construction | 3.92% | 26.43% | |
| Conglomerates | 3.84% | -5.48% | |
| Staffing & Employment Services | 3.24% | 1.08% | |
| Rental & Leasing Services | 2.34% | 3.48% | |
| Electrical Equipment & Parts | 2.30% | 36.62% | |
| Consulting Services | 2.11% | 5.34% | |
| Trucking | 1.76% | -8.66% | |
| Airlines | 1.75% | 10.12% | |
| Tools & Accessories | 1.22% | -6.66% | |
| Security & Protection Services | 0.79% | 7.47% | |
| Marine Shipping | 0.77% | 59.43% | |
| Pollution & Treatment Controls | 0.77% | 19.44% | |
| Infrastructure Operations | 0.63% | 784.45% | |
| Metal Fabrication | 0.61% | 20.42% | |
| Airports & Air Services | 0.16% | -26.84% | |
| Business Equipment & Supplies | 0.10% | 3.87% | |
Note: Percentage % data on heatmap indicates Day Return
All Industries
-
Largest Companies in This Sector
|
Name
|
Last Price
|
1Y Target Est.
|
Market Weight
|
Market Cap
|
Day Change %
|
YTD Return
|
Avg. Analyst Rating
|
|---|---|---|---|---|---|---|---|
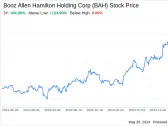
| 167.33 | 184.65 | 3.61% |
|
|
|
Buy
|
|
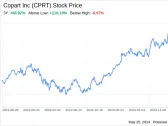
| 348.90 | 334.83 | 3.36% |
|
|
|
Hold
|
|
| 232.05 | 247.40 | 2.79% |
|
|
|
Buy
|
|
| 106.27 | 104.23 | 2.78% |
|
|
|
Hold
|
|
| 340.89 | 333.41 | 2.68% |
|
|
|
Buy
|
|
| 199.69 | 219.12 | 2.56% |
|
|
|
Buy
|
|
| 138.66 | 160.93 | 2.34% |
|
|
|
Buy
|
|
| 467.35 | 451.68 | 2.21% |
|
|
|
Hold
|
|
| 174.52 | 207.17 | 2.11% |
|
|
|
Buy
|
|
| 374.96 | 421.93 | 2.06% |
|
|
|
Buy
|
Investing in the Industrials Sector
Start Investing in the Industrials Sector Through These ETFs and Mutual Funds
ETF Opportunities
|
Name
|
Last Price
|
Net Assets
|
Expense Ratio
|
YTD Return
|
|---|---|---|---|---|
| 124.46 | 17.856B | 0.09% |
|
|
| 39.11 | 7.176B | 0.47% |
|
|
| 135.55 | 6.101B | 0.40% |
|
|
| 241.41 | 5.507B | 0.10% |
|
|
| 105.40 | 3.116B | 0.58% |
|
Mutual Fund Opportunities
|
Name
|
Last Price
|
Net Assets
|
Expense Ratio
|
YTD Return
|
|---|---|---|---|---|
| 124.07 | 5.507B | 0.10% |
|
|
| 17.92 | 1.593B | 0.68% |
|
|
| 39.21 | 572.417M | 0.69% |
|
|
| 105.74 | 571.808M | 0.70% |
|
|
| 48.57 | 538.102M | 0.76% |
|
Industrials Research
Discover the Latest Analyst and Technical Research for This Sector
-
Morningstar | A Weekly Summary of Stock Ideas and Developments in the Companies We Cover
In this edition, P&C insurers overvalued despite tailwind; prospects and caveats for P&C insurers; breaking down the Live Nation breakup sought by DOJ; and VF, Evotec SE ADR, and Stericycle.
-
Analyst Report: Thomson Reuters Corporation
Thomson Reuters is the result of the $17.6 billion megamerger of Canada’s Thomson and the United Kingdom’s Reuters Group in 2008. In 2021, Thomson Reuters completed the sale of Refinitiv to LSE Group. Thomson Reuters' three largest segments are its legal professionals, Tax and accounting, and corporates segments. Legal professionals is about 42% of the firm's revenue and 47% of the firm's adjusted EBITDA. Tax and accounting makes up about 20%-25% of the firm's revenue and EBITDA. Corporates, which consists of legal professionals and tax and accounting products sold to corporations, also makes up about 20%-25% of the firm's revenue and EBITDA. Thomson Reuters' smaller segments include its Reuters news business and global print business.
RatingPrice Target -
Analyst Report: Stericycle, Inc.
Stericycle is the largest provider of medical waste disposal and data destruction (primarily paper shredding) services in the United States. Its next-closest national competitor in medical waste disposal is Sharps Compliance, which generated $76 million of sales in fiscal 2021 before its 2022 acquisition (about 4% of Stericycle's global regulated waste and compliance revenue). Stericycle's data destruction business, Shred-It, is about twice the size of its closest competitor (Iron Mountain's information destruction segment). Stericycle has a global presence, with about 20% of its revenue earned outside North America.
RatingPrice Target -
Daily – Vickers Top Buyers & Sellers for 05/24/2024
The Vickers Top Buyers & Sellers is a daily report that identifies the five companies the largest insider purchase transactions based on the dollar value of the transactions as well as the five companies the largest insider sales transactions based on the dollar value of the transactions.