Ed Hoskins
Summary
The imposed policy of insisting on Weather-Dependent “Renewables” is an effort to gather power from dilute unreliable sources and to attempt to use those dilute intermittent power sources to replace reliable and productive power generators. Conventional power generators Coal-firing, Nuclear, Gas-firing operate and 80%-90% productivity.
The imposition of Weather-Dependent “Renewables” onto the a Nations power generation fleet degraded the overall productivity for their whole power sectors, with results as follows:
- Germany: overall generation fleet productivity is reduced to 30%
- the UK: overall generation fleet productivity is reduced to 45%
- France: overall generation fleet productivity is reduced to 55%
- the combined Germany – the UK – France power generation fleet productivity is reduced to 41%.
In other words the policies of imposing Weather-Dependent “Renewables” has already lead to massive loss of performance of the power generation fleet of any Nation embracing the dogma of Net Zero / Catastrophic Climate Change. This damage to the performance of power generation in Western Nations is made in the context that most of the world including China, India and other rapidly growing Nations have no concern about growing their much more significant CO2 emissions.
Introduction
With the installation of ~207GW of Weather-Dependent “Renewables”, the three Nations Germany, the UK and France account for about half the total European EU + UK “Renewables” installation, ~427GW in total. Both the UK and France have made commitments to “Renewables” at about 1/3 the level of that of Germany.
Germany with its longterm “die Energiewende” policy has made the largest commitment. The UK has the largest Offshore wind power installation in Europe. France with its longstanding policy for Nuclear power has also made a a large commitment to Onshore Wind power and Solar PV power. France is not involved with Offshore wind power.
France as a result of its Nuclear policy has achieved the lowest CO2 emissions/head of any developed Nation and remains below the Global average. It would therefore seem that any further French commitment to Weather-Dependent “Renewables” to control its CO2 emissions was an unnecessary and self-harming policy.

The table below summarises the comparative performance either the overall European (27) + UK commitment to Weather-Dependent “Renewables”.
Productivity / Capacity performance is the the annual achieved power output as actually achieved divided by the size actual generation installation. Hourly power generation data for the full year July 2022 – June 2023 has been collated for the three major Nations Germany, the UK and France from Gridwatch and is used to assess the actual power output for comparative purposes here.

An overall productivity level in the region of 16 – 20 % means that to provide the same amount of power to the grid, 5-6 times more “Renewable” installations are needed than for conventional power generators, (Gas, Coal or Nuclear). In addition, it is unlikely that the power from those “Renewables” will be delivered as and when needed. As the power supply is Weather-Dependent, the timing of the power produced can never be controlled and is unresponsive to power demand.
Accordingly, these productivity / capacity percentages are a more generous interpretation of the usefulness of Weather-Dependent “Renewable” generated power.

The record of past productivity of European Weather-Dependent “Renewables” since 2011 is shown below. Those past productivity values show some variability year on year but they are consistent with the poor productivity values shown above for the 2022-2023 period.
The data used here for the scale of the installation fleet is derived from the EurObserv’ER’ organisation, an EU body set up to promote “Renewable” energy in Europe. EurObser’ER’ data actually understates the annual output of power from “Renewables”. As, when compared to the recorded hourly data from Gridwatch etc. “Renewables” output is rather higher, the higher recorded power output values are used here.
The combined performance of EU(27) and the UK “Renewables” is summarised below.

Power generation by the three individual Nations
Graphical representations based on hourly data show the power generation performance each of the three individual Nations: Germany, the UK and France. These notes explain and contrast the differing approaches that have been taken in the three nations. They also chart the degradation of performance induced by the imposition by Weather-Dependent “Renewables” on the overall power generation system of these nations.
Germany July 2022 – June 2023

This graphic shows:
- there is still a high dependence in Germany on CO2 emitting Coal, Lignite and Biomass for power generation, Coal is rated to have about twice the level of CO2 emissions of Gas-firing, whereas Biomass, (especially if imported from overseas), has about 3.5 times the CO2 emissions produced by Gas-firing.
- in April 2023 Germany finally terminated the last of their Nuclear power industry. This was an wholly irrational, emotional decision for a country that has been fully committed to CO2 emissions reduction for the last two decades and has always intended to be the world leader in decarbonisation of Western economies.
- in spite of its long-term “Die Energiewende” policy, German CO2 emissions/head are still the highest in Europe. Those CO2 emissions are now growing to compensate for withdrawing from Nuclear power generation. Having previously being able to produce about 16% of the German power requirement with nil CO2 emissions, Germany closed its last Nuclear power stations in April 2023, well before the end of their useful service life.
- in certain winter periods there can be massive power overproduction from the superfluous installation of Wind power. The excess is curtailed or wastefully exported, often at a significant cost.
- there is a substantial dependence on Gas-fired power generation during periods of low “Renewables” output. Prior to the Ukrainian war German Natural Gas was sourced from Russia, via the Nordstream pipelines, now sabotaged. This is likely to lead to supply problems in the coming 2023 winter.

This graphic shows:
- the 63GW of installed Wind power only rarely reaches a peak of 2/3 of their potential full power output
- the massive variation of and virtual disappearance of Solar power input in the winter months,
- periods of dunkelflaute when both Wind and Solar power are virtually absent at times of maximum power demand.
German power installations and recorded output

Comparing the installed “Renewables” Generators with their actual output and seeing them from the perspective of their contribution to the power grid the following poi
- the German “die Energiewende” policy has resulted in the nominal installation of Weather-Dependent “Renewables” making up ~74% of Germany’s generation fleet.
- as they are Weather-Dependent those “Renewable” power contributions to the grid are uncontrollable, intermittent and unreliable.
- Solar PV: Solar installations amount to ~67GW or ~38% of the total German power fleet have a measured annual productivity / capacity of ~9.3%. Solar power only contributes about 10.4% of the power to the Grid. Solar output inevitably fluctuates diurnally but its output is also virtually non-existent during the high demand dull winter months. Solar power is still intermittent in the summer.
- Wind power: the ~8GW of German Offshore wind power contributed well in the 2022-23 year at ~39%, a high productivity value.
- overall Wind power in Germany only reached a productivity value of ~23% as a result of the poor performance of the extensive German Onshore wind power installations at ~21%.
- 48% of the German power contribution is still provided by CO2 emitting fuels. These CO2 emissions are necessarily increasing as a result of the closure of Nuclear power in Germany:
- Coal ~10%, with CO2 emissions about twice that of Natural Gas
- Lignite ~18%, with CO2 emissions about twice that of Natural Gas
- Biomass ~9%, with CO2 emissions about 3.6 times that of Natural Gas
- Natural Gas ~11%.
- Nuclear power: even in the last 9 months of Nuclear power operation it provided an overall ~5% annual power input.
- Net transfer: as there is an excess of Wind power in the fleet (at ~+115% of the normal demand), in productive times, when there wind speeds are optimal, these Wind installations inevitably produce unusable excess power. The Net transfer figure for Germany is mainly comprised of the disposal of those power excesses, which are often curtailed, (just thrown away), or transferred to other countries often at a negative price.
- the policy imposition of Weather-Dependent “Renewables” on the German grid reduces its overall generation productivity to ~30%, whereas conventional generators, Gas, Coal or Nuclear would normally operate at 80% – 90%.
This graphic summarises the position of Weather-Dependent “Renewables” in Germany resulting in a “Renewables” productivity level close to 16%.

The United Kingdom July 2022 – June 2023

This graphic shows:
- the high dependence in the UK on natural gas for power generation. Natural gas is also used widely in the UK for domestic and other space heating.
- UK CO2 emissions/head were substantially reduced by the UK “Dash for Gas” policy in the 1990s, when the use of Coal as fuel for power generation was progressively eliminated.
- the dependence on Gas-fired power generation during periods of low “Renewables” output.
- there is still a significant Nuclear power contribution to the UK power generation mix. This commitment to Nuclear power is expected to grow but always seems to be impeded by policy or overregulation.

Notable points shown in this graphic are:
- the 27GW of installed Wind power only rarely and then for few hours at a time reach a peak at 2/3 of their potential full power output
- there is massive variation of and virtual disappearance of Solar power output in winter months,
- periods of low production when both Wind and Solar power are virtually absent. The loss of power productivity is usually at times of maximum power demand.
UK power installations and recorded output

Comparing the installed “Renewables” Generators with their actual output and seeing them from the perspective of their contribution to the power grid the following points arise:
- the UK policy of imposing Weather-Dependent “Renewables” has resulted in their now making up ~63% of the UK’s generation fleet but these installations have only resulted in producing ~29% of the power to the Grid. As they are Weather-Dependent those “Renewable” power contributions to the grid are uncontrollable, intermittent and unreliable.
- the measured productivity of UK Solar power was at ~10%.
- the Solar installations amount to ~13GW ~20% of the total UK power fleet but only contributed ~5% of the power to the Grid. Solar output inevitably fluctuates diurnally and its output is also virtually non-existent during the dull winter months. Solar power produces intermittently but is at its maximum in the summer, the times of lowest demand.
- Wind power: UK Offshore wind contributed reasonably in the 2022-23 year at ~31% capacity, and over the year Wind power in the UK only had a low productivity of ~26%.
- 48% of the UK power contribution is still provided by CO2 emitting fuels:
- Biomass ~5% with CO2 emissions about 3.6 times Natural Gas. Biomass generation is mainly situated at the Drax site in Yorkshire. Drax the largest power station in the UK power station burns wood pellets imported from North America instead of using Coal from the seam on which it is built. The excessive CO2 emissions from Drax, although politically assessed as being Carbon Neutral, actually negate any and all of the CO2 emissions savings that may have been achieved by “Renewables” etc. throughout the UK. It should be noted that by policy this process is heavily subsidised by the UK taxpayer and the management at drax have been gaming the subsidy system to maximise profits.
- Natural Gas: provides ~42% of the power output. The transfer to Gas-firing from Coal burning is mainly responsible for the achievement in UK CO2 emissions reduction since the 1990s
- Coal ~1% with CO2 emissions about twice Natural Gas. A few Coal-fired power stations remain operational in the UK and are used only in times of emergency. Most UK Coal-fired power stations were demolished before the end of their useful lives rather than being mothballed for possible use as reserve. The few remaining Coal-fired stations are likewise threatened with closure and demolition in the near future.
- Nuclear power: provided a ~16% contribution of power over the whole year.
- Net transfer: on occasions there is some export of power from the UK at times of good wind power productivity. The UK Net transfer figure is mainly made up of essential power imports, often at a level ~10% of all UK power mainly imported from France and the Netherlands they are continuously required to support the UK Grid.
- the policy of imposing Weather-Dependent “Renewables”, Solar and Wind power on the UK grid has reduced the overall power generation productivity to ~45%: whereas conventional generators, Gas, Coal or Nuclear would normally operate at ~80% – 90% productivity.
This graphic summarises the position of Weather-Dependent “Renewables” in the UK resulting in a productivity level more than 20%.

France July 2022 – June 2023

This graphic shows::
- the major long-term French commitment to the development and use of Nuclear power. The policy that was originally instituted in the 1950s, in response to the oil price shock. Electric power is widely used in France for domestic heating.
- the long-term Nuclear power policy has resulted in French CO2 emissions/head being below the Global average.
- there is some dependence on Gas-fired power generation during periods of low “Renewables” power output.
- Net Transfer: over the early part of 2022-2023 period the Net transfer from France was abnormally low. In 2022 there was a major cut back in French Nuclear power production taken out of commission for essential deferred maintenance. As a result France on occasions was even forced to import power in 2022 to sustain its Grid. Nuclear power generation in France was largely restored in 2023. Up until that time France had normally been a supportive exporter of a large tranche of its Nuclear power output, particularly to the UK and Germany. Germany and the UK are still highly dependent of those power imports to sustain their Grids.
- France has a substantial power contribution (~8%) from its Hydropower installations.

Notable points shown in this graphic are:
- the 2oGW of installed Onshore Wind power only rarely and then for few hours at a time reach a peak at 2/3 of their potential full power output
- the massive variation of and marked diminution of Solar power input in the winter months,
- periods of low production when both Wind and Solar power are virtually absent, usually at times of maximum power demand.
- France has made no commitment to developing Offshore wind power.
France power installations and recorded output

Comparing the installed “Renewables” Generators with their actual output and seeing them from the perspective of their contribution to the power grid the following points arise:
- French Nuclear power makes up ~41% of all French generating installations. Nuclear power provided ~66% of French power output, this level can be expected to grow as more Nuclear plants come back on line.
- nonetheless, Weather-Dependent “Renewables” make up ~44% of the French generation fleet but these installations have only resulted in contributing ~14% of the power to the Grid.
- the measured productivity of French Solar power at ~13% was relatively high, reflecting the more southerly location of France than the UK or Germany.
- the Solar installations amount to ~17GW ~20% of the total French power fleet but only contributed ~5% of the power to the Grid. Solar output inevitably fluctuates diurnally but its output is also virtually non-existent during the dull winter months and it produces intermittently but Solar power is at its maximum in the summer, the times of lowest demand.
- French Onshore Wind power is 24% of the power generation installations but contributed less than 10% to the Grid. As Wind power is Weather-Dependent those power contributions to the grid are uncontrollable, intermittent and unreliable.
- France uses Natural gas ~6% of the power installations to compensate for the variability of Wind and Solar power. Nuclear power is less flexible and not able to be as responsive as gas-firing.
- France has a substantial Hydro power installation responsively supplying ~9% of the power to the Grid.
- the policy of imposing Weather-Dependent “Renewables”, Solar and Wind power on the French grid has reduced the overall power generation productivity to ~55%: whereas conventional generators, Gas, Coal or Nuclear would normally operate at ~80% – 90% productivity.
This graphic summarises the position of Weather-Dependent “Renewables” in France resulting in a productivity level of ~18%.

Conclusions
The following diagram shows the progress in CO2 emmisions/head reductions in Europe since 1990.

In 2022 the German, UK and French performance can be compared with the the CO2 emissions/head of China and the Global average CO2 emission reduction performance comparisons with China and the Global average show:
- German CO2 emissions are 5% more than China and are ~80% above the Global average
- the UK CO2 emissions are 34% less than China and are only ~12% above the Global average
- French CO2 emissions are 48% less than China and are ~11% below the Global average.
The policy of controlling the relatively minor European CO2 emissions to affect “Climate Change” at all should in itself be open to question.
But if any evidence were needed, these data shows that using Nuclear power is a really effective way of controlling National CO2 emissions. However the obsessive and extreme Green attitudes in Germany have finally terminated their Nuclear operations for entirely emotional, non-engineering reasons. As a result Germany has destroyed its productive Nuclear power industry. National CO2 emissions are now growing in Germany as they are using more Coal, Biomass and Lignite to compensate for that irrational decision. This outcome is in direct opposition to the objectives of their long-term “die Energiewende” policy.
When the data of National power production is compared with the nominal size of installed Weather-Dependent “Renewables” the scale of excess installations becomes clear:
- Germany ~115% more Weather-Dependent “Renewables” installed than their annual power output
- the UK ~40% more Weather-Dependent “Renewables” installed than their annual power output
- France ~11% less Weather-Dependent “Renewables” installed than their annual power output
Such over installation results in power wastage whenever weather conditions are favourable for “Renewables” production.
The imposed policy of insisting on Weather-Dependent “Renewables” is an effort to gather power dilute sources of power and use those dilute intermittent power sources to replace reliable and productive power generators. Conventional power generators Coal-firing, Nuclear, Gas-firing can operate and 80%-90% productivity.
The imposition of Weather-Dependent “Renewables” onto the a Nations power generation fleet results in loss of overall productivity for the whole power sector, with results as follows:
- Germany: generation fleet productivity is reduced to 30%
- the UK: generation fleet productivity is reduced to 45%
- France: generation fleet productivity is reduced to 55%
- the combined Germany – the UK – France: generation fleet productivity is reduced to 41%.
In other words the policies of imposing Weather-Dependent “Renewables” has already lead to massive loss of performance of the power generation fleet of any Nation embracing the dogma of Net Zero / Catastrophic Climate Change.
Low productivity means that the capital and running costs of power generation installations are nonetheless geared to the scale of the installations and not to their actual power production.
When the comparative costs account for their achieved productivity, these simple sums show that any claim that Wind and Solar power are cost competitive with Conventional fossil fuel power generation are patently false.
Never forget Sun Tsu’s first art of war:
“The supreme art of war is to subdue the enemy without fighting.”
That is exactly what is happening as Western governments pursue self-harming Green Energy policies. There is no better way to damage Western societies than by rendering their power supplies unreliable and expensive.
Data Sources
The data is condensed from Gridwatch to Hourly intervals:
- for the UK 5 minute intervals
- for France 15 minute intervals
Note that French data is missing for a few days in March 2023
Those data were condensed to hourly intervals
The German data was provided by Rolf Schuster
I know we are well in the merde, but I think omitting China in the charts is a mistake.
I think the yellow line is China in the charts.
This is the problem with Per Capita measurements. Probably half or more Chinese have no access to electricity and don’t own ICE vehicles. Just Ox carts and candles.
Does China have energy poverty?
Many households cannot access modern energy for cooking and heating with more than 400 million Chinese still use traditional biomass and coal for cooking. 48.98% of households live in a state of energy poverty (Zhang et al., 2019).
Given the lack of access, China should only include the energy proficient population when figuring their per capita rate. This would Likely take them from their 7.37 annual tons per head up to near 14.74 tons per head (double current per capita figures) more in line with the US’s 14.58 T/H
Regardless, China is responsible for almost 1/3 of ALL global emissions
We so totally are and here is the reason;
Headline:“The number of civil servants has risen by 100,000 since 2016 with taxpayers footing a £17 billion bill for salaries
Because most of them are Grauniad readers BBC addicts and green activists, wallowing in junk science, comfy offices, above average salaries and non-contributory solid-gold pensions
Plenty folks will tell you that that is why Rome fell apart – at the very peak of their lovely Warm Period
https://www.dailymail.co.uk/news/article-12387051/Number-civil-servants-grown-100-000-taxpayers-footing-17-billion-bill.html
Most of ‘em work from home
Most of ‘em “work from home”
““work from home””
With regular trips to the local cafe for their soy decaf lattes !
Nah they have Uber Eats deliver those Soy Decaf Lattes.
True.
Germany is using nearby grids to use THEIR quick-reacting, counteracting/balancing plants, because Germany’s remaining fleet of such plants can no longer do that.
If France and the U.K. were stupid enough to go the Germany route, all hell would break loose.
Denmark big wind cannot function without connection to the Norgrid.
China, Russia, India, and at least 50 other fossil using countries, have no intention to be pushed by the West into their scare-mongering, the world is boiling, rules-based, weather-dependent, renewables abyss.
They like more CO2, because it helps feed their people.
They will form an alternative trading block, use their own currencies, instead of the precarious/weaponized dollar, with its own SWIFT system, to protect themselves from Western intimidation, sanctions, and continued exploitation..
“Germany: overall generation fleet productivity is reduced to 30%“
But they never say from what. There is only the airy statement
“Conventional power generators Coal-firing, Nuclear, Gas-firing operate and 80%-90% productivity.”
But they are different things. The first is got by dividing production by rated capacity. The second is the productivity, when they have been switched on. If you look at the production curve over time, a fleet large enough to meet the peak demand has to be unoccupied for a large % of the time, so if you made the same calculation, annual production/rated capacity, it would be much less.
It is a pointless statistic anyway. The basic economics are well known. W&S are cheap to produce, and use no fuel. The downside is intermittent production.
“China, India and other rapidly growing Nations have no concern about growing their much more significant CO2 emissions”
In fact the emissions per capita graph is revealing here. Their emissions are significant only because their populations are large.
Nick, if you can read this excellent report and find reason(s) to support wholesale advancement of “renewables” you are truly psychotic. No, wait, that’s not the word…Psychic, that’s the word. Psychic.
Psycho-something, anyway.
Nick is engaging in inane babbling.
It would be best to just ignore him.
He is not worthy of being responded to.
I agree, this is an excellent paper, an eye opener for most people
I have been making the same points in my articles, ever since the ENERGIEWENDE started, more than 20 years ago, because I saw what the outcome would be well before others
The rotor blades are fiberglass.
When looking at the blades in slow motion, with gusty winds at sea, you can see the blades vibrating. This causes delamination of the layers, just as with fiberglass sailboats in rough seas.
The 100-meter long rotor blades need to be replaced with a better design.
Also, the vibration of the blades imposes stresses on the driveshaft and bearings, well in excess of the forces they were designed for.
All this has been known for some years in the big wind industry, but the industry wanted to go to 10 to 15 MW units, 900 ft high, with more than 100-meter blades, without the years of testing to be prudent, and now the “chickens are coming home to roost”.
Have you ever stood under one of those things when it’s windy? Noisy! For some reason there’s slack in the blade mechanism and every time one comes over the top there’s a loud “clank.” Point is they sound like they’re beating themselves apart. One can hope.
You need to look at slo-mo videos of blades at sea, during gusty winds, when almost all of the damage is done.
In Germany, as part of social policy, land-based wind turbines are distributed all over Germany, to have everyone share the visual pain, even though the best winds are in the North of Germany.
The North looks awful, like a large pincushion.
Wind turbines everywhere
Glad to see you aren’t pontificating on that which you have zero knowledge – the UK.
Is he actually clutching at straws?
Most likely
But the same installation using fossil fuels can be ramped up and down as necessary whenever demand varies. For ‘renewables’ there needs to be a vastly greater installation to compensate for the lower production from a larger rated capacity and even then it cannot be ramped up and down to match demand variations without fossil fuel backup.
Yes, they can be ramped up and down. But you have to build them. There is capital cost. The author is comparing delivered MW/all faceplate MW for W&S vs delivered MW/operating MW for FF.
The issue of whether it’s worth building W&S for a fractional return depends on the cost of building, which isn’t mentioned.
Nick pontificates: “There is a capital cost …The issue of whether it’s worth building W&S for a fractional return depends on the cost of building, which isn’t mentioned.” Actually those cots to build FF replacements are easily estimated.
You still have not commented on that estimate the several timers I have pointed them out to you. ((total Demand/minimal W&S output)*current W&S investment=total times current W&S investment needed)
Using your data from a prior thread that was calculated to 5,500 times current investment levels. Using ERCOT Winter Storm Uri data it calculates to 35 times the then W&S investment level.
You can not admit these simple costs are relevant to the actual DELIVERY price of each W&S electron.
We can not stop you from deluding yourself, but please stop trying to delude the rest of us. We know better.
Here is a wiki plot from EIA data of capacity factors for various sources. Coal and gas are around 50%.
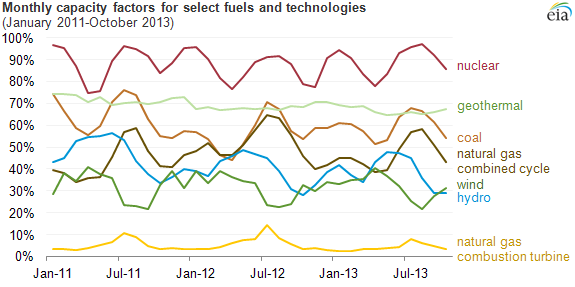
That’s a pointless statistic. What determines capacity factor of coal and gas is not the same as what determines capacity factor of wind & solar.
And back-up for when W&S are producing f-all isn’t free, it’s a real but conveniently forgotten cost of building W&S.
The effect of the capacity factor is the same. You have to build more equipment in that ratio.
Nick admits: “You have to build more equipment in that ratio.” But, you forget that the ratio is not to nameplate values, it is to W&S’s actual production efficiency values.
It is you and your friends who propose to replace thermal sources with W&S. To do that you need to build W&S to meet demand. How high do we need to overbuild solar to raise night time efficiency values above ~ZERO????
I’ll wait for your next failure to respond.
Same point I made above. 10 solar panels * 0 W output = 0 while 10,000 panels * 0 W output = 0. It doesn’t matter how many you build if the sun ain’t shining and the wind ain’t blowing.
The grid will need more electricity as time goes forward.
That means that wind and solar will have to be backed-up by more and more reliable supplies, under-utilised.
Paying for a dual system with inherent unreliability, when a very reliable single system based on just coal, gas, nuclear, and hydro (where appropriate) would be a far better option…
… is just political and economic stupidity.
So it is natural for Nick to support it.
Correct. What the more useful metric is, is availability Fossil nuclear and hydro have >80% availability. Renewables around 10% for solar and 35% for wind.
And of course in te limit, gas oil, coal and uranium are all free too. Yoiu just have to dig them up.
Your figures are pointless because many of the FF capacity factors are reduced because they are in back-up modes. Go back to say 1980 and post the capacity factors for FF generators. That will show you what they are capable of. You are comparing Golden Delicious apples to stunted Crab Apples.
That chart shows that when wind is off line you have to have more FF and hydro. That’s nothing to do with the availability of FF generation but all to do with the availability of wind.
Nice try, and worthy of the BBC. You should try for a job there.
Nick being disingenous as always. LIES within LIES.
He knows that coal and gas are being throttled down so wind and solar can be used on the grid.
Without mandated wind and solar, coal and gas can run near 100% nameplate for long period of time.
What he is showing is the maximum for wind and solar….
… and the throttled utilisation for coal and gas, showing it is not being used to maximum efficiency.
The fact that he KNOWS this, and still goes on with this sort of nonsense, really shows what sort of devious ill-intentioned shill he is.
It doesn’t matter how many you build if the wind isn’t blowing. 10 X 0 watts is the same as 10,000 X 0 watts output. Science.
“China, India and other rapidly growing Nations have no concern about growing their much more significant CO2 emissions”
“In fact the emissions per capita graph is revealing here. Their emissions are significant only because their populations are large”.
Nick, I am pretty sure that the unlabelled yellow line in the charts is China. As you can see, China’s emissions per head already exceed most of Europe’s large industrial countries like France and the UK.
Yes. But still about half the US.
That is known in the trade as ‘damning with faint praise’.
Bill Toland says:
China’s emissions per head already exceed most of Europe’s large industrial countries like France and the UK.
You reply:
Yes. But still about half the US.
So what? This has been a continuing intellectual contortion of the alarmists since day one. The argument started with the claim that the West was producing most of the emissions causing the alleged crisis. So it was guilty and should stop.
Then China etc overtook in total emissions, so the argument then moved to the claim that China had lower per capita emissions, so we should accept that it had a right to destroy human civilization, it was only fair.
Then it turned out that China’s emissions got so high that they were, per capita, higher than Europe. So the argument then moved to a variety of irrelevant claims, like that they were installing lots of wind and solar, or that their historical emissions were lower than the Wests (which I don’t think they are any more…), or that they were only emitting so much in order to export.
As if the climate cares about any of this. The alarmists ought to believe its only the gross tonnage that counts.
The plain and obvious fact is that no-one outside the English speaking countries shows any real sign, in terms of policy, of believing in CAGW.
If you really believe in it, then your fury should be directed at China, and you should tolerate no excuses. Because if you are right about CAGW, you must consequently believe that China is single handedly destroying human civilization on earth. Assisted to a modest extent by India, Indonesia, etc.
Instead however one notices that on every occasion, whether its COP or discussion, every possible contortion is indulged to excuse whatever China is doing, and the demand is for the West to unilaterally do expensive and useless things which will fail to make any impression on global emissions.
If you export emissions to Asia, then you are no longer responsible. The fact that you continue to use those products that are now imports is the very definition of hypocrisy.
“W&S are cheap to produce, and use no fuel. The downside is intermittent production.”
Mr Stokes does this help
Discounting regular maintenance then up time for FF generations will be in excess of 97%. For any source of electricity including renewables down time for regular maintenance is required.
Nuclear power stations and coal-fired power stations usually provide ‘base load’ electricity – they are run all the time because they take the longest time to start up. Oil-fired and gas-fired power stations are often used to provide extra electricity at peak times, because they take the least time to start up. But both can be run continuously.
Pushing a technology too far too fast results in even more down time,
For example issues that revolve around quality problems at Siemens Gamesa’s two most recent onshore wind turbine platforms, the 4.X and 5.X, specifically certain rotor blades and main bearings.
The company said that while around 2,100 4.X and 800 5.X models were in the field, not all of those turbines were affected by the problems, which include wrinkles in rotor blades and unspecified particles in the bearings section.
The modern steam turbine was invent by Sir Charles Parsons in 1884, and was very quickly used to generate electricity and power warships. The human race has had over 125 years experience of using steam turbines to produce electricity. Gas turbines, in their modern form, are almost as old. As a result like the Internal Combustion Engine we’ve become very skilled at making reliable turbine systems to generate electricity.
W&S are cheap and use no fuel? What a card you are. They don’t service themselves and they dont get made with renewable energy either.
The usual intellectual contortions. The problem with wind and solar is that you cannot rely on it. Its not that its intermittent. Its that it is intermittent and unpredictable.
The problem with wind is that it may deliver 30% or so of faceplate. But it doesn’t deliver that 30% when you need it, so the useful delivery is much lower even than that. The same with solar. It delivers even lower % of faceplate. But not when you need it, on winter evenings in January and February. So its useful delivery is also even lower.
Coal and gas and nuclear do deliver when you need it. They are continuous and predictable sources.
There are no W&S grids. There are hybrid grids with a base predictable rapid start gas system, which is turned up and down to match the vagaries of the wind and sun.
You keep claiming that the fuel savings justify adding the wind and solar to the mix. But you have never, despite repeated requests, ever produced or linked to any study showing that a mixture of W&S with rapid start gas is more cost effective than a conventional grid, combined cycle gas and/or coal, with a peaking element.
And you also keep claiming wind is cheap. Its only cheap if you leave out the large costs of deploying it and using it.
You’re not honest. You keep making these assertions with no basis for them. And sometimes, as in your last sentence
Their emissions are significant only because their populations are large.
what you say is plain false. Worse, its an attempt at obfuscation. Because what you should believe is that it makes no difference why they are emitting a given level of tonnage. All you should think matters is that the tonnage is high. Its only, you should think, the tonnage that counts.
But you keep on twisting and turning, trying to imply that those doing the most of what you ought to believe are civilization destroying emissions are in some way not responsible for the consequences, or entitled to carry on increasing them.
While you try to justify policies for the UK, US, Australia, NZ which will impoverish them while making no impact whatever on global emission tonnage.
Its completely dishonest.
You missed A very important factor…
Their populations are large and vastly energy impoverished
Does China have energy poverty?
Many households cannot access modern energy for cooking and heating with more than 400 million Chinese still use traditional biomass and coal for cooking. 48.98% of households live in a state of energy poverty (Zhang et al., 2019).
What is the energy poverty in India?
India faces acute energy poverty indicating lack of access of clean energy fuels. Access to electricity is limited to 56% households in India and about 89% of rural households depend on polluting energy sources (like cooking with Coal).
Regardless of their “per capita” claims, because almost 1/2 of their population is energy impoverished only about 1/2 of their population is responsible for 1/3 of all global emissions
And all for what purpose? Reducing CO2 emissions. I am still waiting to see proof that human-produced C02 emissions are responsible for anything negative to do with “climate”..
Forget waiting for proof, there’s simply no evidence.
Vaguely on/off topic but a lovely indicator of The Madness that has engulfed (certainly at least), the UK
Start here:“Most UK Coal-fired power stations were demolished before the end of their useful lives rather than being mothballed for possible use as reserve.
A story concerning a pub. Not your usual kinda pub but a ‘wonky’ pub.

Just ‘ordinary’ wonky in that it was built atop some mine workings, which subsequently collapsed and the pub took on its distinctive wonkiness. (the coal mine is a nice touch innit)
Anyway, over this last weekend for whatever reason it caught fire and was completely gutted.
All there was left was the brick-built outer walls/shell.
Then on Monday, somebody (presumably the owner) brought in a Hymac and flattened the thing. Reduced to a pile of broken bricks and other rubble.
And why not, it was on the point of falling over even before it took fire and the fire was hardly gonna improve its ‘standing’
Then during school holidays it would be a magnet for kids to come play among.
And yesterday (Tues) the owner is now in So Much Legal Shit for doing that – for flattening a burnt out pile of bricks that was gonna fall over anyway and be hideous safety hazard for folks even just venturing near – let alone the local kids making a playground out of it.
While the same folks accusing him of so much badness are the very ones (same mentality) that cheerfully flattened perfectly serviceable power stations
BBC Headline:“Demolition of Crooked House pub unacceptable – council
While they cheerfully trash the cars (via ULEZ) of vast numbers of people, trash their homes with HighSpeedTrains and trash their finances with endless new taxes, heat pumps and electric cars
….all based on the antics of Dancing Faeries and what the Emperor’s wearing today and thus under the delusion that they’re ‘Saving The World‘
They could not be more wrong. About everything.
Question: Where would anybody in this train-wreck be if that pub fell over in the hour leading up to midnight on any December 31st – when there’d be possibly hundreds of folks in there?
As the land can be redeveloped, the pub was about to be listed, it had been sold a matter of days before catching fire and was demolished before any forensic investigation could take place.
You might think all these things were not a coincidence.
If the Germans have shut down their nuclear generators, can (say) France not buy them, fire them up again and use the electricity themselves? (Or even sell it back to the Germans?)
I’m surprised that the Chinese haven’t already tried that 🙂
People who don’t read Watts Up need simple sentences and simple concepts in order to understand the problems these intermittent renewables are causing.
It’s replacing modern ships with sailboats.
It’s replacing cars with bicycles.
It’s replacing airplanes with … nothing.
It’s replacing “user pays” with “everybody pays”.
“And on average it’s going to cost every man, woman and child in the USA $XXX,XXX,XXX in taxes and future debt.”
Simple concepts that can be promoted with ads and posters. Warmers must be forced to put $numbers on all their plans.
“A new report just out from the Global Warming Association says that replacing natural gas for home heating will cost the average American $X,XXX.XX.”
“A new report just out from the Global Warming Association says that replacing petroleum-based jet fuel with a green alternative will cost the average American $X,XXX.XX.”
“Greening America over the next 10 years will cost more than fighting World War Two and will bring back rationing.”
“The taxpayer funded US government is broke and even Bill Gates can’t bail it out.”
Well, I’d like to see them confiscate Gates’ ill-gotten riches anyway!
[Then he could be called Pay-the-Bill Gates.]
““Greening America over the next 10 years will cost more than fighting World War Two and will bring back rationing.””
Rationing is a major part of “Greening America” plans…
.. for everyone except the elite and the climate glitterati.
A far better way to “Green” America, would be to start beefing up the use of coal fired electricity.
if i wanted to build a conventional power plant and said it would produce 15-30% of face value., i would be laughed out of the meeting
8 colored lines. 6 legends.
Honestly who makes these graphs?
Oh and capacity factor is not actually a measure of efficiency per se…
True but it is a measure related to the utilisation of the capital invested.
The main take away from this story is the the addition of WDGs is causing a deterioration in the utilisation of existing generating assets so their unit costs are also increasing.
The coal fired generators in Australia make much higher price offers for evening peaks on windless days because they know they can offer just under the cost of gas and they will be scheduled. So their offer for evening peaks makes up for the negative offers through the day to stay scheduled at minimum stable output.
The most economic way to operate any thermal plant is up around 90% of nameplate continuously. That will minimise the maintenance burden because the thermal cycling is minimised. WDGs have high cost impact on thermal plant. Thermal plants in Australia bid high negative prices through the day so they get scheduled. The grid scale WDGs curtail for economic reasons as soon as the price falls below the subsidy because they have little opportunity to recover negative prices.
Prices have been negative in Queensland since 0840 today – per attached. Now at minus $41/MWh and the grid scale solar farms have been curtailing output since just before 0900.
http://nemlog.com.au/gen/region/qld/
From the article:
I hate this term, it means nothing to the end user who pays the ultimate bill. It is a COST that is covered by the people paying for electricity. It is only a “negative” price to the provider who pays it before adding it to the costs distributed to the end user.
If you want to win the propaganda war, don’t use terms that tend to isolate the actual people footing the bill for these monstrosities. Everything should be done in relation to what the price of electricity to the end user will be.
It won’t be long now, and it will probably come from more angles than they expected.
story tip
German electric cars are too expensive, top economic adviser to Berlin admits (yahoo.com)
That’s ok, they will soon have to import ultra-reliable (lol) Chinese EVs…
… because they won’t have the cheap energy availability to build them in Germany.
That will mean they will have to boost their fire-fighting force 10-fold or more.
“they will have to boost their fire-fighting force 10-fold or more.”
ps.. They will refer to this massive increase in required number of fire fighters…
… as “Green” jobs. !
The article’s 2rd graph, labeled
EU(27) + UK … productivity: 2011 – 2022
shows offshore wind at substantially greater actual productivity than onshore wind. Not to say that it is good, only that it is more than a little better. However, the combined wind total is hardly different than onshore wind. This doesn’t seem to compute. Can anyone offer insight as to how the depiction is actually reasonable?
I think its because there is a lot more onshore than offshore wind installed. Look at his other charts and you see 89.5GW onshore and only 20.1GW offshore. This is for Germany UK and France.
Offshore is hard and expensive both to install, maintain and to use.
It is worth noting here that you cannot predict future capacity factors using current capacity factors for WDGs that are based on relatively low penetration.
Once the cost of storage and transmission are factored in, to make high penetration of WDGs possible, the capacity factors for the WDGs drops to single digit for a minimum overall power cost system.
I operate a small off-grid power supply and the the CF of the solar panels for a minimum power cost including the battery cost is 3.8%.
Expanding offshore wind energy collection gets into the realms of changing climatic conditions by adverse reduction in moist air advection.
Very nice Ed. This critical information needs to be shared worldwide but more importantly throughout the west. I can’t believe we westerners are so gullible/ignorant. It takes my breath away.
Simply demand reasonable level playing field dispatchability and guess what happens with the economics of solar farms?
“Those generator performance standards are demanding a very high level, and in many ways, an unrealistic level of control,” he said.
“It means those solar farms have to put in large batteries … to be able to meet the generator performance standards, and that is just unrealistic, because of the expense.”
Author of NT government’s renewables road map criticises regulation of solar farms amid calls for further investment (msn.com)
As if we didn’t know what dumping and bludging on coal and gas generators is all about.