Page MenuHomePhabricator

Severe save latency regression
Closed, ResolvedPublic

Assigned To
ori
Authored By
ori
Feb 12 2016, 1:03 AM
Referenced Files
F3649116: render-12.png
Mar 17 2016, 11:59 AM
F3503068: download (1).png
Mar 1 2016, 10:38 PM
F3402595: ab_T126700-wmf12.txt
Feb 23 2016, 2:54 AM
F3402594: ab_T126700.sh
Feb 23 2016, 2:54 AM
F3402596: ab_T126700-wmf13.txt
Feb 23 2016, 2:54 AM
F3401121: Screen Shot 2016-02-22 at 18.23.41.png
Feb 22 2016, 6:26 PM
F3401117: Screen Shot 2016-02-22 at 18.21.24.png
Feb 22 2016, 6:26 PM
F3401120: Screen Shot 2016-02-22 at 18.23.34.png
Feb 22 2016, 6:26 PM

Description

Grafana board https://grafana.wikimedia.org/dashboard/db/t126700
Experimental board for Nutcracker https://grafana.wikimedia.org/dashboard/db/nutcracker
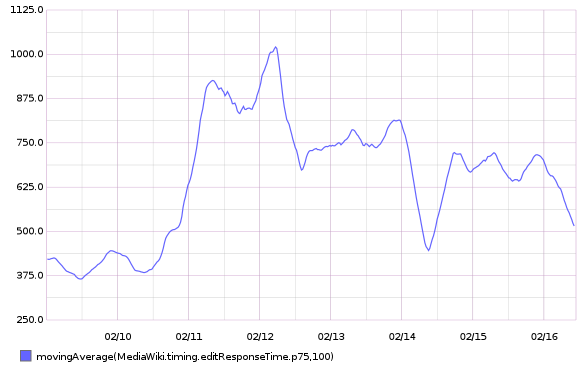
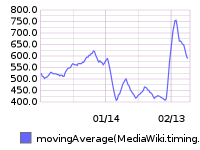
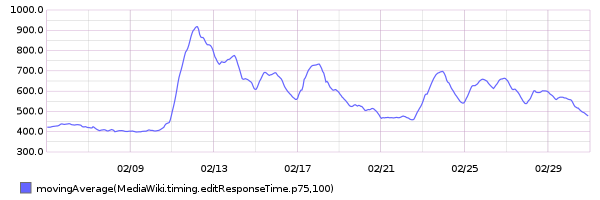
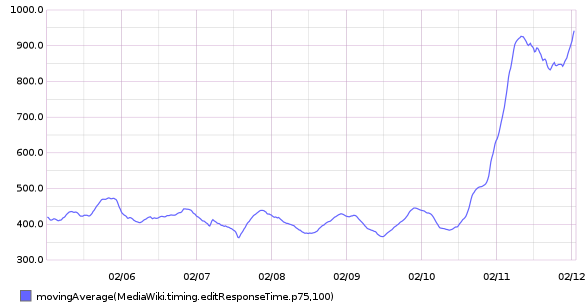
75th percentile save latency has nearly doubled over the past 32 hours. The spike started around 15:00 UTC on Wednesday, February 10:

sl.png (308×586 px, 18 KB)

From 20160209 00:00 until 20160216 23:59:

render-8.png (368×586 px, 22 KB)

This metric is calculated within MediaWiki, so it can't be related to T125979: Disable SPDY on cache_text for a week.

SAL entries from that time (+/- 1hr):

  • 15:22 elukey: disabled puppet/memcached/redis on mc1006.eqiad
  • 15:02 bblack: SPDY disable for cache_text: test starts in a few minutes!
  • 14:48 elukey: removed mc1006 from the redis/memcached pool for Jessie migration
  • 13:48 godog: restbase1002 nodetool setstreamthroughput 500
  • 13:24 elukey: adding mc1005.eqiad back into service (redis/memcached)
  • 12:51 jynus: restarting hhvm at mw1015 - db errors continue
Event Timeline

There are a very large number of changes, so older changes are hidden. Show Older Changes

@jcrespo correlation does not mean causation, and in fact I am not sure at all that the two events are causally linked.

I proposed to stop the reimaging for today so that we can test if it has any effect on the save times regression.

Better from last week, but we have still not fully recovered:

p75

Screen Shot 2016-02-15 at 9.50.46 AM.png (900×1 px, 314 KB)

p50

Screen Shot 2016-02-15 at 9.50.58 AM.png (884×1 px, 330 KB)

Kernel versions:

10 3.19.0-2-amd64
 2 3.2.0-31-generic
 1 3.2.0-34-generic
 1 3.2.0-38-generic
 2 3.2.0-45-generic
 2 3.2.0-76-generic

Memcached versions:

 8 1.4.15-0wmf1
10 1.4.21-1.1

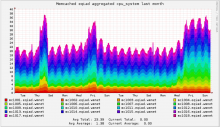
Sys CPU usage % went up a bit:

Screen Shot 2016-02-15 at 10.00.51 AM.png (912×1 px, 937 KB)

Mem cached/buffers changed a bit but nothing that impacting (MBs if I am reading it correctly in Ganglia), and memfree is back to what it was before the switch (more or less).

Lot of changes of course happened: new Kernel + OS + memcached version.

Memcached current items stored, if I read it correctly, should show a good overview of the status of the caches:

Screen Shot 2016-02-15 at 10.15.41 AM.png (908×1 px, 383 KB)

At this point I think it would be really useful to understand what is the relationship between edit actions and memcached before proceeding, to establish the best investigation path. As Joe was pointing out we have only found examples of correlation, but we are unsure about the causation bit.

@ori,@Joe: pulling you in to figure out the best course of action.

if we look at all the latency metrics, they are nowhere near being back to the mean and honestly the latency we still see cannot be due to cache coldness, as the caches are now hot.

Also, I am unsure how memcached coldness would affect saving articles, but maybe @ori can clarify that.

I'd still avoid reimaging more servers before we're sure this is unrelated anyways.

Memcached configs:

mc1008.eqiad.wmnet: (DEBIAN)

nobody     792 46.0 92.4 92497732 91531152 ?   Ssl  Feb11 2592:06 /usr/bin/memcached

-p 11211
-u nobody
-m 89088
-c 25000
-l 0.0.0.0
-n 5
-f 1.05
-D :-o slab_reassign

mc1018.eqiad.wmnet: (UBUNTU)

nobody   19677 39.0 92.6 93160048 91646764 ?   SLl   2015 207048:06 /usr/bin/memcached

-m 89088
-p 11211
-u nobody
-l 0.0.0.0
-c 25000
-k
-n 5
-f 1.05
-D : -o slab_reassign

-k (memlock) seems to be missing in the Debian config, but I am not sure yet how (and if!) this could influence memcached behavior.

Screen Shot 2016-02-15 at 1.17.50 PM.png (910×1 px, 345 KB)

If am reading it correctly all the hosts that I moved to Debian are now showing 0 evictions registered (or at least several orders of magnitude less than before).

It may not be related to the re-imaging, but it is definitely related to memcached.

There is a log bucket on fluorine, /a/mw-log/memcached-keys, which is generated by having an hourly cron job capture 10 seconds' worth of memcached GETs. Look at the file sizes:

[fluorine:/a/mw-log/archive] $ ls -la memcached-keys.log-201602*
-rw-r--r-- 1 udp2log udp2log   171153 Feb  1 05:27 memcached-keys.log-20160201.gz
-rw-r--r-- 1 udp2log udp2log   169835 Feb  2 05:27 memcached-keys.log-20160202.gz
-rw-r--r-- 1 udp2log udp2log   170452 Feb  3 05:27 memcached-keys.log-20160203.gz
-rw-r--r-- 1 udp2log udp2log   170052 Feb  4 05:27 memcached-keys.log-20160204.gz
-rw-r--r-- 1 udp2log udp2log   163494 Feb  5 05:27 memcached-keys.log-20160205.gz
-rw-r--r-- 1 udp2log udp2log   171735 Feb  6 05:27 memcached-keys.log-20160206.gz
-rw-r--r-- 1 udp2log udp2log   169077 Feb  7 05:27 memcached-keys.log-20160207.gz
-rw-r--r-- 1 udp2log udp2log   170642 Feb  8 05:27 memcached-keys.log-20160208.gz
-rw-r--r-- 1 udp2log udp2log   170904 Feb  9 05:27 memcached-keys.log-20160209.gz
-rw-r--r-- 1 udp2log udp2log  2420095 Feb 10 05:27 memcached-keys.log-20160210.gz
-rw-r--r-- 1 udp2log udp2log  4426032 Feb 11 05:27 memcached-keys.log-20160211.gz
-rw-r--r-- 1 udp2log udp2log 15918136 Feb 12 05:27 memcached-keys.log-20160212.gz
-rw-r--r-- 1 udp2log udp2log 23537794 Feb 13 05:27 memcached-keys.log-20160213.gz
-rw-r--r-- 1 udp2log udp2log 22791532 Feb 14 05:27 memcached-keys.log-20160214.gz
-rw-r--r-- 1 udp2log udp2log 24305756 Feb 15 05:27 memcached-keys.log-20160215.gz
-rw-r--r-- 1 udp2log udp2log 24139555 Feb 16 05:27 memcached-keys.log-20160216.gz

If we canonicalize the key names in memcached-keys.log-20160209 and memcached-keys.log-20160213, and compare the counts, we get:

key GETs, 02/09 GETs, 02/13 delta percent diff
revisiontext:textid 136,484 1,084,022 +947,538 +694%
file 20,207 662,719 +642,512 +3,179%
messages 30,296 357,251 +326,955 +1,079%
gadgets-definition 25,299 341,249 +315,950 +1,248%
global:user 5,317 308,458 +303,141 +5,701%
image_redirect 7,000 294,013 +287,013 +4,100%
preprocess-hash 19,846 249,765 +229,919 +1,158%
messages:hash 51,559 259,563 +208,004 +403%
textextracts 432 56,713 +56,281 +13,028%
pcache:idoptions 386 53,548 +53,162 +13,772%
sidebar 7,649 50,212 +42,563 +556%
WikiPageEntityRevisionLookup 1,488 38,934 +37,446 +2,516%
pcache:idhash 212 36,138 +35,926 +16,946%
global:lag-times 3,196 16,869 +13,673 +427%
getExtendedMetadata 84 12,870 +12,786 +15,221%
flaggedrevs:includesSynced 74 12,579 +12,505 +16,898%
CachingPropertyInfoStore 3,229 15,538 +12,309 +381%
messages:zh-hans:hash 0 11,606 +11,606 -
OtherProjectsSites 996 9,572 +8,576 +861%
SiteStats:groupcounts:sysop 4,872 13,298 +8,426 +172%

Interesting addendum to what Ori posted:

elukey@fluorine:/a/mw-log/archive$ zcat memcached-keys.log-20160209* | awk '{print $4}' | sort | uniq -c | sort -n -k 1

388 mc1004:
395 mc1003:
396 mc1005:
399 mc1002:
399 mc1008:
400 mc1001:
400 mc1006:
400 mc1007:
400 mc1009:
400 mc1010:
400 mc1011:
400 mc1012:
400 mc1013:
400 mc1014:
400 mc1015:
400 mc1016:
400 mc1017:
400 mc1018:

elukey@fluorine:/a/mw-log/archive$ zcat memcached-keys.log-20160213* | awk '{print $4}' | sort | uniq -c | sort -n -k 1

UBUNTU

386 mc1002:
393 mc1001:
400 mc1003:
400 mc1014:
400 mc1015:
400 mc1016: 
400 mc1017:
400 mc1018:

DEBIAN

 79882 mc1007:
 87603 mc1006:
 89563 mc1005:
 92821 mc1008:
 96582 mc1011:
100324 mc1010:
101637 mc1004:
102778 mc1012:
107583 mc1009:
122595 mc1013:
hashar subscribed.

From 20160209 00:00 until 20160216 23:59:

render-8.png (368×586 px, 22 KB)

Note that @ori has asked a few hours ago about delaying the deployment train for MW-1.27-release (WMF-deploy-2016-02-16_(1.27.0-wmf.14)).

Since I am lazy tweaking Graphite URL, I created a dashboard in Grafana. It shows the last 7 days of 75 percentiles with marks at 550 ms and 750 ms response time.

https://grafana.wikimedia.org/dashboard/db/t126700

One can clearly notice the huge drops which seems to indicate performances are restored from time to time. Specially:

2016-02-14 00:30 goes down

2016-02-14 10:00 -> 10:20 up

We had a huge spike at 2016-02-16 03:34

2016-02-16 around 6:30 goes down

Not sure how helpful that is.

Compared mc1009 (Debian) vs mc1018 (Ubuntu) taking values from memcached stats in two different point in time (~1.30 hrs timespan).

https://docs.oracle.com/cd/E17952_01/refman-5.6-en/ha-memcached-stats-general.html

Debian mc1009

total_connections ---> snapshot1: 35996 snapshot2: 36427 delta: 431
curr_connections ---> snapshot1: 534 snapshot2: 534 delta: 0
total_items ---> snapshot1: 95396669 snapshot2: 96485897 delta: 1089228
curr_items ---> snapshot1: 33793561 snapshot2: 33793670 delta: 109
conn_yields ---> snapshot1: 0 snapshot2: 0 delta: 0
cmd_get ---> snapshot1: 2777387899 snapshot2: 2814879212 delta: 37491313
cmd_set ---> snapshot1: 96245657 snapshot2: 97338439 delta: 1092782
get_hits ---> snapshot1: 2571237545 snapshot2: 2606128166 delta: 34890621
get_misses ---> snapshot1: 206150354 snapshot2: 208751046 delta: 2600692
evictions ---> snapshot1: 2885403 snapshot2: 3009300 delta: 123897

Ubuntu mc1018 stats:

total_connections ---> snapshot1: 3730812 snapshot2: 3731220 delta: 408
curr_connections ---> snapshot1: 533 snapshot2: 533 delta: 0
total_items ---> snapshot1: 3461753419 snapshot2: 3463050048 delta: 1296629
curr_items ---> snapshot1: 37042825 snapshot2: 37042883 delta: 58
conn_yields ---> snapshot1: 333 snapshot2: 333 delta: 0
cmd_get ---> snapshot1: 236612042583 snapshot2: 236654519168 delta: 42476585
cmd_set ---> snapshot1: 10045924525 snapshot2: 10047215966 delta: 1291441
get_hits ---> snapshot1: 220386480659 snapshot2: 220425982465 delta: 39501806
get_misses ---> snapshot1: 16225561924 snapshot2: 16228536703 delta: 2974779
evictions ---> snapshot1: 2292644685 snapshot2: 2293015947 delta: 371262

@elukey since those stats are from the startup of the daemon, what is more interesing is the delta of values taken at a 1 hour distance

@Joe: definitely, I'll modify my post with deltas in one hour.

Info about how Ori's script gathers data:

#!/bin/bash
# Log 10 seconds of memcached activity to a file.
# Meant to be invoked by cron.
set -e
set -u
TIMESTAMP="$(/bin/date +"%Y_%m_%d")"
/usr/bin/timeout --kill-after=15s 10s                          \
    /usr/bin/memkeys -i eth0 -R csv -l /dev/null 2>/dev/null | \
    /bin/grep -v "key,count,elapsed,rate,size,bandwidth"     | \
    /usr/bin/tee -a "/var/log/memkeys/${TIMESTAMP}.csv"      | \
    /usr/bin/logger --tag memcached-keys

I tried to re-run my calculations for mc1007 and mc1005 (one hour timespan) as above but I didn't see the huge discrepancy that ori spotted with mem-keys, so I am probably missing something.

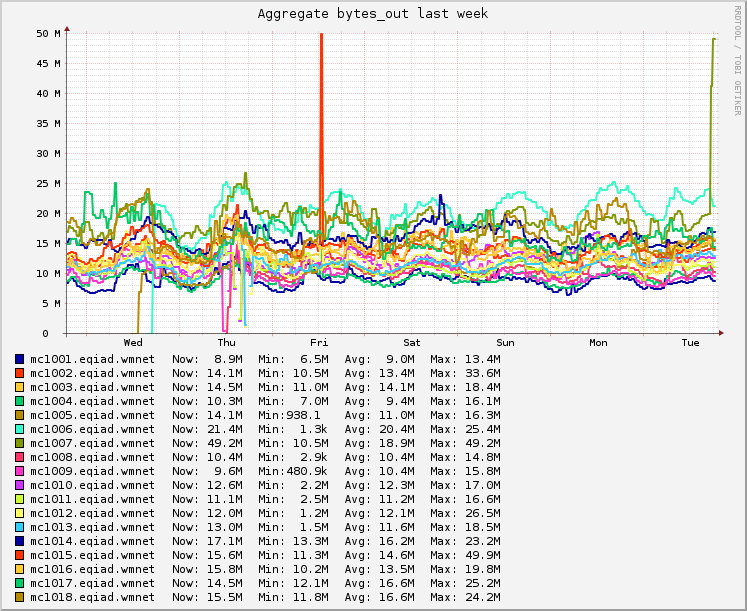
Traffic on the mc10* boxes is not balanced:

graph.png (611×747 px, 123 KB)

Some config differences:

--- mc1014.conf	2016-02-16 10:50:19.000000000 -0800
+++ mc1005.conf	2016-02-16 10:50:34.000000000 -0800
@@ -1,7 +1,7 @@
 # memcached default config file
 # 2003 - Jay Bonci <jaybonci@debian.org>
 # This configuration file is read by the start-memcached script provided as
-# part of the Debian GNU/Linux distribution.
+# part of the Debian GNU/Linux distribution.

 # Run memcached as a daemon. This command is implied, and is not needed for the
 # daemon to run. See the README.Debian that comes with this package for more
@@ -17,42 +17,31 @@
 # Be even more verbose (print client commands as well)
 # -vv

-# Start with a cap of 2000 megs of memory. It's reasonable, and the daemon default
+# Start with a cap of 64 megs of memory. It's reasonable, and the daemon default
 # Note that the daemon will grow to this size, but does not start out holding this much
 # memory
--m 89088
+-m 64

-# Default connection port is 11000 ( Wikimedia specific, general default is 11211 )
+# Default connection port is 11211
 -p 11211

-# Run the daemon as nobody. The start-memcached will default to running as root if no
+# Run the daemon as root. The start-memcached will default to running as root if no
 # -u command is present in this config file
--u nobody
+-u memcache

 # Specify which IP address to listen on. The default is to listen on all IP addresses
 # This parameter is one of the only security measures that memcached has, so make sure
 # it's listening on a firewalled interface.
-# -l 0.0.0.0
--l 0.0.0.0
+-l 127.0.0.1

 # Limit the number of simultaneous incoming connections. The daemon default is 1024
--c 25000
+# -c 1024

 # Lock down all paged memory. Consult with the README and homepage before you do this
--k
+# -k

 # Return error when memory is exhausted (rather than removing items)
 # -M

 # Maximize core file limit
 # -r
-
-# Minimum size allocated for key+value+flags, may not be used nor allocated, just good base value
--n 5
-
-# Chunk growth factor - allows more steps and better memory efficiency too
--f 1.05
-
--D :
--o slab_reassign
-

Per discussion with Ori I have added to the Grafana board at https://grafana.wikimedia.org/dashboard/db/t126700 the 75 percentile of metric hhvm.*apc.entries.count that comes from https://grafana.wikimedia.org/dashboard/db/hhvm-apc-usage?panelId=8&fullscreen

I tried to identify shifts in memcached usage trends by examining memcached-keys.log. To control for the re-imaging process, I only considered log lines from memcached hosts which have not yet been re-imaged:

#!/usr/bin/env bash
for src in /a/mw-log/archive/memcached-keys.log-201602* ; do
    target="$(basename $src .gz)"
    echo "$src $target"
    zgrep -P '(mc1002|mc1001|mc1003|mc1014|mc1015|mc1016|mc1017|mc1018)' "$src" > "~/tt2/$target"
done

The resultant log files were pretty consistent in size (~300k) for the entire time period, including days before and after the regression.

Next, I hacked together a script to aggregate counts by key type for Feb 02 - Feb 08 and then Feb 10 - Feb 16, and then produce a leaderboard of which keys have increased in frequency the most. The results was:

Key Feb 02 - 08 Feb 10 - 16 Delta
centralauth:user 12,589 131,648 +119,059
global:user 16,165 60,592 +44,427
sidebar 19,882 43,452 +23,570
messages:individual:Wikimedia:copyright 1,693 4,188 +2,495
image_redirect 31,756 33,118 +1,362
file 58,893 59,848 +955

@bd808, @Anomie, @Tgr: The fact that centralauth:user reqs have increased ten-fold is quite worrisome. I wonder if it is related to the SessionManager deployment. Do you have a means of checking that?

I have created an experimental grafana board for Nutcracker. Might help find some issue with memcached https://grafana.wikimedia.org/dashboard/db/nutcracker

For the increase in centralauth:user key, any change that caused session to be initialized more often could have contributed. Introducing static.php probably did that (resource requests that miss varnish now are same-domain, pass through PHP and call MediaWiki's Setup.php); according to @Anomie, SessionManager might have increased session creation on non-page requests (load.php or api.php). Another thing that could have caused massive session rechecks is the token reset.

In T126700#2033767, @Tgr wrote:

For the increase in centralauth:user key, any change that caused session to be initialized more often could have contributed. Introducing static.php probably –

That entry point wasn't activated when the regression started last week. It was enabled yesterday, and still only for testwiki and test2wiki.

In T126700#2033767, @Tgr wrote:

SessionManager might have increased session creation on non-page requests (load.php –

Is that by design, or are you speculating about a potential bug that was introduced? In general, load.php should be able to return without ever considering any session (it usually doesn't touch wgUser, and certainly doesn't read or write to session).

Is that by design, or are you speculating about a potential bug that was introduced?

To make session loading and user auto-creation sane and predictable, SessionManager loads the session and (if necessary) auto-creates the user in Setup.php instead of leaving it to be triggered at random times during the request processing.

In general, load.php should be able to return with ever considering any session (it usually doesn't touch wgUser, and certainly doesn't read or write to session).

It will need the session user for some modules, such as ResourceLoaderUser*Module. Otherwise we could just have it define MW_NO_SESSION.

Is that by design, or are you speculating about a potential bug that was introduced?

Speculation about a potential side effect. The old code could lazy-load sessions, the new one always loads them in the initialization phase.

In general, load.php should be able to return with ever considering any session (it usually doesn't touch wgUser, and certainly doesn't read or write to session).

If that's true all the time (on private wikis, with extensions that try to control read access etc), it should probably set MW_NO_SESSION. Same for static.php. I wouldn't expect much effect on memcached traffic, but it might speed up those endpoints slightly (on a user cache miss, a session initialization will result in a DB lookup).

To make session loading and user auto-creation sane and predictable, SessionManager loads the session and (if necessary) auto-creates the user in Setup.php instead of leaving it to be triggered at random times during the request processing.

Hm.. okay.

In general, load.php should be able to return with ever considering any session [..]

It will need the session user for some modules, such as ResourceLoaderUser*Module. Otherwise we could just have it define MW_NO_SESSION.

In T126700#2033943, @Tgr wrote:

[..] it should probably set MW_NO_SESSION. Same for static.php.

Private user modules do indeed need to authenticate the user, however those are never served from load.php (only embedded via OutputPage). load.php explicitly refuses to serve such modules. (Remember, we used to access it via bits.wikimedia.org). I'll experiment with MW_NO_SESSION, thanks!

To make session loading and user auto-creation sane and predictable, SessionManager loads the session and (if necessary) auto-creates the user in Setup.php instead of leaving it to be triggered at random times during the request processing.

Doing it in a predictable place is great; doing it when it isn't needed at all is a bug.

Whether responding to a certain request will require session handling is not in general predictable (cf T104755#2034145), so making application bootstrapping predictable will necessarily result in unneeded loading in some cases. Choosing a more complex and less deterministic architecture to avoid a couple memcached lookups, without knowing whether they really have significant performance impact, would be a typical case of premature optimization.

More generally, I don't fully understand how this task turned into an investigation of various memcached calls. The only connection between increased memcached usage and page save time seems to be that they happened at the same time, which really only tells that they were in the same deployment branch. As far as I can see there is no reason to assume that memcached reads are the direct cause of the performance regression, and it actually seems rather implausible because 1) I would expect a memcached read to be in the sub-ms range, and we are looking at a 300ms slowdown here, and 2) session handling and user/centraluser loading probably does not differ at all for page views and page saves, and if pageviews go 300m slower as well, that would surely have triggered additional alarm bells.

Do we record weekly flame graphs or something similar? That should make it easy to identify which method calls got slower.

Whether responding to a certain request will require session handling is not in general predictable (cf T104755#2034145), so making application bootstrapping predictable will necessarily result in unneeded loading in some cases. Choosing a more complex and less deterministic architecture to avoid a couple memcached lookups, without knowing whether they really have significant performance impact, would be a typical case of premature optimization.

You have it backwards: it's not that we had predictable bootstrapping before, and are now considering making it less deterministic as an optimization strategy. It's that the change to make it deterministic did not adequately anticipate, consider, socialize, and address the performance penalty it levies, and consequently we have a possible performance regression, the existence and magnitude of which we have not ascertained, because nobody bothered to measure it. And the responsibility for making up for that lack of due diligence is apparently the responsibility of my team, TechOps, and RelEng, but not yours, if the reactive and skeptical replies are any indication.

So, no: we still don't know whether SessionManager had anything to do with this; it is distinctly possible that the fault lay elsewhere, and that this is a red herring. But I would have appreciated (and would appreciate still) if you were proactive about doing the work to rule out SessionManager as a possible culprit, rather than express doubt that it is.

In T126700#2036334, @ori wrote:

But I would have appreciated (and would appreciate still) if you were proactive about doing the work to rule out SessionManager as a possible culprit, rather than express doubt that it is.

It doesn't help your case that the timeline doesn't fit at all, @ori. Recall that SessionManager—including the specific change to session creation behavior that you're complaining about—was present in wmf.11 and wmf.13, but not wmf.10 or wmf.12.

  • 2016-01-26 22:25: Group 0 to wmf.11. No change in save time graph.
  • 2016-01-27 19:14: Group 1 to wmf.11. No change in save time graph.
  • 2016-01-28 21:16: All wikis to wmf.11. No change in save time graph.
  • 2016-01-30 23:20: All wikis back to wmf.10. If anything, the save time graph goes up slightly.
  • 2016-02-09 20:32: Group 0 to wmf.13. No change in save time graph.
  • 2016-02-10 15:00: Spike in save time graph. This bug starts, according to the description.
  • 2016-02-10 20:00: wmf.13 goes to group 1. Save time graph does seem to go up.
  • 2016-02-10 23:38: group 1 goes back to wmf.12. No change to the save time graph.
  • 2016-02-11 01:58: group 1 goes back to wmf.13. No change to the save time graph.
  • 2016-02-11 20:00: group 2 goes to wmf.13. No change to the save time graph, even though group 2 is most of our traffic.
  • 2016-02-12 05:50: Save time graph goes down for no apparent reason.
  • 2016-02-13 23:30: Save time graph goes down for no apparent reason.
  • 2016-02-14 09:00: Save time graph goes up for no apparent reason.
  • 2016-02-12 05:30: Save time graph goes down for no apparent reason. Then it slowly climbs back up over the next 11 hours.

Further, I took a look at the hits to centralauth-user and global:user during the time that wmf.11 was deployed to group 1, using your methodology in T126700#2033451. There's a similar increase in the hits to those keys during that time frame, but as I noted there was no increase in session save time during that period.

If there is any method to test performance impact short of deploying changes to (at least) group1 and watching the stats, I would love to hear it. I think everyone acknowledges that the SessionManager deployment was not well planned and some of the problems it caused / might have caused should have been caught before production, but I don't see how that would be true for performance.

Given how pervasive session handling is, I think it would be hard to fully rule it out as the culprit for pretty much anything; that just doesn't seem to me like an efficient way of tracking the regression down. I made some arguments in the previous comment why I don't think session handling a likely suspect; I would add that it had been deployed to group2 twice (2016-01-21 to 22 and 28 to 31 IIRC) and there aren't any obvious spikes. (And the Wed 15 UTC spike doesn't quite match the train schedule either.) Small bugfixes have been made since then and it's possible that one of those had a huge performance effect but again that seems like grasping for straws. Not sure if this counts as being proactive or being reactive :)

Again, my recommendation would be to look at where time is spent in the call tree. If that is CentralAuthUser::load() or some child call, then it makes sense to look for the change which caused an increase in that, which could easily be SessionManager. If that call doesn't take a lot of time (and I would be surprised to find otherwise - memcached calls are very fast and at most two central users are loaded per request), investigating it further just slows down the resolution of this task.

I filed T127233 and T127236 about unnecessary extra work caused by SessionManager but I'm pretty sure none of that is UBN territory.

It doesn't help your case that the timeline doesn't fit at all, @ori.

@Anomie, the timeline is very useful -- thanks. I'll annotate it with some additional events that occurred during that timeframe and then probably incorporate it into the task description.

In T126700#2034670, @Tgr wrote:

Whether responding to a certain request will require session handling is not in general predictable (cf T104755#2034145)

Side-track, but this seems very scary to me. It's important that all HTTP transactions for URL paths which are sensitive to sessions (meaning they can modify their output based on sessions) emit Vary:Cookie, and that those which are not sensitive to sessions do not emit Vary:Cookie. Keep in mind the general sanity constraint that a given unique host:urlpath should always send the same Vary header regardless of the request input (e.g. presence of a session cookie), too.

It's important that all HTTP transactions for URL paths which are sensitive to sessions (meaning they can modify their output based on sessions) emit Vary:Cookie, and that those which are not sensitive to sessions do not emit Vary:Cookie.

That's doable, although I think the current code (both pre- and post-SessionManager) errs toward emitting it any time it is remotely possible that the output could be session-dependent. That's not really predicting, though, just reporting after the fact.

Side-track, but this seems very scary to me.

On this front, we're probably better off with SessionManager than we were before.

In the pre-SessionManager code, $_SESSION was always initialized from the session cookie, and then extensions like OAuth or CentralAuth's centralauthtoken URL parameter would do crazy hacks in UserLoadFromSession to override $_SESSION as well as the user. With SessionManager the stuff those crazy UserLoadFromSession hacks did no longer requires crazy hacks that only happen to take effect if something unstubs $wgUser.

But SessionManager doesn't do anything to change whether any particular code path actually needs to Vary or not, nor whether any such code path actually does Vary or not.

Update: we are tentatively planning to deploy wmf.14 next week. wmf.14 was branched from master this past Tuesday (Feb 16th), so the diff with what is on prod right now is still only 1 week. Any other updates/opinions welcome.

In T126700#2047117, @greg wrote:

Update: we are tentatively planning to deploy wmf.14 next week. wmf.14 was branched from master this past Tuesday (Feb 16th), so the diff with what is on prod right now is still only 1 week.

Keeping the changeset small (limited to one week) seems sensible. However we'll have to catch up at some point, might as well do that right away I suppose.

In addition to having to catch up, I also worry about the stability of wmf.14. We're not currently in the practice of testing branches on beta before prod. As such, the state of wmf.14 is now one week stale, and has not been tested on beta, either. Production (wmf.13) and beta (master) are both fine in areas fixed over the last week; with little motivation for anyone to have backported things properly to wmf14 (and as such, probably haven't; and even if they have, it wasn't confirmed).

I propose we cut a fresh branch next Tuesday and go forward with that.

Is there an investigation plan for the regression that would be hampered by deploying two weeks' worth of changes but not by one week's? Short of that, I don't see the point of delaying wmf.15. A 0.5s increase in save times fully justifies delaying the train if we think that that will help with the matter significantly, but I do not see what is the reason in this case to think so.

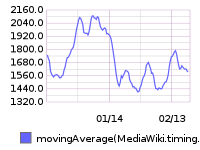
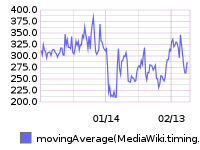
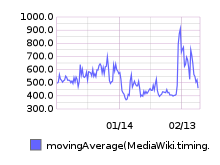
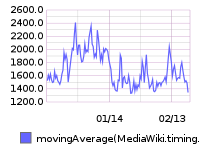
Also, looking at the p75 save timing graph it is now getting back to the same level it was pre 01-15 (but between 01-15 and 02-15 it was 150-200ms lower), and other percentiles never got worse than pre 01-15:
https://graphite.wikimedia.org/render/?width=925&height=556&from=00%3A00_20160101&until=now&target=movingAverage(MediaWiki.timing.editResponseTime.p75%2C100)
https://graphite.wikimedia.org/render/?width=925&height=556&from=00%3A00_20160101&until=now&target=movingAverage(MediaWiki.timing.editResponseTime.p50%2C100)
https://graphite.wikimedia.org/render/?width=925&height=556&from=00%3A00_20160101&until=now&target=movingAverage(MediaWiki.timing.editResponseTime.p95%2C100)
Do we know what caused the huge improvement on 01-15? Is it possible that it wasn't a code change (that was wmf.10 I think, the huge change after the fundraiser) but something transient that simply stopped happening a month later?

In T126700#2047117, @greg wrote:

Update: we are tentatively planning to deploy wmf.14 next week. wmf.14 was branched from master this past Tuesday (Feb 16th), so the diff with what is on prod right now is still only 1 week.

Keeping the changeset small (limited to one week) seems sensible. However we'll have to catch up at some point, might as well do that right away I suppose.

In addition to having to catch up, I also worry about the stability of wmf.14. We're not currently in the practice of testing branches on beta before prod. As such, the state of wmf.14 is now one week stale, and has not been tested on beta, either. Production (wmf.13) and beta (master) are both fine in areas fixed over the last week; with little motivation for anyone to have backported things properly to wmf14 (and as such, probably haven't; and even if they have, it wasn't confirmed).

I propose we cut a fresh branch next Tuesday and go forward with that.

I agree, I don't see the advantage for deploying last weeks code. No matter what you decide for, we plan to re-branch Wikibase on Monday or early Tuesday.

In T126700#2047487, @Tgr wrote:

Is there an investigation plan for the regression that would be hampered by deploying two weeks' worth of changes but not by one week's? Short of that, I don't see the point of delaying wmf.15. A 0.5s increase in save times fully justifies delaying the train if we think that that will help with the matter significantly, but I do not see what is the reason in this case to think so.

Also, looking at the p75 save timing graph it is now getting back to the same level it was pre 01-15 (but between 01-15 and 02-15 it was 150-200ms lower), and other percentiles never got worse than pre 01-15:
https://graphite.wikimedia.org/render/?width=925&height=556&from=00%3A00_20160101&until=now&target=movingAverage(MediaWiki.timing.editResponseTime.p75%2C100)
https://graphite.wikimedia.org/render/?width=925&height=556&from=00%3A00_20160101&until=now&target=movingAverage(MediaWiki.timing.editResponseTime.p50%2C100)
https://graphite.wikimedia.org/render/?width=925&height=556&from=00%3A00_20160101&until=now&target=movingAverage(MediaWiki.timing.editResponseTime.p95%2C100)
Do we know what caused the huge improvement on 01-15? Is it possible that it wasn't a code change (that was wmf.10 I think, the huge change after the fundraiser) but something transient that simply stopped happening a month later?

Embedded below. (Note, that moving average is a bit large. 100 data points was okay when those timestamps were more recent, but now that more time passed, it covers quite a lot due to aggregation). Included a shorter fixed duration as well.

@ori and all:

mc1001->mc1003 and mc1014->mc1018 (memcached hosts) would still need to be migrated to Debian for https://phabricator.wikimedia.org/T123711. My understanding is that this work would still need to wait a final resolution of this issue, but please let me know if you wish me to proceed one host at the time during the following days.

Luca

I'm not confident we can still isolate it, particularly as it seems to have mostly abated. It would be good if you could wait a day, though, so we can distinguish any significant change from the typical week-start / weekend seasonality.

It would be good if you could wait a day

Even a week, no real hurry, it was only to organize the work and set some ETA in my phab task :)

Further, I took a look at the hits to centralauth-user and global:user during the time that wmf.11 was deployed to group 1, using your methodology in T126700#2033451. There's a similar increase in the hits to those keys during that time frame, but as I noted there was no increase in session save time during that period.

@Anomie, @Tgr: it may not be the primary culprit, but it is definitely a culprit.

For the main page request for https://en.m.wikipedia.org/wiki/Paraprosdokian, the following auth-related keys are retrieved:

  • WANCache:t:enwiki:user-quicktouched:id:XXX (x1)
  • WANCache:v:centralauth-user-XXX (x33)
  • WANCache:v:global:user:id:enwiki:XXX (x16)
  • enwiki:CentralNotice:UserData:XXX (x1)

All in all, that's 51 round-trips to memcached. The cost of that is not nothing. The benchmarking script below indicates it is about 25ms. The total backend response time for the request was 112ms, so that is nearly a quarter of the time wasted on repeat lookups.

<?php
$mc = new Memcached;
$mc->addServer( '/var/run/nutcracker/nutcracker.sock', 0 );

$start = microtime( true );

// WANCache:t:enwiki:user-quicktouched:id:XXX (x1)
$mc->get( 'WANCache:t:enwiki:user-quicktouched:id:XXX' );

// WANCache:v:centralauth-user-XXX (x33)
for ( $n = 0; $n < 33; $n++ ) {
	$mc->get( 'WANCache:v:centralauth-user-XXX' );
}

// WANCache:v:global:user:id:enwiki:XXX (x16)
for ( $n = 0; $n < 16; $n++ ) {
	$mc->get( 'WANCache:v:global:user:id:enwiki:XXX' );
}

// enwiki:CentralNotice:UserData:XXX (x1)
$mc->get( 'enwiki:CentralNotice:UserData:XXX' );

$end = microtime( true );

printf( "%.2fms\n", 1000 * ( $end - $start ) );

(where XXX = redacted)

Brad, you have been seriously helpful in this task. Do you think you could take on the additional task of de-duplicating these lookups?

@Anomie, when I snoop Redis GETs I see something even more bizarre: each request results in three to four enwiki:MWSession:XXX GETs. One of the keys is a repeat from the previous request, whereas the other three to four are entirely novel.

Not disagreeing about the importance to fix that (Brad already has a patch for the CA lookup in T127236), but there is no reason the memcached delay would scale up with the total response time, right? So for page saves, this would still only explain 25ms out of the ~400ms change.

In T126700#2050716, @Tgr wrote:

Not disagreeing about the importance to fix that (Brad already has a patch for the CA lookup in T127236), but there is no reason the memcached delay would scale up with the total response time, right? So for page saves, this would still only explain 25ms out of the ~400ms change.

Yes, correct -- hence not primary culprit.

In T126700#2050715, @ori wrote:

@Anomie, when I snoop Redis GETs I see something even more bizarre: each request results in three to four enwiki:MWSession:XXX GETs. One of the keys is a repeat from the previous request, whereas the other three to four are entirely novel.

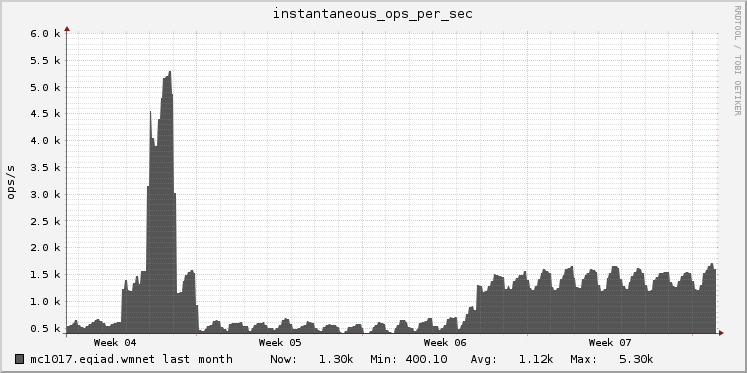
One reason I failed to notice this earlier is that the redis gmond plugin appears to be broken on Jessie. But on the memcached/redis boxes that have not yet been reimaged, you can see a substantial increase in ops/sec:

graph (1).png (373×747 px, 27 KB)

http://ganglia.wikimedia.org/latest/graph.php?r=month&z=xlarge&c=Memcached+eqiad&h=mc1017.eqiad.wmnet&jr=&js=&v=1464&m=instantaneous_ops_per_sec&vl=ops%2Fs&ti=instantaneous_ops_per_sec

so Redis ops are 2x to 3x what they were

In T126700#2050715, @ori wrote:

@Anomie, when I snoop Redis GETs I see something even more bizarre: each request results in three to four enwiki:MWSession:XXX GETs. One of the keys is a repeat from the previous request, whereas the other three to four are entirely novel.

Let's open a new task for this, rather than getting off-topic on this one. When you do open the new task, more information would be helpful, e.g. whether this is every request or only some requests.

One reason I failed to notice this earlier is that the redis gmond plugin appears to be broken on Jessie

@ori: it seems that Ganglia is not configured to monitor redis on Debian at all:

Ubuntu

elukey@mc1001:/etc/ganglia/conf.d$ ls
gmond_memcached.pyconf	memcached.pyconf  redis.pyconf

Debian

elukey@mc1007:/etc/ganglia/conf.d$ ls
gmond_memcached.pyconf

After a big of digging I found the following commit:

https://github.com/wikimedia/operations-puppet/commit/6c23f3b2848be376275ac4c7604a78334f3da296#diff-1619526e7c0925eaa47ff9e26b5bbe4d

How can we patch this issue to get metrics back? I am a bit ignorant about Redis and Ganglia so I'd need your guidance.

Thanks!

Luca

In T126700#2047117, @greg wrote:

Update: we are tentatively planning to deploy wmf.14 next week. wmf.14 was branched from master this past Tuesday (Feb 16th), so the diff with what is on prod right now is still only 1 week.

Keeping the changeset small (limited to one week) seems sensible. However we'll have to catch up at some point, might as well do that right away I suppose.

I commented on the wmf.14 blocker task to keep this task (mostly) less noisy: https://phabricator.wikimedia.org/T125597#2052051. tl;dr: last week's wmf.14 to be deployed this week with a new wmf.15 cut/deployed next week.

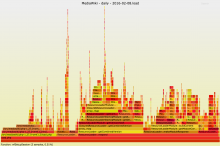
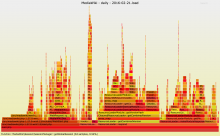
Just looking into load.php request and noticed a regression there as well.

1/4th of the backend time (or 170ms) is being spent in WebRequest::getSession() and underlying SessionManager code (140ms of that in CentralAuthSessionProvider::provideSessionInfo).

Aside from this previously not having being part of the call graph for load.php at all (presumably due to unconditional session creation), that still sounds like a lot. I suspect SessionManager+CentralAuth might be slower in general than the previous system, by a lot.

https://performance.wikimedia.org/xenon/svgs/daily/2016-02-08.load.svgz

Screen Shot 2016-02-22 at 18.21.24.png (1×2 px, 499 KB)

https://performance.wikimedia.org/xenon/svgs/daily/2016-02-21.load.svgz
Screen Shot 2016-02-22 at 18.21.36.png (1×2 px, 570 KB)

The big pillar on the left side wasn't there.

I can see the same in api.php as well, which I imagine might have major impact into the user-experience of say search suggestions in the Vector skin search bar.

https://performance.wikimedia.org/xenon/svgs/daily/2016-02-08.api.svgz

Screen Shot 2016-02-22 at 18.23.34.png (306×2 px, 125 KB)

https://performance.wikimedia.org/xenon/svgs/daily/2016-02-21.api.svgz
Screen Shot 2016-02-22 at 18.23.41.png (344×2 px, 179 KB)

In T126700#2050715, @ori wrote:

@Anomie, when I snoop Redis GETs I see something even more bizarre: each request results in three to four enwiki:MWSession:XXX GETs. One of the keys is a repeat from the previous request, whereas the other three to four are entirely novel.

Let's open a new task for this, rather than getting off-topic on this one. When you do open the new task, more information would be helpful, e.g. whether this is every request or only some requests.

@Anomie, filed as T127772: MWSession redis key retrieved 8-9 times per page request. It happens on every page request. I haven't tried with other entry-points.

1/4th of the backend time (or 170ms) is being spent in WebRequest::getSession() and underlying SessionManager code (140ms of that in CentralAuthSessionProvider::provideSessionInfo).

@bd808 and I looked into this, and it looks like that's mostly an artifact of the fact that initial setup of expensive cached objects happens to occur inside that call now instead of elsewhere. Drilling down on the most time-consuming items from https://performance.wikimedia.org/xhgui/run/symbol?id=56cb1be57ed6ccf97173fd71&symbol=WebRequest%3A%3AgetSession you quickly find yourself inside stuff like wfGetDB(), LocalisationCache, and MessageCache.

BTW, I note that link shows combined usage for two different calls to WebRequest::getSession. Is there a way in xhgui to drill down into those calls separately, instead of combining them both? In this particular case I happen to know that one call spends most of its time in MediaWiki\Session\SessionManager::getSessionForRequest and the other in MediaWiki\Session\SessionManager::getSessionById, but it starts to get complicated later.

Tests valid vs. valid with expired backend vs. no session on a few request types. action=raw with a session got significantly slower (60 ms for valid session, 160 for expired session) which makes sense (we didn't set up the session before), other than that changes are in the 20ms range (could be due to the extra redis checks), except opensearch with an expired session backend got considerably slower (which doesn't make much sense so might be a fluke).

Does not include any page save tests as ab cannot do that, I'll get back to that later.

Can't find the requests in xhgui, but I suppose there is a delay in stuff appearing there?

ori claimed this task.

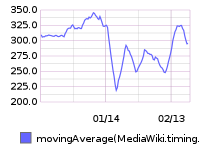
Closing, as p75 is now close to pre-wmf12 levels:

download (1).png (200×600 px, 18 KB)

We still don't have anything resembling a clear and convincing postmortem. We know that @Tgr and @Anomie's work to deduplicate memcached and redis key lookups (rMW9c733318107e: Cache user data in memory and rECAU961241fbdc91: Reduce memcache traffic for central session storage, which went out at 1:03 and 1:40 on 2016-03-01) resulted in a substantial improvement to page save latency, but the size of the effect of these two patches is surprising: they improved median page save latency by about 80ms, but it takes less than 80ms to retrieve the keys from memcached and redis at the rate we were seeing on page views (i.e., a dozen or so). Testing page saves in production is difficult, so it is entirely possible (likely, even) that the number of duplicate queries on the page save path was even more eggregious. But even if we accept that, we don't have a good explanations for the drops in page save latency on the 12th and 18th.

One of the biggest take-aways for me is that I really need to improve how I handle such issues in the future. I need to be a lot more methodical and to communicate better. I wrote down the following notes for myself:

  • Be disciplined about documenting all findings on Phabricator.
  • If you're testing some hypothesis A, and you encounter evidence pointing in the direction of a new hypothesis B, don't just abandon your investigation into hypothesis A. Rule it out definitively before moving on. Otherwise you'll end up cycling back to it, and you'll need to spend a lot of mental energy to get back to where you were before you dropped it.
  • Establish a timeline of major events early on, and be diligent about keeping it up-to-date.
  • Re-captiulate the definition of the key metrics you are tracking, to make sure you and everyone you are collaborating with is on the same page.
  • Recruit people to assist the investigation up front. Communicate expectations clearly.
  • Coordinate people who have volunteered to help by delegating tasks and gathering results.

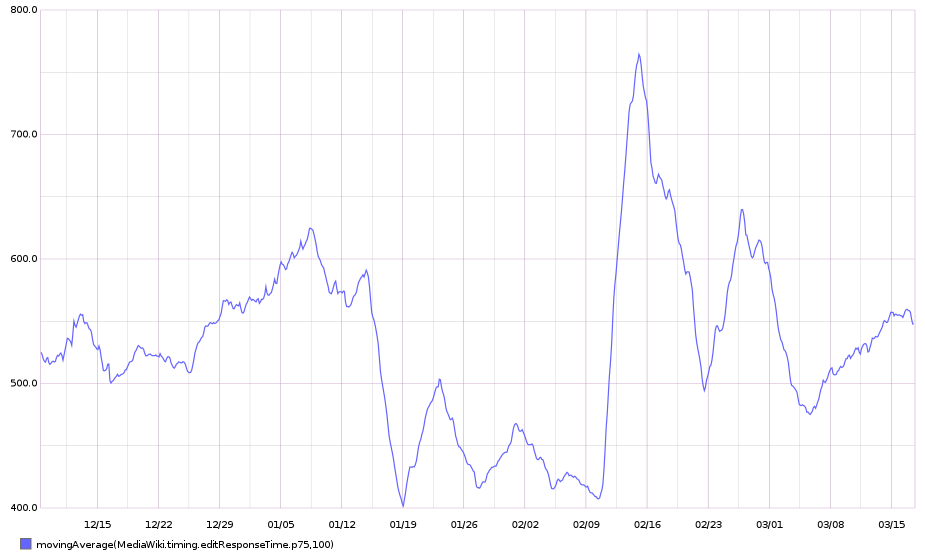
I have looked again auth the p75 edit response time but over 100 days. It was around 550 ms until January 14th when it dropped to a 400-500 ms range.

The spike to 700+ ms is what triggered this task to be filled. Subsequent work seems to have used for reference the January 14th - Feb ~9th of 450 ms as a reference when it was more like 550 ms before January 14th.

render-12.png (556×925 px, 37 KB)

Maybe we can dig in what happened on January 14th which improved the metric by ~100 ms?

From SAL:

00:27	<krenair@tin>	krenair@tin Synchronized wmf-config/throttle.php: https://gerrit.wikimedia.org/r/#/c/263905/ (duration: 00m 32s)
00:24	<krenair@tin>	krenair@tin Synchronized wmf-config/InitialiseSettings.php: touch (duration: 00m 31s)
00:22	<krenair@tin>	krenair@tin Synchronized wmf-config: https://gerrit.wikimedia.org/r/#/c/264091/ (duration: 00m 32s)
00:06	<mobrovac>	restbase started a dump of enwiki to populate storage with mobile apps renders
23:56	<mobrovac>	restbase end deploy of dac31a8c
23:49	<mobrovac>	restbase start deploy of dac31a8c
19:02	<dduvall@tin>	dduvall@tin rebuilt wikiversions.php and synchronized wikiversions files: all wikis to 1.27.0-wmf.10
18:40	<bblack>	removing old eqiad misc-web IP (DNS switched 50h ago (not 26 like above), TTLs are max 1h)
18:39	<bblack>	removing old eqiad misc-web IP (DNS switched 26h ago, TTLs are max 1h)
18:01	<paravoid>	turning up BGP with Zayo in eqiad
16:25	<demon@tin>	demon@tin Synchronized wmf-config/throttle.php: (no message) (duration: 00m 49s)

Not sure how turning up BGP with Zayo in eqiad at 18:00 could impact the edit saving time. But surely 1.27.0-wmf.10 on all wikis helped.