Day Return
YTD Return
1-Year Return
3-Year Return
5-Year Return
Note: Sector performance is calculated based on the previous closing price of all sector constituents
Industries in This Sector
Select an Industry for a Visual Breakdown
| Industry | Market Weight | YTD Return | |
|---|---|---|---|
| All Industries | 100.00% | 5.46% | |
| Aerospace & Defense | 19.29% | 26.41% | |
| Specialty Industrial Machinery | 14.77% | -10.88% | |
| Railroads | 8.33% | -2.67% | |
| Farm & Heavy Construction Machinery | 6.86% | 0.32% | |
| Building Products & Equipment | 6.37% | 13.47% | |
| Specialty Business Services | 5.44% | 9.83% | |
| Integrated Freight & Logistics | 4.56% | -9.59% | |
| Waste Management | 4.22% | 13.22% | |
| Conglomerates | 4.02% | -3.52% | |
| Engineering & Construction | 3.86% | 21.58% | |
| Industrial Distribution | 3.78% | 0.78% | |
| Staffing & Employment Services | 3.28% | -0.16% | |
| Rental & Leasing Services | 2.32% | -0.36% | |
| Consulting Services | 2.16% | 5.22% | |
| Electrical Equipment & Parts | 2.10% | 22.09% | |
| Trucking | 1.82% | -8.16% | |
| Airlines | 1.77% | 8.61% | |
| Tools & Accessories | 1.23% | -8.48% | |
| Security & Protection Services | 0.79% | 5.01% | |
| Marine Shipping | 0.79% | 58.14% | |
| Pollution & Treatment Controls | 0.76% | 15.72% | |
| Infrastructure Operations | 0.62% | 750.38% | |
| Metal Fabrication | 0.60% | 15.14% | |
| Airports & Air Services | 0.16% | -29.70% | |
| Business Equipment & Supplies | 0.10% | 2.12% | |
Note: Percentage % data on heatmap indicates Day Return
All Industries
--
<= -3
-2
-1
0
1
2
>= 3
Largest Companies in This Sector
|
Name
|
Last Price
|
1Y Target Est.
|
Market Weight
|
Market Cap
|
Day Change %
|
YTD Return
|
Avg. Analyst Rating
|
|---|---|---|---|---|---|---|---|
| 160.62 | 184.65 | 3.53% |
|
|
|
Buy
|
|
| 328.29 | 336.49 | 3.22% |
|
|
|
Hold
|
|
| 108.18 | 104.23 | 2.89% |
|
|
|
Hold
|
|
| 228.31 | 267.56 | 2.80% |
|
|
|
Buy
|
|
| 208.45 | 220.22 | 2.73% |
|
|
|
Buy
|
|
| 313.46 | 342.77 | 2.52% |
|
|
|
Buy
|
|
| 137.56 | 160.93 | 2.36% |
|
|
|
Buy
|
|
| 191.42 | 220.27 | 2.36% |
|
|
|
Buy
|
|
| 468.62 | 489.10 | 2.26% |
|
|
|
Hold
|
|
| 371.27 | 425.94 | 2.05% |
|
|
|
Buy
|
Investing in the Industrials Sector
Start Investing in the Industrials Sector Through These ETFs and Mutual Funds
ETF Opportunities
|
Name
|
Last Price
|
Net Assets
|
Expense Ratio
|
YTD Return
|
|---|---|---|---|---|
| 122.20 | 17.856B | 0.09% |
|
|
| 37.45 | 7.176B | 0.47% |
|
|
| 136.84 | 6.101B | 0.40% |
|
|
| 236.14 | 5.507B | 0.10% |
|
|
| 104.25 | 3.116B | 0.58% |
|
Mutual Fund Opportunities
|
Name
|
Last Price
|
Net Assets
|
Expense Ratio
|
YTD Return
|
|---|---|---|---|---|
| 121.27 | 5.507B | 0.10% |
|
|
| 17.94 | 1.593B | 0.68% |
|
|
| 38.16 | 572.417M | 0.69% |
|
|
| 106.53 | 571.808M | 0.70% |
|
|
| 48.57 | 538.102M | 0.76% |
|
Industrials Research
Discover the Latest Analyst and Technical Research for This Sector
-
Market Update: BMY, CMI, HUM, BBWI, LULU
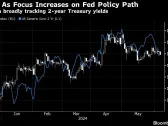
There's not much movement in U.S. stock markets today. Blue-chip shares are modestly higher, with the Nasdaq Composite and Russell 2000 off slightly. The yield on the 10-year Treasury note is steady at 4.45%. Gold, oil and Bitcoin are all trading higher today. The European Central Bank made the first move (ahead of the U.S. Federal Reserve) by cutting rates by 25 basis points to 3.75% -- its first cut in five years. In the U.S., economists and the Fed are still weighing the evidence to justify that kind of pivot. The data keeps coming but it is starting to lean more and more to making the case for a cut. Elsewhere, weekly unemployment claims increased 8,000 from the past week to 229,000, according to the U.S. Department of Labor. While that number is higher than the four-week average of 222,250, the jobs market remains healthy from this angle. We will start to worry about the strength of the consumer sector of the economy if claims soar toward 300,000.
-
Analyst Report: Cummins Inc.
Cummins designs, manufactures, and distributes diesel and natural gas engines and power distribution systems. The shares are a component of the S&P 500. The company has 61,600 employees.
RatingPrice Target -
Daily Spotlight: Argus's Favored Classes, Segments
May was positive for investors, as the S&P 500 climbed 5% and the fixed-income benchmark ETF AGG rose 1%. Looking ahead, our Stock-Bond Barometer model modestly favors bonds over stocks for long-term portfolios. In other words, these asset classes should be near their target weights in diversified portfolios, with a slight tilt toward fixed income, given the rise in yields to levels near 20-year highs. We are over-weight on large-caps, which we favor for growth exposure and financial strength, while small-caps offer value. Our recommended exposure to small- and mid-caps is 12%-13% of equity allocation, below the benchmark weighting. U.S. stocks have outperformed global stocks over the trailing five-year period. We expect this long-term trend favoring U.S. stocks to continue, given volatile and erratic global economic, political, geopolitical, and currency conditions. That said, international stocks offer favorable near-term valuations, and we target 5%-10% of equity exposure to the group. In terms of growth and value, growth has rebounded in 2023-24, outperforming value as interest rates have stabilized. Over the longer term, we anticipate that growth, led by the Information Technology and Healthcare sectors, will top returns from value, led by the Energy and Materials sectors, due to favorable secular, demographic, and regulatory trends.
-
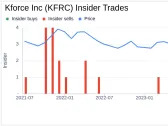
Daily – Vickers Top Buyers & Sellers for 06/06/2024
The Vickers Top Buyers & Sellers is a daily report that identifies the five companies the largest insider purchase transactions based on the dollar value of the transactions as well as the five companies the largest insider sales transactions based on the dollar value of the transactions.