Day Return
YTD Return
1-Year Return
3-Year Return
5-Year Return
Note: Sector performance is calculated based on the previous closing price of all sector constituents
Industries in This Sector
Select an Industry for a Visual Breakdown
| Industry | Market Weight | YTD Return | |
|---|---|---|---|
| All Industries | 100.00% | 1.51% | |
| Internet Retail | 33.14% | 18.66% | |
| Auto Manufacturers | 13.65% | -21.08% | |
| Restaurants | 8.81% | -3.23% | |
| Home Improvement Retail | 7.35% | -5.56% | |
| Travel Services | 5.25% | 5.36% | |
| Specialty Retail | 4.46% | -3.12% | |
| Apparel Retail | 4.12% | -5.13% | |
| Footwear & Accessories | 3.38% | -3.99% | |
| Residential Construction | 3.20% | -1.19% | |
| Auto Parts | 2.66% | -2.95% | |
| Packaging & Containers | 2.56% | 9.13% | |
| Lodging | 2.33% | 3.84% | |
| Auto & Truck Dealerships | 1.55% | 16.92% | |
| Resorts & Casinos | 1.52% | -11.36% | |
| Gambling | 1.38% | 87.74% | |
| Apparel Manufacturing | 0.96% | 2.17% | |
| Leisure | 0.94% | 10.01% | |
| Personal Services | 0.83% | 1.52% | |
| Furnishings, Fixtures & Appliances | 0.73% | -0.50% | |
| Recreational Vehicles | 0.50% | -14.22% | |
| Luxury Goods | 0.32% | -4.47% | |
| Department Stores | 0.31% | 6.24% | |
| Textile Manufacturing | 0.05% | -9.80% | |
Note: Percentage % data on heatmap indicates Day Return
All Industries
-
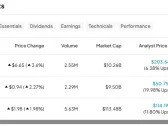
Largest Companies in This Sector
|
Name
|
Last Price
|
1Y Target Est.
|
Market Weight
|
Market Cap
|
Day Change %
|
YTD Return
|
Avg. Analyst Rating
|
|---|---|---|---|---|---|---|---|
| 180.75 | 209.71 | 31.54% |
|
|
|
Buy
|
|
| 179.29 | 165.52 | 9.59% |
|
|
|
Hold
|
|
| 325.10 | 380.52 | 5.41% |
|
|
|
Buy
|
|
| 258.11 | 290.60 | 3.12% |
|
|
|
Buy
|
|
| 91.75 | 100.72 | 2.32% |
|
|
|
Buy
|
|
| 3,795.35 | 3,743.58 | 2.16% |
|
|
|
Buy
|
|
| 215.21 | 252.06 | 2.06% |
|
|
|
Buy
|
|
| 102.14 | 114.65 | 1.94% |
|
|
|
Buy
|
|
| 144.47 | 152.41 | 1.54% |
|
|
|
Hold
|
|
| 78.87 | 82.29 | 1.50% |
|
|
|
Hold
|
Investing in the Consumer Cyclical Sector
Start Investing in the Consumer Cyclical Sector Through These ETFs and Mutual Funds
ETF Opportunities
|
Name
|
Last Price
|
Net Assets
|
Expense Ratio
|
YTD Return
|
|---|---|---|---|---|
| 175.54 | 19.098B | 0.09% |
|
|
| 303.29 | 5.953B | 0.10% |
|
|
| 104.81 | 2.653B | 0.40% |
|
|
| 60.30 | 1.445B | 0.61% |
|
|
| 78.68 | 1.369B | 0.08% |
|
Mutual Fund Opportunities
|
Name
|
Last Price
|
Net Assets
|
Expense Ratio
|
YTD Return
|
|---|---|---|---|---|
| 50.31 | 10.324B | 0.00% |
|
|
| 157.06 | 5.953B | 0.10% |
|
|
| 19.09 | 2.884B | 0.72% |
|
|
| 42.94 | 1.412B | 0.29% |
|
|
| 41.32 | 1.412B | 0.29% |
|
Consumer Cyclical Research
Discover the Latest Analyst and Technical Research for This Sector
-
Morningstar | A Weekly Summary of Stock Ideas and Developments in the Companies We Cover
In this edition, P&C insurers overvalued despite tailwind; prospects and caveats for P&C insurers; breaking down the Live Nation breakup sought by DOJ; and VF, Evotec SE ADR, and Stericycle.
-
Analyst Report: Gildan Activewear Inc.
Gildan is a vertically integrated designer and manufacturer of basic apparel, including T-shirts, underwear, socks, and hosiery. Its primary market is the sale of blank T-shirts, sweatshirts, and other apparel to wholesalers, major clothing brands, and printers (printwear). Gildan also sells branded clothing through retail and direct-to-consumer channels. Brands include Gildan, American Apparel, Comfort Colors, and Gold Toe. Gildan produces most of its clothing at factories in Latin America and recently began operating a new plant in Bangladesh. Incorporated in 1984, the Montreal-based company operates internationally but generates nearly 90% of its sales in the US.
RatingPrice Target -
Analyst Report: The TJX Companies, Inc.
TJX Companies is the leading off-price retailer of apparel, accessories, and home merchandise in the United States. The firm leverages its more than 21,000 global vendor relationships to procure and sell brand-name merchandise at prices 20%-60% cheaper than conventional retail channels. TJX opportunistically purchases excess inventory that stems from manufacturing overruns and retail closeout sales. The off-price retailer disperses its vast and disparate merchandise across its 4,950 global stores, creating a treasure-hunt shopping experience for consumers. Over three quarters of TJX’s sales are derived from the United States, primarily via the T.J. Maxx, Marshalls, and HomeGoods banners. About 10% of sales are from Canada and 12% from Europe and Australia.
RatingPrice Target -
Analyst Report: International Paper Company
International Paper manufactures packaging products and cellulose fibers. It accounts for roughly one third of the North American corrugated packaging market. Though it has operations in Brazil, India, and China, more than three fourths of its sales come from North America. International Paper serves a variety of end markets, including industrial, consumer products, and manufacturing.
RatingPrice Target