Controlled Release Fertilizers Market Size

| Icons | Lable | Value |
|---|---|---|
| Study Period | 2016 - 2030 | |
| Market Size (2024) | USD 1.28 Billion | |
| Market Size (2030) | USD 2.00 Billion | |
| Largest Share by Coating Type | Polymer Coated | |
| CAGR (2024 - 2030) | 7.72 % | |
| Largest Share by Region | North America | |
Major Players |
||
|
|
||
*Disclaimer: Major Players sorted in no particular order |
Controlled Release Fertilizers Market Analysis
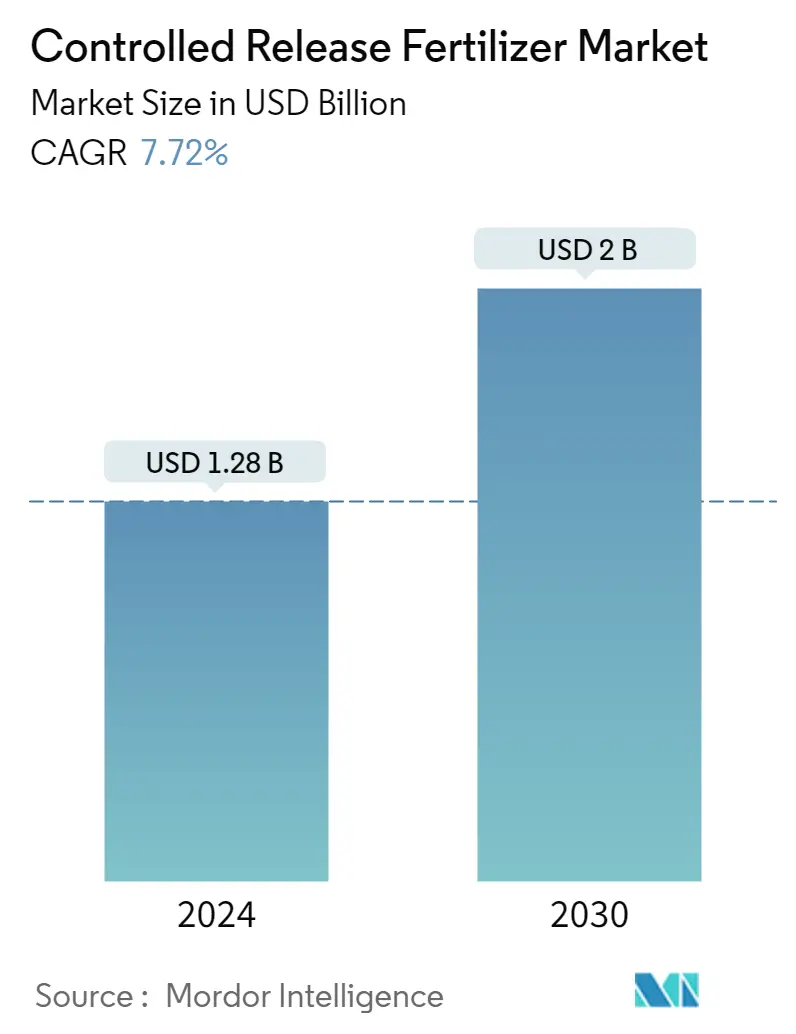
The Controlled Release Fertilizer Market size is estimated at USD 1.28 billion in 2024, and is expected to reach USD 2 billion by 2030, growing at a CAGR of 7.72% during the forecast period (2024-2030).
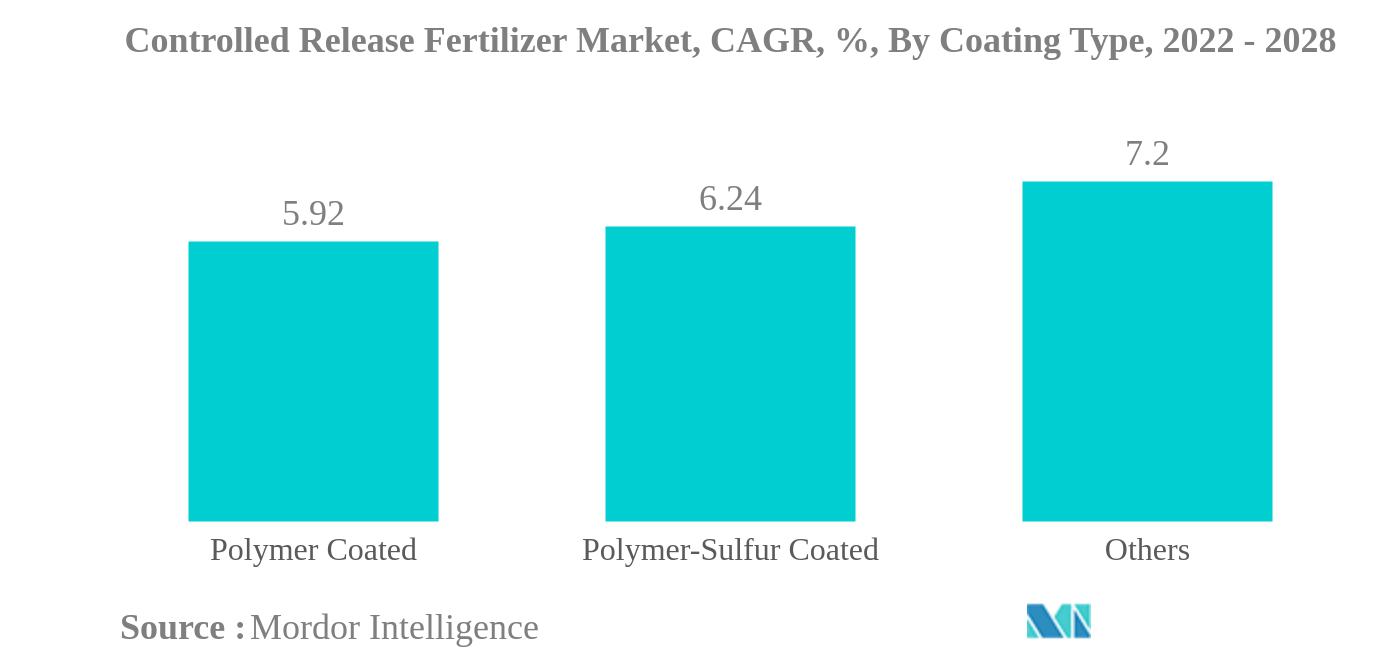
- Polymer Coated is the Largest Coating Type: The polymer coated fertilizers release the nutrients for longer duration and decrease the leaching losses of fertilizers in the soil and also reduce the application rate.
- Field Crops is the Largest Crop Type: Field crops are widely cultivated across the world & are staple food in many parts of the world. They account for maximum share by area in most of the Agricultural countries.
- United States is the Largest Country: The efficient nutrient release led to decreased leaching, and volatilization of the nutrients which are the major factors driving the coated CRF market in the country.
Controlled Release Fertilizers Market Trends
This section covers the major market trends shaping the Controlled Release Fertilizer Market according to our research experts:
Polymer Coated is the largest Coating Type
- Controlled-release fertilizers (CRFs) account for about 2.3% of the total global fertilizer market value, valued at about USD 3.8 billion in 2021. Field crops dominated the market and accounted for about 50.4% of the market value in 2021, majorly due to their large cultivation area around the world.
- Among CRFs, polymer-coated fertilizers dominated the market and accounted for about 62.6% of the market value, valued at about USD 2.38 billion in 2021. Polymer-coated CRF is an advanced type of CRF where the fertilizer granule is coated with polymers to allow the nutrients to escape from it gradually, leading to very less loss of nutrients.
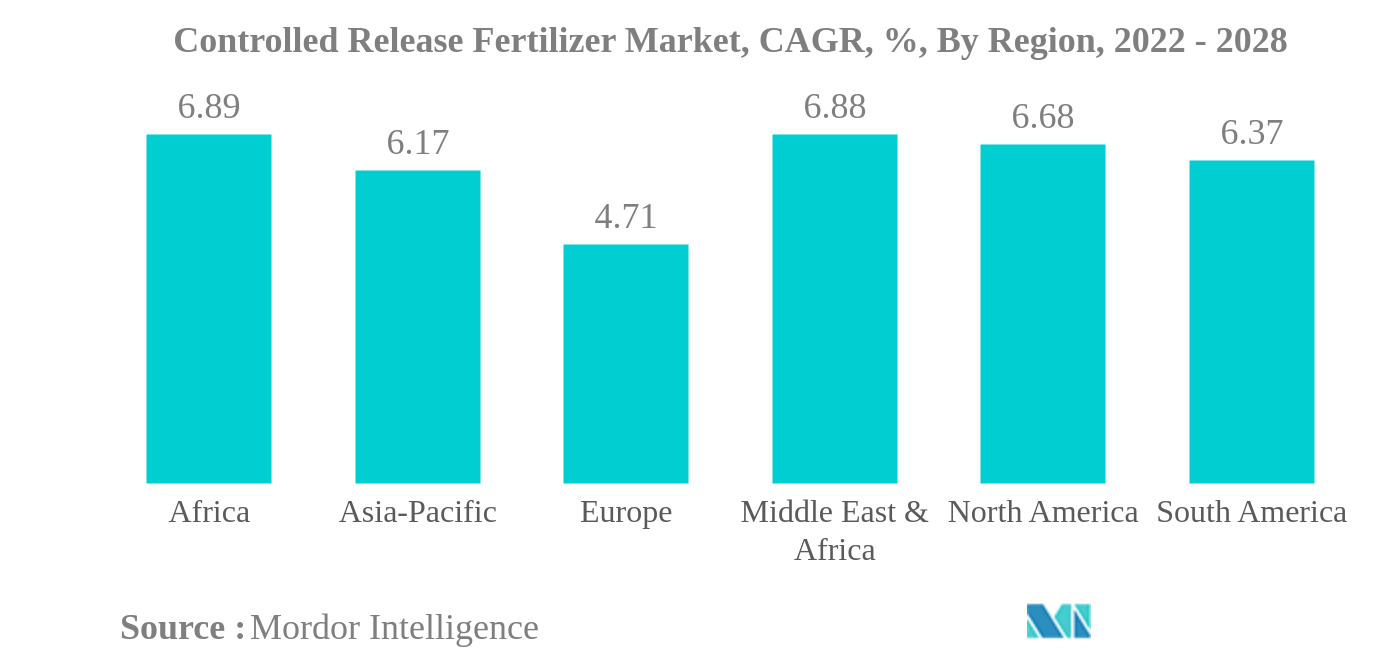
- The North American region dominated the global controlled-release fertilizer market and accounted for about 61.7% of the market value, valued at about USD 2.37 billion in 2021 due to the dominance of field crops in the region and concern over nitrate pollution in addition to advancement in the adaption of agricultural technologies. The region's market value is anticipated to increase by about 2.2% and reach USD 2.42 billion by the end of the forecast period.
- There is a steady increase in the global controlled-release fertilizer market in terms of volume. The fluctuations in the market value are due to fluctuations in fertilizer prices. The prices of controlled-release fertilizers mainly depend on the technology used by the manufacturers for coating the fertilizers.
- The global controlled-release fertilizer market is projected to grow during the forecast period owing to their higher efficiency and fewer nutrient losses leading to less environmental pollution. Increased awareness among the farmers and increased availability will also drive the market.
North America is the largest Region
- North America dominates the global controlled-release fertilizer market. In the region, the United States is the largest market for controlled-release fertilizers accounting for 63.0% of the market in 2021.
- Europe occupied the second largest market share in the global controlled-release fertilizer market. The controlled-release fertilizer market in Europe is observed to have notably stable growth across all countries in the region, with Ukraine occupying the largest share of 9.09 % in the market, followed by Spain for the year 2021.
- The Asia-Pacific region is the third largest market for controlled-release fertilizers in the world. China dominates the APAC controlled-release fertilizers market by accounting for about 11.2% of the market share in 2021. Polymer-coated fertilizers recorded the highest share in the controlled-release fertilizers market, followed by polymer sulfur-coated fertilizers. Polymer coated fertilizers segment was valued at USD 202.9 million in 2017 and is anticipated to reach USD 372.0 million by the end of the forecast period.
- Control-release urea is the most commonly used form of CRF in the world. Nitrogen loss is one of the main problems faced by rice farmers, and the efficiency of nitrogen utilization in rice is often inadequate. This is due to the large loss of nitrogen due to volatilization, leaching, and denitrification. One way to improve nitrogen efficiency is to use control-release urea. Controlled-release urea generally outperformed granular urea fertilizers in reducing nitrogen loss, stimulating plant growth, and increasing nitrogen concentration.
- The increased efficiency of controlled-release fertilizers will drive the market during the forecast period.
Controlled Release Fertilizers Industry Overview
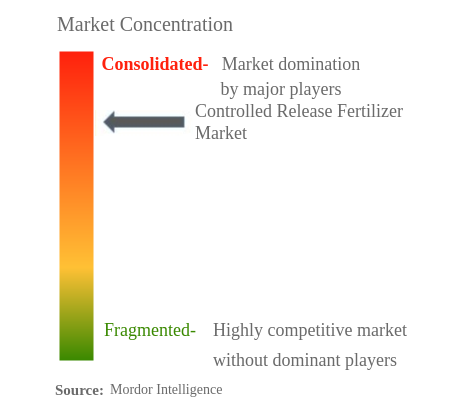
The Controlled Release Fertilizer Market is fairly consolidated, with the top five companies occupying 67.34%. The major players in this market are Compo Expert GMbh, Florikan, ICL Speciality Fertilizers, Nutrien Ltd. and Sociedad Quimica y Minera de Chile SA (sorted alphabetically).
Controlled Release Fertilizers Market Leaders
Compo Expert GMbh
Florikan
ICL Speciality Fertilizers
Nutrien Ltd.
Sociedad Quimica y Minera de Chile SA
*Disclaimer: Major Players sorted in no particular order
Controlled Release Fertilizers Market News
- May 2022: ICL signed Framework agreements with customers in India and china to supply 600,000 and 700,000 metric tons of potash, respectively in 2022 at 590 USD per ton.
- February 2022: ICL's introduced lawn care fertilizers containing either urea coated with sulfur and a biodegradable polymer membrane (Poly-S) or resin-coated nitrogen combined with phosphorus and potash (PACE). This avoids uncontrolled shock growth, which means less mowing effort. The fertilizers are considered to be particularly easy and safe to use and are suitable for robotic lawnmowers.
- September 2021: Florikan announced major expansion of staging and temporary storage. These additions will help Florikan manage the growing demand for its premium lines of controlled-release fertilizer products which include, Nutricote®, Gal-XeONE™, and YLD™.
Controlled Release Fertilizers Market Report - Table of Contents
EXECUTIVE SUMMARY & KEY FINDINGS
REPORT OFFERS
1. INTRODUCTION
1.1. Study Assumptions & Market Definition
1.2. Scope of the Study
1.3. Research Methodology
2. KEY INDUSTRY TRENDS
2.1. Acreage Of Major Crop Types
2.2. Average Nutrient Application Rates
2.3. Regulatory Framework
2.4. Value Chain & Distribution Channel Analysis
3. MARKET SEGMENTATION
3.1. Coating Type
3.1.1. Polymer Coated
3.1.2. Polymer-Sulfur Coated
3.1.3. Others
3.2. Crop Type
3.2.1. Field Crops
3.2.2. Horticultural Crops
3.2.3. Turf & Ornamental
3.3. Region
3.3.1. Asia-Pacific
3.3.1.1. Australia
3.3.1.2. Bangladesh
3.3.1.3. China
3.3.1.4. India
3.3.1.5. Indonesia
3.3.1.6. Japan
3.3.1.7. Pakistan
3.3.1.8. Philippines
3.3.1.9. Thailand
3.3.1.10. Vietnam
3.3.1.11. Rest of Asia-Pacific
3.3.2. Europe
3.3.2.1. France
3.3.2.2. Germany
3.3.2.3. Italy
3.3.2.4. Netherlands
3.3.2.5. Russia
3.3.2.6. Spain
3.3.2.7. Ukraine
3.3.2.8. United Kingdom
3.3.2.9. Rest of Europe
3.3.3. Middle East & Africa
3.3.3.1. Nigeria
3.3.3.2. Saudi Arabia
3.3.3.3. South Africa
3.3.3.4. Turkey
3.3.3.5. Rest of Middle East & Africa
3.3.4. North America
3.3.4.1. Canada
3.3.4.2. Mexico
3.3.4.3. United States
3.3.4.4. Rest of North America
3.3.5. South America
3.3.5.1. Argentina
3.3.5.2. Brazil
3.3.5.3. Rest of South America
4. COMPETITIVE LANDSCAPE
4.1. Key Strategic Moves
4.2. Market Share Analysis
4.3. Company Landscape
4.4. Company Profiles
4.4.1. Compo Expert GMbh
4.4.2. Ekompany International BV (DeltaChem)
4.4.3. Florikan
4.4.4. Haifa Group Ltd
4.4.5. ICL Speciality Fertilizers
4.4.6. Kingenta Ecological Engineering Group Co., Ltd.
4.4.7. Mivena BV
4.4.8. Nutrien Ltd.
4.4.9. Sociedad Quimica y Minera de Chile SA
5. KEY STRATEGIC QUESTIONS FOR FERTILIZER CEOS
6. APPENDIX
6.1. Global Overview
6.1.1. Overview
6.1.2. Porter's Five Forces Framework
6.1.3. Global Value Chain Analysis
6.1.4. Market Dynamics (DROs)
6.2. Sources & References
6.3. List of Tables & Figures
6.4. Primary Insights
6.5. Data Pack
6.6. Glossary of Terms
List of Tables & Figures
- Figure 1:
- GLOBAL MARKET, AREA YOY GROWTH RATE, 2016 - 2021
- Figure 2:
- GLOBAL MARKET, AREA YOY GROWTH RATE, 2016 - 2021
- Figure 3:
- , AVERAGE NUTRIENT APPLICATION RATES, BY KG/HECTARE, 2021
- Figure 4:
- , AVERAGE NUTRIENT APPLICATION RATES, BY KG/HECTARE, 2021
- Figure 5:
- , AVERAGE NUTRIENT APPLICATION RATES, BY KG/HECTARE, 2021
- Figure 6:
- , AVERAGE NUTRIENT APPLICATION RATES, BY KG/HECTARE, 2021
- Figure 7:
- , AVERAGE NUTRIENT APPLICATION RATES, BY KG/HECTARE, 2021
- Figure 8:
- , AVERAGE NUTRIENT APPLICATION RATES, BY KG/HECTARE, 2021
- Figure 9:
- GLOBAL CONTROLLED RELEASE FERTILIZER MARKET, VOLUME, METRIC TON, 2016 - 2028
- Figure 10:
- GLOBAL CONTROLLED RELEASE FERTILIZER MARKET, VALUE, USD, 2016 - 2028
- Figure 11:
- GLOBAL CONTROLLED RELEASE FERTILIZER MARKET, BY COATING TYPE, VOLUME, METRIC TON, 2016 - 2028
- Figure 12:
- GLOBAL CONTROLLED RELEASE FERTILIZER MARKET, BY COATING TYPE, VALUE, USD, 2016 - 2028
- Figure 13:
- GLOBAL CONTROLLED RELEASE FERTILIZER MARKET, VOLUME SHARE(%), BY COATING TYPE, 2016 - 2028
- Figure 14:
- GLOBAL CONTROLLED RELEASE FERTILIZER MARKET, VALUE SHARE(%), BY COATING TYPE, 2016 - 2028
- Figure 15:
- GLOBAL CONTROLLED RELEASE FERTILIZER MARKET, BY COATING TYPE, POLYMER COATED, METRIC TON, 2016 - 2028
- Figure 16:
- GLOBAL CONTROLLED RELEASE FERTILIZER MARKET, BY COATING TYPE, POLYMER COATED, USD, 2016 - 2028
- Figure 17:
- GLOBAL CONTROLLED RELEASE FERTILIZER MARKET, VALUE SHARE(%), BY CROP TYPE, 2021 - 2028
- Figure 18:
- GLOBAL CONTROLLED RELEASE FERTILIZER MARKET, BY COATING TYPE, POLYMER-SULFUR COATED, METRIC TON, 2016 - 2028
- Figure 19:
- GLOBAL CONTROLLED RELEASE FERTILIZER MARKET, BY COATING TYPE, POLYMER-SULFUR COATED, USD, 2016 - 2028
- Figure 20:
- GLOBAL CONTROLLED RELEASE FERTILIZER MARKET, VALUE SHARE(%), BY CROP TYPE, 2021 - 2028
- Figure 21:
- GLOBAL CONTROLLED RELEASE FERTILIZER MARKET, BY COATING TYPE, OTHERS, METRIC TON, 2016 - 2028
- Figure 22:
- GLOBAL CONTROLLED RELEASE FERTILIZER MARKET, BY COATING TYPE, OTHERS, USD, 2016 - 2028
- Figure 23:
- GLOBAL CONTROLLED RELEASE FERTILIZER MARKET, VALUE SHARE(%), BY CROP TYPE, 2021 - 2028
- Figure 24:
- GLOBAL CONTROLLED RELEASE FERTILIZER MARKET, BY CROP TYPE, VOLUME, METRIC TON, 2016 - 2028
- Figure 25:
- GLOBAL CONTROLLED RELEASE FERTILIZER MARKET, BY CROP TYPE, VALUE, USD, 2016 - 2028
- Figure 26:
- GLOBAL CONTROLLED RELEASE FERTILIZER MARKET, VOLUME SHARE(%), BY CROP TYPE, 2016 - 2028
- Figure 27:
- GLOBAL CONTROLLED RELEASE FERTILIZER MARKET, VALUE SHARE(%), BY CROP TYPE, 2016 - 2028
- Figure 28:
- GLOBAL CONTROLLED RELEASE FERTILIZER MARKET, BY CROP TYPE, FIELD CROPS, METRIC TON, 2016 - 2028
- Figure 29:
- GLOBAL CONTROLLED RELEASE FERTILIZER MARKET, BY CROP TYPE, FIELD CROPS, USD, 2016 - 2028
- Figure 30:
- GLOBAL CONTROLLED RELEASE FERTILIZER MARKET, VALUE SHARE(%), BY COATING TYPE, 2021 - 2028
- Figure 31:
- GLOBAL CONTROLLED RELEASE FERTILIZER MARKET, BY CROP TYPE, HORTICULTURAL CROPS, METRIC TON, 2016 - 2028
- Figure 32:
- GLOBAL CONTROLLED RELEASE FERTILIZER MARKET, BY CROP TYPE, HORTICULTURAL CROPS, USD, 2016 - 2028
- Figure 33:
- GLOBAL CONTROLLED RELEASE FERTILIZER MARKET, VALUE SHARE(%), BY COATING TYPE, 2021 - 2028
- Figure 34:
- GLOBAL CONTROLLED RELEASE FERTILIZER MARKET, BY CROP TYPE, TURF & ORNAMENTAL, METRIC TON, 2016 - 2028
- Figure 35:
- GLOBAL CONTROLLED RELEASE FERTILIZER MARKET, BY CROP TYPE, TURF & ORNAMENTAL, USD, 2016 - 2028
- Figure 36:
- GLOBAL CONTROLLED RELEASE FERTILIZER MARKET, VALUE SHARE(%), BY COATING TYPE, 2021 - 2028
- Figure 37:
- GLOBAL CONTROLLED RELEASE FERTILIZER MARKET, BY REGION, VOLUME, METRIC TON, 2016 - 2028
- Figure 38:
- GLOBAL CONTROLLED RELEASE FERTILIZER MARKET, BY REGION, VALUE, USD, 2016 - 2028
- Figure 39:
- GLOBAL CONTROLLED RELEASE FERTILIZER MARKET, VOLUME SHARE(%), BY REGION, 2016 - 2028
- Figure 40:
- GLOBAL CONTROLLED RELEASE FERTILIZER MARKET, VALUE SHARE(%), BY REGION, 2016 - 2028
- Figure 41:
- GLOBAL CONTROLLED RELEASE FERTILIZER MARKET, BY COUNTRY, VOLUME, METRIC TON, 2016 - 2028
- Figure 42:
- GLOBAL CONTROLLED RELEASE FERTILIZER MARKET, BY COUNTRY, VALUE, USD, 2016 - 2028
- Figure 43:
- GLOBAL CONTROLLED RELEASE FERTILIZER MARKET, VOLUME SHARE(%), BY COUNTRY, 2016 - 2028
- Figure 44:
- GLOBAL CONTROLLED RELEASE FERTILIZER MARKET, VALUE SHARE(%), BY COUNTRY, 2016 - 2028
- Figure 45:
- GLOBAL CONTROLLED RELEASE FERTILIZER MARKET, BY COUNTRY, AUSTRALIA, METRIC TON, 2016 - 2028
- Figure 46:
- GLOBAL CONTROLLED RELEASE FERTILIZER MARKET, BY COUNTRY, AUSTRALIA, USD, 2016 - 2028
- Figure 47:
- GLOBAL CONTROLLED RELEASE FERTILIZER MARKET, VALUE SHARE(%), BY CROP TYPE, 2021 - 2028
- Figure 48:
- GLOBAL CONTROLLED RELEASE FERTILIZER MARKET, BY COUNTRY, BANGLADESH, METRIC TON, 2016 - 2028
- Figure 49:
- GLOBAL CONTROLLED RELEASE FERTILIZER MARKET, BY COUNTRY, BANGLADESH, USD, 2016 - 2028
- Figure 50:
- GLOBAL CONTROLLED RELEASE FERTILIZER MARKET, VALUE SHARE(%), BY CROP TYPE, 2021 - 2028
- Figure 51:
- GLOBAL CONTROLLED RELEASE FERTILIZER MARKET, BY COUNTRY, CHINA, METRIC TON, 2016 - 2028
- Figure 52:
- GLOBAL CONTROLLED RELEASE FERTILIZER MARKET, BY COUNTRY, CHINA, USD, 2016 - 2028
- Figure 53:
- GLOBAL CONTROLLED RELEASE FERTILIZER MARKET, VALUE SHARE(%), BY CROP TYPE, 2021 - 2028
- Figure 54:
- GLOBAL CONTROLLED RELEASE FERTILIZER MARKET, BY COUNTRY, INDIA, METRIC TON, 2016 - 2028
- Figure 55:
- GLOBAL CONTROLLED RELEASE FERTILIZER MARKET, BY COUNTRY, INDIA, USD, 2016 - 2028
- Figure 56:
- GLOBAL CONTROLLED RELEASE FERTILIZER MARKET, VALUE SHARE(%), BY CROP TYPE, 2021 - 2028
- Figure 57:
- GLOBAL CONTROLLED RELEASE FERTILIZER MARKET, BY COUNTRY, INDONESIA, METRIC TON, 2016 - 2028
- Figure 58:
- GLOBAL CONTROLLED RELEASE FERTILIZER MARKET, BY COUNTRY, INDONESIA, USD, 2016 - 2028
- Figure 59:
- GLOBAL CONTROLLED RELEASE FERTILIZER MARKET, VALUE SHARE(%), BY CROP TYPE, 2021 - 2028
- Figure 60:
- GLOBAL CONTROLLED RELEASE FERTILIZER MARKET, BY COUNTRY, JAPAN, METRIC TON, 2016 - 2028
- Figure 61:
- GLOBAL CONTROLLED RELEASE FERTILIZER MARKET, BY COUNTRY, JAPAN, USD, 2016 - 2028
- Figure 62:
- GLOBAL CONTROLLED RELEASE FERTILIZER MARKET, VALUE SHARE(%), BY CROP TYPE, 2021 - 2028
- Figure 63:
- GLOBAL CONTROLLED RELEASE FERTILIZER MARKET, BY COUNTRY, PAKISTAN, METRIC TON, 2016 - 2028
- Figure 64:
- GLOBAL CONTROLLED RELEASE FERTILIZER MARKET, BY COUNTRY, PAKISTAN, USD, 2016 - 2028
- Figure 65:
- GLOBAL CONTROLLED RELEASE FERTILIZER MARKET, VALUE SHARE(%), BY CROP TYPE, 2021 - 2028
- Figure 66:
- GLOBAL CONTROLLED RELEASE FERTILIZER MARKET, BY COUNTRY, PHILIPPINES, METRIC TON, 2016 - 2028
- Figure 67:
- GLOBAL CONTROLLED RELEASE FERTILIZER MARKET, BY COUNTRY, PHILIPPINES, USD, 2016 - 2028
- Figure 68:
- GLOBAL CONTROLLED RELEASE FERTILIZER MARKET, VALUE SHARE(%), BY CROP TYPE, 2021 - 2028
- Figure 69:
- GLOBAL CONTROLLED RELEASE FERTILIZER MARKET, BY COUNTRY, THAILAND, METRIC TON, 2016 - 2028
- Figure 70:
- GLOBAL CONTROLLED RELEASE FERTILIZER MARKET, BY COUNTRY, THAILAND, USD, 2016 - 2028
- Figure 71:
- GLOBAL CONTROLLED RELEASE FERTILIZER MARKET, VALUE SHARE(%), BY CROP TYPE, 2021 - 2028
- Figure 72:
- GLOBAL CONTROLLED RELEASE FERTILIZER MARKET, BY COUNTRY, VIETNAM, METRIC TON, 2016 - 2028
- Figure 73:
- GLOBAL CONTROLLED RELEASE FERTILIZER MARKET, BY COUNTRY, VIETNAM, USD, 2016 - 2028
- Figure 74:
- GLOBAL CONTROLLED RELEASE FERTILIZER MARKET, VALUE SHARE(%), BY CROP TYPE, 2021 - 2028
- Figure 75:
- GLOBAL CONTROLLED RELEASE FERTILIZER MARKET, BY COUNTRY, REST OF ASIA-PACIFIC, METRIC TON, 2016 - 2028
- Figure 76:
- GLOBAL CONTROLLED RELEASE FERTILIZER MARKET, BY COUNTRY, REST OF ASIA-PACIFIC, USD, 2016 - 2028
- Figure 77:
- GLOBAL CONTROLLED RELEASE FERTILIZER MARKET, VALUE SHARE(%), BY CROP TYPE, 2021 - 2028
- Figure 78:
- GLOBAL CONTROLLED RELEASE FERTILIZER MARKET, BY COUNTRY, VOLUME, METRIC TON, 2016 - 2028
- Figure 79:
- GLOBAL CONTROLLED RELEASE FERTILIZER MARKET, BY COUNTRY, VALUE, USD, 2016 - 2028
- Figure 80:
- GLOBAL CONTROLLED RELEASE FERTILIZER MARKET, VOLUME SHARE(%), BY COUNTRY, 2016 - 2028
- Figure 81:
- GLOBAL CONTROLLED RELEASE FERTILIZER MARKET, VALUE SHARE(%), BY COUNTRY, 2016 - 2028
- Figure 82:
- GLOBAL CONTROLLED RELEASE FERTILIZER MARKET, BY COUNTRY, FRANCE, METRIC TON, 2016 - 2028
- Figure 83:
- GLOBAL CONTROLLED RELEASE FERTILIZER MARKET, BY COUNTRY, FRANCE, USD, 2016 - 2028
- Figure 84:
- GLOBAL CONTROLLED RELEASE FERTILIZER MARKET, VALUE SHARE(%), BY CROP TYPE, 2021 - 2028
- Figure 85:
- GLOBAL CONTROLLED RELEASE FERTILIZER MARKET, BY COUNTRY, GERMANY, METRIC TON, 2016 - 2028
- Figure 86:
- GLOBAL CONTROLLED RELEASE FERTILIZER MARKET, BY COUNTRY, GERMANY, USD, 2016 - 2028
- Figure 87:
- GLOBAL CONTROLLED RELEASE FERTILIZER MARKET, VALUE SHARE(%), BY CROP TYPE, 2021 - 2028
- Figure 88:
- GLOBAL CONTROLLED RELEASE FERTILIZER MARKET, BY COUNTRY, ITALY, METRIC TON, 2016 - 2028
- Figure 89:
- GLOBAL CONTROLLED RELEASE FERTILIZER MARKET, BY COUNTRY, ITALY, USD, 2016 - 2028
- Figure 90:
- GLOBAL CONTROLLED RELEASE FERTILIZER MARKET, VALUE SHARE(%), BY CROP TYPE, 2021 - 2028
- Figure 91:
- GLOBAL CONTROLLED RELEASE FERTILIZER MARKET, BY COUNTRY, NETHERLANDS, METRIC TON, 2016 - 2028
- Figure 92:
- GLOBAL CONTROLLED RELEASE FERTILIZER MARKET, BY COUNTRY, NETHERLANDS, USD, 2016 - 2028
- Figure 93:
- GLOBAL CONTROLLED RELEASE FERTILIZER MARKET, VALUE SHARE(%), BY CROP TYPE, 2021 - 2028
- Figure 94:
- GLOBAL CONTROLLED RELEASE FERTILIZER MARKET, BY COUNTRY, RUSSIA, METRIC TON, 2016 - 2028
- Figure 95:
- GLOBAL CONTROLLED RELEASE FERTILIZER MARKET, BY COUNTRY, RUSSIA, USD, 2016 - 2028
- Figure 96:
- GLOBAL CONTROLLED RELEASE FERTILIZER MARKET, VALUE SHARE(%), BY CROP TYPE, 2021 - 2028
- Figure 97:
- GLOBAL CONTROLLED RELEASE FERTILIZER MARKET, BY COUNTRY, SPAIN, METRIC TON, 2016 - 2028
- Figure 98:
- GLOBAL CONTROLLED RELEASE FERTILIZER MARKET, BY COUNTRY, SPAIN, USD, 2016 - 2028
- Figure 99:
- GLOBAL CONTROLLED RELEASE FERTILIZER MARKET, VALUE SHARE(%), BY CROP TYPE, 2021 - 2028
- Figure 100:
- GLOBAL CONTROLLED RELEASE FERTILIZER MARKET, BY COUNTRY, UKRAINE, METRIC TON, 2016 - 2028
- Figure 101:
- GLOBAL CONTROLLED RELEASE FERTILIZER MARKET, BY COUNTRY, UKRAINE, USD, 2016 - 2028
- Figure 102:
- GLOBAL CONTROLLED RELEASE FERTILIZER MARKET, VALUE SHARE(%), BY CROP TYPE, 2021 - 2028
- Figure 103:
- GLOBAL CONTROLLED RELEASE FERTILIZER MARKET, BY COUNTRY, UNITED KINGDOM, METRIC TON, 2016 - 2028
- Figure 104:
- GLOBAL CONTROLLED RELEASE FERTILIZER MARKET, BY COUNTRY, UNITED KINGDOM, USD, 2016 - 2028
- Figure 105:
- GLOBAL CONTROLLED RELEASE FERTILIZER MARKET, VALUE SHARE(%), BY CROP TYPE, 2021 - 2028
- Figure 106:
- GLOBAL CONTROLLED RELEASE FERTILIZER MARKET, BY COUNTRY, REST OF EUROPE, METRIC TON, 2016 - 2028
- Figure 107:
- GLOBAL CONTROLLED RELEASE FERTILIZER MARKET, BY COUNTRY, REST OF EUROPE, USD, 2016 - 2028
- Figure 108:
- GLOBAL CONTROLLED RELEASE FERTILIZER MARKET, VALUE SHARE(%), BY CROP TYPE, 2021 - 2028
- Figure 109:
- GLOBAL CONTROLLED RELEASE FERTILIZER MARKET, BY COUNTRY, VOLUME, METRIC TON, 2016 - 2028
- Figure 110:
- GLOBAL CONTROLLED RELEASE FERTILIZER MARKET, BY COUNTRY, VALUE, USD, 2016 - 2028
- Figure 111:
- GLOBAL CONTROLLED RELEASE FERTILIZER MARKET, VOLUME SHARE(%), BY COUNTRY, 2016 - 2028
- Figure 112:
- GLOBAL CONTROLLED RELEASE FERTILIZER MARKET, VALUE SHARE(%), BY COUNTRY, 2016 - 2028
- Figure 113:
- GLOBAL CONTROLLED RELEASE FERTILIZER MARKET, BY COUNTRY, NIGERIA, METRIC TON, 2016 - 2028
- Figure 114:
- GLOBAL CONTROLLED RELEASE FERTILIZER MARKET, BY COUNTRY, NIGERIA, USD, 2016 - 2028
- Figure 115:
- GLOBAL CONTROLLED RELEASE FERTILIZER MARKET, VALUE SHARE(%), BY CROP TYPE, 2021 - 2028
- Figure 116:
- GLOBAL CONTROLLED RELEASE FERTILIZER MARKET, BY COUNTRY, SAUDI ARABIA, METRIC TON, 2016 - 2028
- Figure 117:
- GLOBAL CONTROLLED RELEASE FERTILIZER MARKET, BY COUNTRY, SAUDI ARABIA, USD, 2016 - 2028
- Figure 118:
- GLOBAL CONTROLLED RELEASE FERTILIZER MARKET, VALUE SHARE(%), BY CROP TYPE, 2021 - 2028
- Figure 119:
- GLOBAL CONTROLLED RELEASE FERTILIZER MARKET, BY COUNTRY, SOUTH AFRICA, METRIC TON, 2016 - 2028
- Figure 120:
- GLOBAL CONTROLLED RELEASE FERTILIZER MARKET, BY COUNTRY, SOUTH AFRICA, USD, 2016 - 2028
- Figure 121:
- GLOBAL CONTROLLED RELEASE FERTILIZER MARKET, VALUE SHARE(%), BY CROP TYPE, 2021 - 2028
- Figure 122:
- GLOBAL CONTROLLED RELEASE FERTILIZER MARKET, BY COUNTRY, TURKEY, METRIC TON, 2016 - 2028
- Figure 123:
- GLOBAL CONTROLLED RELEASE FERTILIZER MARKET, BY COUNTRY, TURKEY, USD, 2016 - 2028
- Figure 124:
- GLOBAL CONTROLLED RELEASE FERTILIZER MARKET, VALUE SHARE(%), BY CROP TYPE, 2021 - 2028
- Figure 125:
- GLOBAL CONTROLLED RELEASE FERTILIZER MARKET, BY COUNTRY, REST OF MIDDLE EAST & AFRICA, METRIC TON, 2016 - 2028
- Figure 126:
- GLOBAL CONTROLLED RELEASE FERTILIZER MARKET, BY COUNTRY, REST OF MIDDLE EAST & AFRICA, USD, 2016 - 2028
- Figure 127:
- GLOBAL CONTROLLED RELEASE FERTILIZER MARKET, VALUE SHARE(%), BY CROP TYPE, 2021 - 2028
- Figure 128:
- GLOBAL CONTROLLED RELEASE FERTILIZER MARKET, BY COUNTRY, VOLUME, METRIC TON, 2016 - 2028
- Figure 129:
- GLOBAL CONTROLLED RELEASE FERTILIZER MARKET, BY COUNTRY, VALUE, USD, 2016 - 2028
- Figure 130:
- GLOBAL CONTROLLED RELEASE FERTILIZER MARKET, VOLUME SHARE(%), BY COUNTRY, 2016 - 2028
- Figure 131:
- GLOBAL CONTROLLED RELEASE FERTILIZER MARKET, VALUE SHARE(%), BY COUNTRY, 2016 - 2028
- Figure 132:
- GLOBAL CONTROLLED RELEASE FERTILIZER MARKET, BY COUNTRY, CANADA, METRIC TON, 2016 - 2028
- Figure 133:
- GLOBAL CONTROLLED RELEASE FERTILIZER MARKET, BY COUNTRY, CANADA, USD, 2016 - 2028
- Figure 134:
- GLOBAL CONTROLLED RELEASE FERTILIZER MARKET, VALUE SHARE(%), BY CROP TYPE, 2021 - 2028
- Figure 135:
- GLOBAL CONTROLLED RELEASE FERTILIZER MARKET, BY COUNTRY, MEXICO, METRIC TON, 2016 - 2028
- Figure 136:
- GLOBAL CONTROLLED RELEASE FERTILIZER MARKET, BY COUNTRY, MEXICO, USD, 2016 - 2028
- Figure 137:
- GLOBAL CONTROLLED RELEASE FERTILIZER MARKET, VALUE SHARE(%), BY CROP TYPE, 2021 - 2028
- Figure 138:
- GLOBAL CONTROLLED RELEASE FERTILIZER MARKET, BY COUNTRY, UNITED STATES, METRIC TON, 2016 - 2028
- Figure 139:
- GLOBAL CONTROLLED RELEASE FERTILIZER MARKET, BY COUNTRY, UNITED STATES, USD, 2016 - 2028
- Figure 140:
- GLOBAL CONTROLLED RELEASE FERTILIZER MARKET, VALUE SHARE(%), BY CROP TYPE, 2021 - 2028
- Figure 141:
- GLOBAL CONTROLLED RELEASE FERTILIZER MARKET, BY COUNTRY, REST OF NORTH AMERICA, METRIC TON, 2016 - 2028
- Figure 142:
- GLOBAL CONTROLLED RELEASE FERTILIZER MARKET, BY COUNTRY, REST OF NORTH AMERICA, USD, 2016 - 2028
- Figure 143:
- GLOBAL CONTROLLED RELEASE FERTILIZER MARKET, VALUE SHARE(%), BY CROP TYPE, 2021 - 2028
- Figure 144:
- GLOBAL CONTROLLED RELEASE FERTILIZER MARKET, BY COUNTRY, VOLUME, METRIC TON, 2016 - 2028
- Figure 145:
- GLOBAL CONTROLLED RELEASE FERTILIZER MARKET, BY COUNTRY, VALUE, USD, 2016 - 2028
- Figure 146:
- GLOBAL CONTROLLED RELEASE FERTILIZER MARKET, VOLUME SHARE(%), BY COUNTRY, 2016 - 2028
- Figure 147:
- GLOBAL CONTROLLED RELEASE FERTILIZER MARKET, VALUE SHARE(%), BY COUNTRY, 2016 - 2028
- Figure 148:
- GLOBAL CONTROLLED RELEASE FERTILIZER MARKET, BY COUNTRY, ARGENTINA, METRIC TON, 2016 - 2028
- Figure 149:
- GLOBAL CONTROLLED RELEASE FERTILIZER MARKET, BY COUNTRY, ARGENTINA, USD, 2016 - 2028
- Figure 150:
- GLOBAL CONTROLLED RELEASE FERTILIZER MARKET, VALUE SHARE(%), BY CROP TYPE, 2021 - 2028
- Figure 151:
- GLOBAL CONTROLLED RELEASE FERTILIZER MARKET, BY COUNTRY, BRAZIL, METRIC TON, 2016 - 2028
- Figure 152:
- GLOBAL CONTROLLED RELEASE FERTILIZER MARKET, BY COUNTRY, BRAZIL, USD, 2016 - 2028
- Figure 153:
- GLOBAL CONTROLLED RELEASE FERTILIZER MARKET, VALUE SHARE(%), BY CROP TYPE, 2021 - 2028
- Figure 154:
- GLOBAL CONTROLLED RELEASE FERTILIZER MARKET, BY COUNTRY, REST OF SOUTH AMERICA, METRIC TON, 2016 - 2028
- Figure 155:
- GLOBAL CONTROLLED RELEASE FERTILIZER MARKET, BY COUNTRY, REST OF SOUTH AMERICA, USD, 2016 - 2028
- Figure 156:
- GLOBAL CONTROLLED RELEASE FERTILIZER MARKET, VALUE SHARE(%), BY CROP TYPE, 2021 - 2028
- Figure 157:
- GLOBAL CONTROLLED RELEASE FERTILIZER MARKET, MOST ACTIVE COMPANIES, BY NUMBER OF STRATEGIC MOVES, 2018 - 2021
- Figure 158:
- GLOBAL CONTROLLED RELEASE FERTILIZER MARKET, MOST ADOPTED STRATEGIES, 2018 - 2021
- Figure 159:
- GLOBAL CONTROLLED RELEASE FERTILIZER MARKET SHARE(%), BY MAJOR PLAYERS, 2021
Controlled Release Fertilizers Industry Segmentation
Polymer Coated, Polymer-Sulfur Coated, Others are covered as segments by Coating Type. Field Crops, Horticultural Crops, Turf & Ornamental are covered as segments by Crop Type. Asia-Pacific, Europe, Middle East & Africa, North America, South America are covered as segments by Region.| Coating Type | |
| Polymer Coated | |
| Polymer-Sulfur Coated | |
| Others |
| Crop Type | |
| Field Crops | |
| Horticultural Crops | |
| Turf & Ornamental |
| Region | |||||||||||||
|
|||||||||||||
|
|||||||||||||
|
|||||||||||||
|
|||||||||||||
|
Market Definition
- AVERAGE NUTRIENT APPLICATION RATE - This refers to the average volume of nutrient consumed per hectare of farmland in each country.
- CROP TYPES COVERED - Field Crops: Cereals, Pulses, Oilseeds, Fiber Crops, and Forage Crops, Horticulture: Fruits, Vegetables, Plantation Crops and Spices, Turf Grass and Ornamentals
- MARKET ESTIMATION LEVEL - Market Estimations for various types of fertilizers has been done at the product-level and not at the nutrient-level.
- NUTRIENT TYPES COVERED - Urea & Complex
Research Methodology
Mordor Intelligence follows a four-step methodology in all our reports.
- Step-1: Identify Key Variables: In order to build a robust forecasting methodology, the variables and factors identified in Step-1 are tested against available historical market numbers. Through an iterative process, the variables required for market forecast are set and the model is built on the basis of these variables.
- Step-2: Build a Market Model: Market-size estimations for the forecast years are in nominal terms. Inflation is not a part of the pricing, and the average selling price (ASP) is kept constant throughout the forecast period for each country.
- Step-3: Validate and Finalize: In this important step, all market numbers, variables and analyst calls are validated through an extensive network of primary research experts from the market studied. The respondents are selected across levels and functions to generate a holistic picture of the market studied.
- Step-4: Research Outputs: Syndicated Reports, Custom Consulting Assignments, Databases & Subscription Platforms


