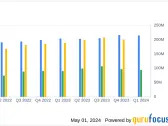
Day Return
YTD Return
1-Year Return
3-Year Return
5-Year Return
Note: Sector performance is calculated based on the previous closing price of all sector constituents
Industries in This Sector
Select an Industry for a Visual Breakdown
| Industry | Market Weight | Day Return | YTD Return |
|---|---|---|---|
| All Industries | 100% | 0.45% | -8.25% |
| REIT - Specialty | 24.20% | 0.55% | -11.45% |
| REIT - Industrial | 16.75% | 0.96% | -17.92% |
| REIT - Residential | 13.31% | 0.31% | -1.38% |
| REIT - Retail | 13.29% | 0.38% | -0.90% |
| REIT - Healthcare Facilities | 8.45% | 0.69% | 4.31% |
| Real Estate Services | 7.55% | -0.74% | -6.49% |
| REIT - Office | 4.74% | -0.12% | -8.42% |
| REIT - Diversified | 4.19% | 0.44% | -17.99% |
| REIT - Mortgage | 3.84% | 1.63% | -6.79% |
| REIT - Hotel & Motel | 2.82% | -0.25% | -4.96% |
| Real Estate - Diversified | 0.49% | 0.04% | -14.84% |
| Real Estate - Development | 0.38% | -1.88% | 62.75% |
Note: Percentage % data on heatmap indicates Day Return
All Industries
-
Largest Companies in This Sector
|
Name
|
Last Price
|
1Y Target Est.
|
Market Weight
|
Market Cap
|
Day Change %
|
YTD Return
|
Avg. Analyst Rating
|
|---|---|---|---|---|---|---|---|
| 102.25 | 135.84 | 6.82% |
|
|
|
Buy
|
|
| 174.07 | 228.00 | 5.85% |
|
|
|
Buy
|
|
| 709.64 | 918.30 | 4.85% |
|
|
|
Buy
|
|
| 95.28 | 103.53 | 4.06% |
|
|
|
Buy
|
|
| 140.63 | 157.40 | 3.79% |
|
|
|
Buy
|
|
| 54.01 | 59.89 | 3.35% |
|
|
|
Buy
|
|
| 260.93 | 310.93 | 3.31% |
|
|
|
Buy
|
|
| 139.65 | 145.63 | 3.21% |
|
|
|
Buy
|
|
| 93.81 | 111.47 | 2.94% |
|
|
|
Hold
|
|
| 91.03 | 104.17 | 2.68% |
|
|
|
Buy
|
Investing in the Real Estate Sector
Start Investing in the Real Estate Sector Through These ETFs and Mutual Funds
ETF Opportunities
|
Name
|
Last Price
|
Net Assets
|
Expense Ratio
|
YTD Return
|
|---|---|---|---|---|
| 79.90 | 64.914B | 0.12% |
|
|
| 18.84 | 6.514B | 0.07% |
|
|
| 36.33 | 6.15B | 0.09% |
|
|
| 82.97 | 4.275B | 0.40% |
|
|
| 22.20 | 3.617B | 0.14% |
|
Mutual Fund Opportunities
|
Name
|
Last Price
|
Net Assets
|
Expense Ratio
|
YTD Return
|
|---|---|---|---|---|
| 112.80 | 64.914B | 0.12% |
|
|
| 17.46 | 64.914B | 0.12% |
|
|
| 26.45 | 64.914B | 0.12% |
|
|
| 20.16 | 8.77B | 0.08% |
|
|
| 19.11 | 8.426B | 0.08% |
|
Real Estate Research
Discover the Latest Analyst and Technical Research for This Sector
-
Analyst Report: AvalonBay Communities, Inc.
AvalonBay Communities owns a portfolio of 281 apartment communities with over 87,000 units and is developing 18 additional properties with over 6,200 units. The company focuses on owning large, high-quality properties in major metropolitan areas of New England, New York/New Jersey, Washington D.C., California, and the Pacific Northwest.
RatingPrice Target -
Daily – Vickers Top Insider Picks for 05/01/2024
The Vickers Top Insider Picks is a daily report that utilizes a proprietary algorithm to identify 25 companies with compelling insider purchase histories based on transactions over the past three months.
-
Analyst Report: Weyerhaeuser Company
Weyerhaeuser ranks among the world's largest forest product companies. Following the 2016 sale of its pulp business to International Paper, Weyerhaeuser operates three business segments: timberlands, wood products, and real estate. Weyerhaeuser is structured as a real estate investment trust and is not required to pay federal income taxes on earnings generated by timber harvest activities. Earnings from its wood products segment are subject to federal income tax. Weyerhaeuser acquired fellow timber REIT Plum Creek in 2016.
RatingPrice Target -
Analyst Report: Sun Communities, Inc.
Sun Communities is a residential REIT that focuses on owning manufactured housing, residential vehicle communities, and marinas. The company currently owns a portfolio of 667 properties, which includes 353 manufactured housing communities, 179 residential vehicle communities, and 135 marina properties. Sun targets owning properties that are desirable as second homes or vacation properties with nearly 50% of the portfolio located in either Florida or Michigan near major bodies of water.
RatingPrice Target