
Markets in a Minute
Mapped: The Growth in U.S. House Prices by State


How to use: Arrows on side of slides navigate between 1-year growth, 5-year growth, and growth since 1991.


This infographic is available as a poster.
The Growth in U.S. House Prices by State
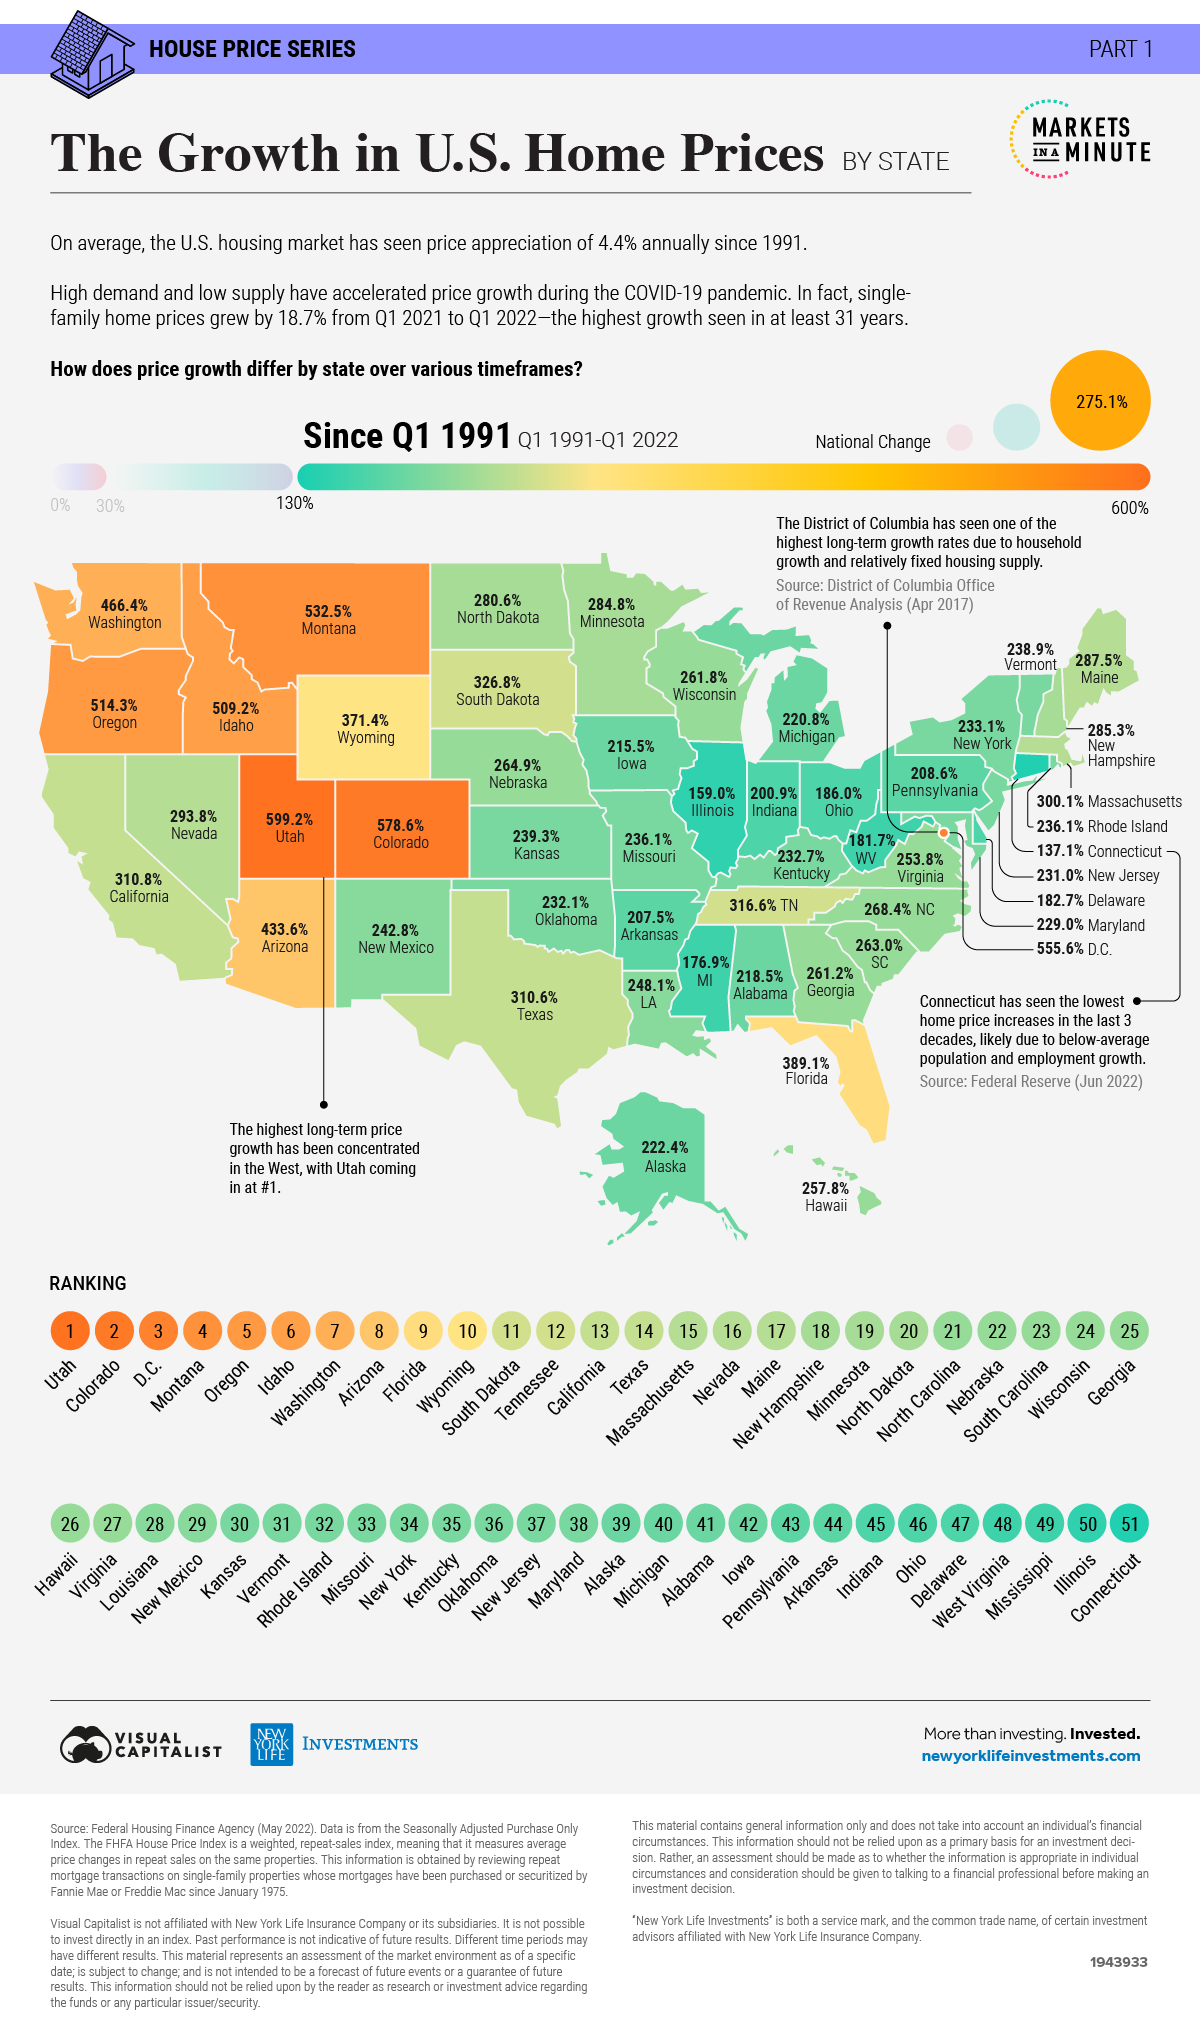
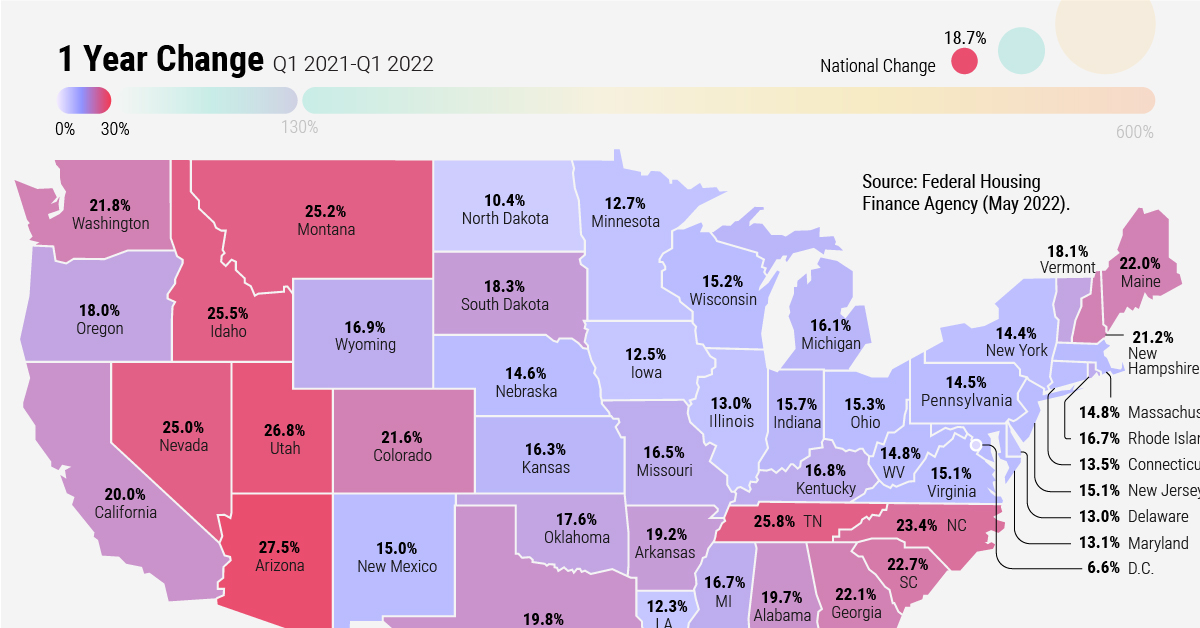
On average, the U.S. housing market has seen price appreciation of 4.4% annually since 1991. High demand and low supply have accelerated price growth during the COVID-19 pandemic. In fact, single-family house prices grew by 18.7% from the first quarter of 2021 to the first quarter of 2022—the highest growth seen in at least 31 years.
This Markets in a Minute from New York Life Investments, the first in a three-part series on house prices, shows how house price growth has differed by state over various timeframes.
How Is House Price Growth Measured?
We used data from the Federal Housing Finance Agency’s (FHFA) House Price Index. The index measures changes in single-family home values and is seasonally adjusted. It is also a repeat-sales index, meaning it measures average price changes in repeat sales on the same properties.
FHFA obtains this information by reviewing repeat mortgage transactions on single-family properties whose mortgages have been purchased or securitized by Fannie Mae or Freddie Mac.
Short and Long-Term Growth in House Prices
The below table shows house price growth over the last year, last five years, and since the first quarter of 1991. It should be noted that the growth measures up to March 2022, based on the latest available data. As of March 2022, higher mortgage rates had not yet translated into slower price growth.
| State/District | 1-Year Rank | 1-Year Growth |
5-Year Growth |
Growth Since Q1 1991 |
|---|---|---|---|---|
| Florida | 1 | 29.8% | 81.5% | 389.1% |
| Arizona | 2 | 27.5% | 91.4% | 433.6% |
| Utah | 3 | 26.8% | 99.6% | 599.2% |
| Tennessee | 4 | 25.8% | 79.7% | 316.6% |
| Idaho | 5 | 25.5% | 121.6% | 509.2% |
| Montana | 6 | 25.2% | 77.1% | 532.5% |
| Nevada | 7 | 25.0% | 83.1% | 293.8% |
| North Carolina | 8 | 23.4% | 72.8% | 268.4% |
| Hawaii | 9 | 22.8% | 59.2% | 257.8% |
| South Carolina | 10 | 22.7% | 67.0% | 263.0% |
| Georgia | 11 | 22.1% | 70.7% | 261.2% |
| Maine | 12 | 22.0% | 71.5% | 287.5% |
| Washington | 13 | 21.8% | 83.1% | 466.4% |
| Colorado | 14 | 21.6% | 70.6% | 578.6% |
| New Hampshire | 15 | 21.2% | 66.7% | 285.3% |
| California | 16 | 20.0% | 63.1% | 310.8% |
| Texas | 17 | 19.8% | 58.7% | 310.6% |
| Alabama | 18 | 19.7% | 58.6% | 218.5% |
| Arkansas | 19 | 19.2% | 51.2% | 207.5% |
| South Dakota | 20 | 18.3% | 56.7% | 326.8% |
| Vermont | 21 | 18.1% | 50.8% | 238.9% |
| Oregon | 22 | 18.0% | 63.1% | 514.3% |
| Oklahoma | 23 | 17.6% | 47.3% | 232.1% |
| Wyoming | 24 | 16.9% | 47.2% | 371.4% |
| Kentucky | 25 | 16.8% | 52.2% | 232.7% |
| Mississippi | 26 | 16.7% | 41.6% | 176.9% |
| Rhode Island | 27 | 16.7% | 61.2% | 236.1% |
| Missouri | 28 | 16.5% | 57.3% | 236.1% |
| Kansas | 29 | 16.3% | 52.6% | 239.3% |
| Michigan | 30 | 16.1% | 59.5% | 220.8% |
| Indiana | 31 | 15.7% | 61.0% | 200.9% |
| Ohio | 32 | 15.3% | 57.8% | 186.0% |
| Wisconsin | 33 | 15.2% | 55.1% | 261.8% |
| Virginia | 34 | 15.1% | 49.9% | 253.8% |
| New Jersey | 35 | 15.1% | 50.8% | 231.0% |
| New Mexico | 36 | 15.0% | 52.1% | 242.8% |
| West Virginia | 37 | 14.8% | 38.3% | 181.7% |
| Massachusetts | 38 | 14.8% | 54.8% | 300.1% |
| Nebraska | 39 | 14.6% | 53.8% | 264.9% |
| Pennsylvania | 40 | 14.5% | 49.4% | 208.6% |
| New York | 41 | 14.4% | 50.3% | 233.1% |
| Connecticut | 42 | 13.5% | 43.9% | 137.1% |
| Maryland | 43 | 13.1% | 40.6% | 229.0% |
| Delaware | 44 | 13.0% | 47.6% | 182.7% |
| Illinois | 45 | 13.0% | 35.3% | 159.0% |
| Minnesota | 46 | 12.7% | 48.5% | 284.8% |
| Iowa | 47 | 12.5% | 38.1% | 215.5% |
| Louisiana | 48 | 12.3% | 31.5% | 248.1% |
| Alaska | 49 | 10.5% | 29.1% | 222.4% |
| North Dakota | 50 | 10.4% | 26.2% | 280.6% |
| D.C. | 51 | 6.6% | 34.8% | 555.6% |
Over the last year, the growth in prices was highest in Florida. Close to a thousand people move to Florida every day, and some snowbirds have decided to make Florida their permanent home.
Arizona follows closely behind, with one-year house price growth reaching 27.5%. Houses are not being built fast enough to meet demand. While Phoenix and the surrounding areas have plenty of single-family homes, there is little high-density housing due to zoning restrictions.
If we take a longer view, house prices have grown the fastest in the West since 1991. Utah saw the highest growth of 599.2%. The state’s population has gotten three times larger over the last 50 years, due to both migration and a high fertility rate. Some are drawn by high tech opportunities that earned the state the nickname “Silicon Slopes”.
Of course, the above data has limitations in that it is across entire states. The FHFA also shares the metro areas with the highest house price growth over the last year. In line with state growth, the top four areas are all in Florida. However, number five on the list is Knoxville, Tennessee. The price growth is partly due to a supply shortage. Knox County had 1,332 active listings in 2019, and just 324 listings by the end of 2021.
The Factors Driving the Growth in House Prices
While home price growth has accelerated during the COVID-19 pandemic, the supply-demand imbalance has been building over time.
The U.S. built 276,000 fewer homes annually between 2000-2020 compared to the 30 years prior. Zoning restrictions in some areas have also limited the number of housing units that can be built on a parcel of land. Since the 2008 global financial crisis, roughly 64% of all authorized housing has been single-family homes. Ultimately, the lack of housing has helped drive up prices.
The magnitude of the price gain depends on where a homeowner had purchased. Historically, the growth in real estate prices has been highest in areas with strong job prospects, high population growth, and low housing supply.
In the second part of the house price series, we’ll explore the relationship between house prices and inflation.


Markets in a Minute
The Top 5 Reasons Clients Fire a Financial Advisor
Firing an advisor is often driven by more than cost and performance factors. Here are the top reasons clients ‘break up’ with their advisors.

The Top 5 Reasons Clients Fire a Financial Advisor
What drives investors to fire a financial advisor?
From saving for a down payment to planning for retirement, clients turn to advisors to guide them through life’s complex financial decisions. However, many of the key reasons for firing a financial advisor stem from emotional factors, and go beyond purely financial motivations.
We partnered with Morningstar to show the top reasons clients fire an advisor to provide insight on what’s driving investor behavior.
What Drives Firing Decisions?
Here are the top reasons clients terminated their advisor, based on a survey of 184 respondents:
| Reason for Firing | % of Respondents Citing This Reason |
Type of Motivation |
|---|---|---|
| Quality of financial advice and services |
32% | Emotion-based reason |
| Quality of relationship | 21% | Emotion-based reason |
| Cost of services | 17% | Financial-based reason |
| Return performance | 11% | Financial-based reason |
| Comfort handling financial issues on their own |
10% | Emotion-based reason |
Numbers may not total 100 due to rounding. Respondents could select more than one answer.
Numbers may not total 100 due to rounding. Respondents could select more than one answer.
While firing an advisor is rare, many of the primary drivers behind firing decisions are also emotionally driven.
Often, advisors were fired due to the quality of the relationship. In many cases, this was due to an advisor not dedicating enough time to fully grasp their personal financial goals. Additionally, wealthier, and more financially literate clients are more likely to fire their advisors—highlighting the importance of understanding the client.
Key Takeaways
Given these driving factors, here are five ways that advisors can build a lasting relationship through recognizing their clients’ emotional needs:
- Understand your clients’ deeper goals
- Reach out proactively
- Act as a financial coach
- Keep clients updated
- Conduct goal-setting exercises on a regular basis
By communicating their value and setting expectations early, advisors can help prevent setbacks in their practice by adeptly recognizing the emotional motivators of their clients.
Markets in a Minute
The Top 5 Reasons Clients Hire a Financial Advisor
Here are the most common drivers for hiring a financial advisor, revealing that investor motivations go beyond just financial factors.

The Top 5 Reasons Clients Hire a Financial Advisor
What drives investors to hire a financial advisor?
From saving for a down payment to planning for retirement, clients turn to advisors to guide them through life’s complex financial decisions. However, many of the key reasons for hiring a financial advisor stem from emotional factors, and go beyond purely financial motivations.
We partnered with Morningstar to show the top reasons clients hire a financial advisor to provide insight on what’s driving investor behavior.
What Drives Hiring Decisions?
Here are the most common reasons for hiring an advisor, based on a survey of 312 respondents.
| Reason for Hiring | % of Respondents Citing This Reason |
Type of Motivation |
|---|---|---|
| Specific goals or needs | 32% | Financial-based reason |
| Discomfort handling finances | 32% | Emotion-based reason |
| Behavioral coaching | 17% | Emotion-based reason |
| Recommended by family or friends |
12% | Emotion-based reason |
| Quality of relationship | 10% | Emotion-based reason |
Numbers may not total 100 due to rounding. Respondents could select more than one answer.
While financial factors played an important role in hiring decisions, emotional reasons made up the largest share of total responses.
This illustrates that clients place a high degree of importance on reaching specific goals or needs, and how an advisor communicates with them. Furthermore, clients seek out advisors for behavioral coaching to help them make informed decisions while staying the course.
Key Takeaways
With this in mind, here are five ways advisors can provide value to their clients and grow their practice:
- Address clients’ emotional needs early on
- Demonstrate how you can offer support
- Use ordinary language
- Provide education to help clients stay on track
- Acknowledge that these are issues we all face
By addressing emotional factors, advisors can more effectively help clients’ navigate intricate financial decisions and avoid common behavioral mistakes.

The Top 5 Reasons Clients Fire a Financial Advisor

The Top 5 Reasons Clients Hire a Financial Advisor

Visualizing the Growth of $100, by Asset Class

How Small Investments Make a Big Impact Over Time

What Were the Top Performing Investment Themes of 2023?
-

 Infographics2 years ago
The Top Investment Quotes Every Investor Should Know
-

 Markets in a Minute2 years ago
How Closely Related Are Historical Mortgage Rates and Housing Prices?
-

 Infographics2 years ago
A Visual Guide to Stagflation, Inflation, and Deflation
-

 Markets in a Minute1 year ago
Mapped: Global Energy Prices, by Country in 2022
-

 Markets in a Minute2 years ago
Visualizing Historical Oil Prices (1968-2022)
-

 Infographics1 year ago
Visual Guide: The Three Types of Economic Indicators
-

 Markets in a Minute2 years ago
Mapped: Global Macroeconomic Risk, by Country in 2022
-
 Markets in a Minute2 years ago
Chart: Money Supply and Inflation Over 150 Years
