-
-
-
![Presentations]() Presentations Keep your audience engaged.
Presentations Keep your audience engaged. -
![Documents]() Documents Formalize your branding.
Documents Formalize your branding. -
![Videos]() Videos Add movement to your brand.
Videos Add movement to your brand. -
![Infographics]() Infographics Share information visually.
Infographics Share information visually. -
![Whiteboards]() Whiteboards Brainstorming, plan, and design.
Whiteboards Brainstorming, plan, and design. -
![Charts and Graphs]() Charts and Graphs Bring life to your data.
Charts and Graphs Bring life to your data. -
![Social Media Graphics]() Social Media Graphics Create scroll-stopping content.
Social Media Graphics Create scroll-stopping content. -
![Forms & Surveys]() Forms & Surveys Visual forms that convert.
Forms & Surveys Visual forms that convert. -
![Mockups]() Mockups Create high-quality mockups in seconds.
Mockups Create high-quality mockups in seconds. -
![Printables]() Printables Create content for printing.
Printables Create content for printing.
-
-
-
-
-
-
-
![Presentations]() Presentations 1000+ layouts and themes.
Presentations 1000+ layouts and themes. -
![Chart & Maps]() Chart & Maps Get data visualization ideas.
Chart & Maps Get data visualization ideas. -
![Social Media Graphics]() Social Media Graphics Browse templates for every platform.
Social Media Graphics Browse templates for every platform. -
![Infographics]() Infographics Find the right format for your information.
Infographics Find the right format for your information. -
![Documents]() Documents Templates for every business document.
Documents Templates for every business document. -
![Videos & GIFs]() Videos & GIFs Find the perfect preanimated template.
Videos & GIFs Find the perfect preanimated template. -
![Branded Templates]() Branded Templates Get a bundle of templates that match your brand.
Branded Templates Get a bundle of templates that match your brand. -
![Forms & Surveys]() Forms & Surveys Forms for engagement and conversions.
Forms & Surveys Forms for engagement and conversions.
-
-
Free Report Maker for Engaging Reports

- Different report types for different needs.
- Create high quality reports with our user-friendly drag-and-drop editor.
- Use our report templates and create reports your audience will love.

Chosen by brands large and small
Our report maker is used by over 27,500,000 marketers, communicators, executives and educators from over 133 countries that include:


EASY TO EDIT
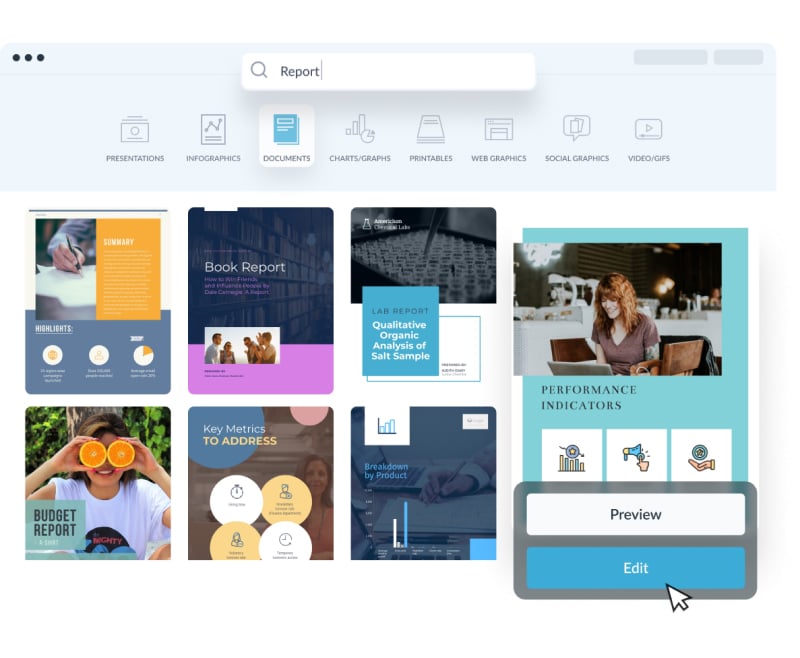
Report Templates
Save yourself the added stress of starting a report design from scratch. Instead, use one of Visme’s gorgeously pre-designed report templates. You can fully customize it to fit your content and your brand, coming out with a stunning report without having to put any design effort in.


Features of the Report Maker
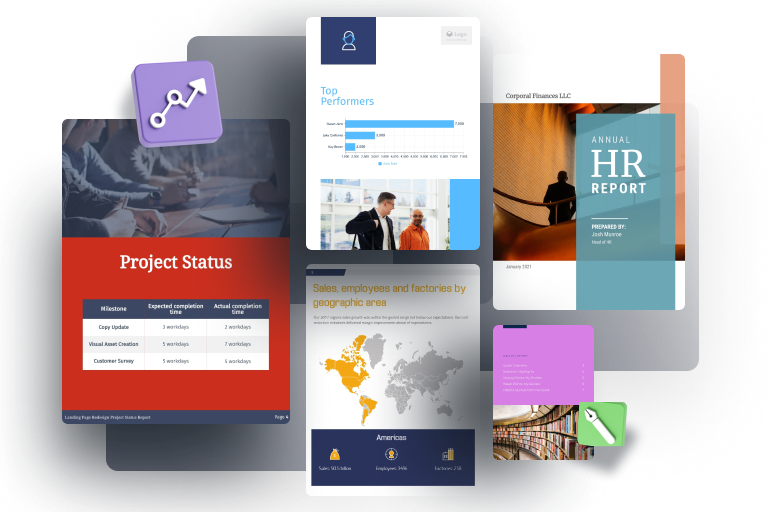
Beautiful report templates
Don’t create a multi-page report from scratch. We’ve got dozens of beautifully designed report templates for any need and any industry. All you need to do is pop in your content and data, customize the fonts and colors to match your brand, and download your report.
Build your report
Build a custom report that fits your industry and your report needs. Build a weekly report, quarterly report, annual report, trend report or any other type of report that you can dream up with Visme’s free online report maker.

Customize every aspect of your report to make your information beautiful
Just because a report might be stock full of information doesn’t mean it can’t still be beautiful! Start with a pre-designed template or create your report from scratch with Visme’s content blocks and design elements. Customize every color, every icon and every text box to make your report design stand out.

Turn your documents into page-turners
With an interactive page flip effect, your audience can engage with a document as though they were holding it in their hands. That means more interactivity, more engagement and more design power in your hands. Now that’s flipping cool.
More Great Features of the Report Maker
![Free premade report templates to fit every industry]() Free premade report templates to fit every industry
Free premade report templates to fit every industry![Dozens of easy-to-read serif and sans serif fonts available]() Dozens of easy-to-read serif and sans serif fonts available
Dozens of easy-to-read serif and sans serif fonts available![Millions of stock photos and icons to choose from]() Millions of stock photos and icons to choose from
Millions of stock photos and icons to choose from![Easy drag-and-drop design tools, made with the non-designer in mind]() Easy drag-and-drop design tools, made with the non-designer in mind
Easy drag-and-drop design tools, made with the non-designer in mind![Pre-designed content blocks to drop into your report design]() Pre-designed content blocks to drop into your report design
Pre-designed content blocks to drop into your report design![Download as a PDF file or embed on a webpage]() Download as a PDF file or embed on a webpage
Download as a PDF file or embed on a webpage
Share Your Report
Once you’ve finished putting together your report, you have so many ways to share it with your team or your audience. You can download the report as a PDF, embed it onto a webpage to share with your audience or share a live Visme link to an interactive report.

LEARN ABOUT REPORTS
What is a Report?
A report is a formal compilation of information, whether it’s a sales report sharing revenue data, a quarterly report sharing a company’s growth, or a market research report sharing demographics for a particular industry.
Reports are used across a variety of different teams and industries, so we offer a ton of template options to fit nearly any use case you might need. Simply choose a template and customize it to fit your content and your brand.
Use the report maker to brand company documents.
When you’re creating reports for your company, you typically want them to look like they belong to your organization by incorporating your brand colors and fonts. Visme’s professional report maker allows you to save your brand style right inside your Brand Kit to easily access from the platform and create branded company documents.
EVERYTHING YOU NEED + MORE
More Than a Report Maker
Visme’s free report maker isn’t just any old report maker. With tons of gorgeous report templates to choose from, the ease of adding, removing and reorganizing pages, and a massive library of design assets, you’ll never use another platform to create your report.
MAKE IT ENGAGING
Interactivity
Create interactive reports with popup and rollover effects that allow your viewer to interact with your design to learn more information.
EASY-TO-USE DATA VISUALIZATION TOOLS
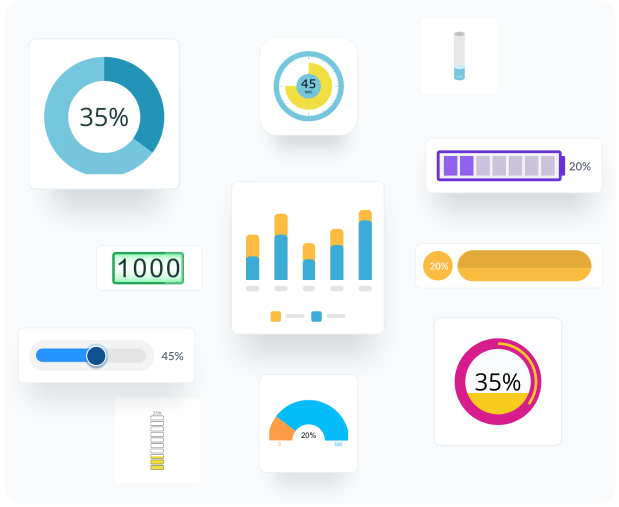
Charts & Graphs
Showcase sales, marketing, website data and more in your reports with Visme’s easy-to-use charts, graphs and other data visualization tools.
BEAUTIFY YOUR CONTENT
Images & Graphics
Choose from over a million stock photos, icons, illustrations, characters, lines, shapes and more to create a completely unique report.
HOW IT WORKS
How to Make Reports in 5 Steps
Use Visme’s Report Maker to create reports for various needs and purposes—social media reports (e.g., LinkedIn performance report), business reports, sales reports, marketing reports, monthly reports, annual reports, case studies and more.
We walk you through five easy steps to create a report right in Visme, making it as easy as possible for you to get started creating your own report right away.
- Log into your Visme dashboard and create a new project. Choose a report template to jumpstart your design.
- Use the Brand Kit to match your company branding with your report design.
- Add in your content, incorporate data visualizations, choose accent photos and icons and turn the template into your own creation.
- Proofread your report content to make sure it’s ready to be sent to your team or your supervisor.
- Download your finished design from the online report maker as a PDF to print off or email to your team.
QUICK TIPS
How to Use the Report Maker
01
Put together all of your content ahead of time so that you know exactly what you need to include. This will help you to choose a template that you know your content can fit into.
02
Log in to Visme and start a new project. Click on the Documents tab to access our library of report templates.
03
Select one of the ready-to-use templates based on which one will best fit your content. You can customize every other aspect of the template later, so it’s better to choose based on your content.
04
Edit all of the text areas and data visualizations to add the content into your report.
05
Use the Brand Kit to customize the fonts and colors to match your brand, sticking to just one or two fonts and colors throughout your report.
06
Change or resize the icons and photos in the template to fit your vision or upload your own photos to use.
07
Proofread all of your information to make sure there are no typos and you’ve included everything you need to share.
08
Generate a shareable link to your live report, download your finished report as a PDF to attach in an email or embed your interactive reports on a webpage for your audience to view.
Frequently Asked Questions (FAQs)
How do I create a report online?
Can I go back and edit my report?
Can I use my Brand Kit with the report maker?
Can I add charts and maps to my report?
Are there any report templates?
How do you write a professionally-looking report?