

Abstract
One of the clearest indicators of human-caused climate change is the rapid decline in Arctic sea ice. The summer minimum coverage is now approximately half of its extent only 40 yr ago. Four records in the minimum extent were broken since 2000, the most recent occurring in September 2012. No new records have been set since then, however, owing to an abrupt atmospheric shift during each August/early-September that brought low sea-level pressure, cloudiness, and unfavorable wind conditions for ice reduction. While random variability could be the cause, we identify a recently increased prevalence of a characteristic large-scale atmospheric pattern over the northern hemisphere. This pattern is associated not only with anomalously low pressure over the Arctic during summer, but also with frequent heatwaves over East Asia, Scandinavia, and northern North America, as well as the tendency for a split jet stream over the continents. This jet-stream configuration has been identified as favoring extreme summer weather events in northern mid-latitudes. We propose a mechanism linking these features with diminishing spring snow cover on northern-hemisphere continents that acts as a negative feedback on the loss of Arctic sea ice during summer.
Export citation and abstract BibTeX RIS

Original content from this work may be used under the terms of the Creative Commons Attribution 4.0 license. Any further distribution of this work must maintain attribution to the author(s) and the title of the work, journal citation and DOI.
1. Introduction
The globe's seven warmest years have all occurred since 2012 (http://climate.nasa.gov), and Arctic warming has continued to outpace global warming by over a factor of three (figure S1 (available online at https://stacks.iop.org/ERL/15/114034/mmedia)). So why has a new record minimum in Arctic sea-ice extent not been set since 2012? During all months of the year, and particularly in September, the ice extent has exhibited a steep decline since satellites began observing it in the 1970s (figure 1). Proxy records suggest that summer ice extent is now smaller than at any time in the past one and one-half millennia (Kinnard et al 2011). In recent years, an ominous string of new record-minimum extents occurred in 2003, 2005, and 2007, followed by a dramatic loss in 2012 attributed to an abnormally thin, vulnerable ice cover whose reduction was accelerated by an intense but brief storm (Zhang et al 2013). Ever since that record-smashing summer, Arctic scientists have watched melt seasons unfold with bated breath: will this year break the record again? Will this year bring the long-anticipated sea-ice-free summer? Through spring and early-summer months, ice extents approached and sometimes exceeded previous record low values. And nearly every summer since 2012, the downward trajectory abruptly ceased as low pressure and clouds developed unexpectedly over the central Arctic, conditions unfavorable for melt. No new minimum records have been set since then, even though winter maxima have reached record lows—or nearly so—every year since 2014 and thick multi-year ice has been steadily supplanted by thin, seasonal ice (Richter-Menge et al 2019). Is this reduced decline in extent caused by a quirk of natural variability, or has something changed in the system that applied the brakes on ice retreat?
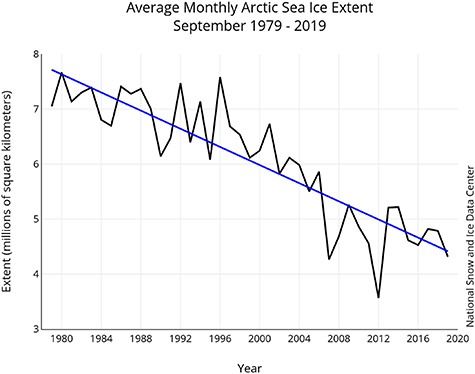
Figure 1. Time series of September-mean Arctic sea-ice extent (millions of km2) during 1979–2019. Trend slope = −0.8 ± 0.1 million km2 dec−1 (significant with >95% confidence). From the National Snow and Ice Data Center: https://nsidc.org/data/seaice_index/, Fetterer et al. (2017).
Download figure:
Standard image High-resolution imageThe monthly evolution of the sea-ice cover shown in figure 2 clearly portrays the rapid pace of ice loss every spring and summer since 2012, along with the abrupt slowing of the decline in extent that ensued each August or early September (except the near-record-breaking 2020 summer). Together with this unusual behavior is a general negative trend in sea-level pressure (SLP) over the Arctic Ocean in August during the past two decades (figure 3(a)), albeit with large interannual variability. Lower pressure generally brings increased cloudiness that reduces downwelling solar radiation contributing to slower ice loss, along with possible offsetting effects of downwelling longwave radiation, which depends on cloud-base temperature. Moreover, anomalous low pressure tends to spread the ice cover, as mechanical forcing creates motion to the right of the wind velocity. The spatial trends in August SLP from 2010 to 2020 (figure 3(b)) exhibit negative SLP anomalies dominating the Arctic Ocean along with positive trends over high- and mid-latitude continental areas. Surface pressure over the Arctic is projected to decrease further as greenhouse gases continue to accumulate in the atmosphere (Vavrus et al 2012, Koinigk et al 2013), perhaps providing a negative feedback on the pace of sea-ice loss in a warming world.
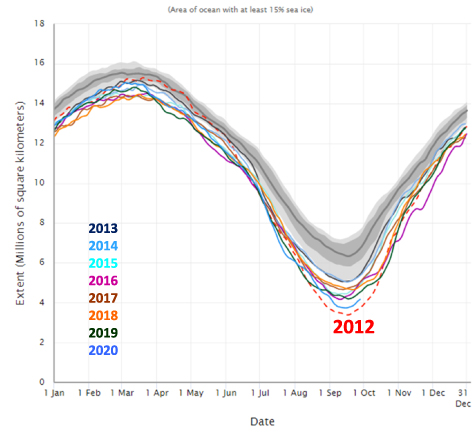
Figure 2. Annual cycle of Arctic sea-ice extent (area with >15% ice concentration). Red dashed line is for 2012, other colored lines are for years from 2013 to 2020, dark gray line is the median for 1981–2010 with dark (light) shading indicating the interquartile (interdecile) range. Created using data from NSIDC: https://nsidc.org/arcticseaicenews/charctic-interactive-sea-ice-graph/, Fetterer et al. (2017).
Download figure:
Standard image High-resolution image
Figure 3. (a) Timeseries of SLP [hPa] during August 1980–2020 north of 70°N. Dashed blue line denotes the mean, and the red dashed line represents the trend from 2010 to 2020. (b) Spatial distribution of trends in August SLP from 2010 to 2020 [hPa yr−1], with purple contours indicating significance >90% confidence. Data are from the NCEP/NCAR reanalysis.
Download figure:
Standard image High-resolution imageIn this study we explore an hypothesis that may explain the sudden reduction in the rate of decline in sea-ice extent during August/early September since the most recent record-low minimum extent in 2012, and relate this phenomenon with other observed changes, such as an increasing frequency of vicious heatwaves afflicting many areas around the northern hemisphere, particularly East Asia. Could the cool Arctic/hot Asia pattern be two faces of the same coin? We will present evidence and a possible mechanism that connects these events with changes in atmospheric circulation, the newly identified quasi-resonance amplification (QRA) fingerprint (Mann et al 2017), and earlier loss of continental snow-cover during spring. We build on the results of Wu and Francis (2019), who proposed a mechanism linking unusually cool Arctic summers with an increasing frequency of Asian heatwaves.
2. Data and methods
Atmospheric data over the northern hemisphere used in this study span 1979–2020 and were obtained from the National Center for Environmental Prediction/National Center for Atmospheric Research Reanalysis (Kalnay et al 1996), accessed at http://iridl.ldeo.columbia.edu. Variables include daily near-surface air temperatures (SATs), SLP, winds at 300 hPa, cloud amount, and geopotential heights, as well as monthly mean SLP, winds, and geopotential heights. Heatwave events were identified when daily SATs exceeded 1 standard deviation during summer months (June–August). Results were similar when a threshold of 1.5 standard deviation was applied. Similarly, anomalous SLP was flagged when a daily value either exceeded or fell below ±1.5 standard deviations. Sea-ice extents were obtained from the National Snow and Ice Data Center (https://nsidc.org/), and snow-cover anomalies were obtained from the Rutgers Snow Lab (https://climate.rutgers.edu/snowcover/).
The 1000–500 hPa thickness fields were used to represent the mean temperature of the low- to mid-troposphere. Empirical orthogonal function (EOF) analysis was applied to identify the first two dominant patterns and principal components (PCs) of the thickness fields during summer north of 30°N. An Arctic Westerly Index was defined as the area-weighted, regionally averaged, 300 hPa zonal wind north of 70°N.
3. Results
We begin by exploring the first two PCs of the 1000–500 hPa thickness fields over the northern hemisphere during summer (June–August) from 1979 to 2020 (figure 4(a)). The time series of the first PC (PC1, solid red line) exhibits a significant (>99% confidence) positive trend (dashed red line), consistent with anthropogenic global warming, and accounts for 30% of the variability. The second PC, accounting for 10% of the variance, is plotted in blue, and displays some intriguing features. While there is no significant trend, a cluster of high values occurred since 2005. A notable period of low values, highlighted with the blue dashed line, appeared during 2007–2012, coincident with rapid ice loss. Regressing the summer 1000–500 hPa thickness anomalies onto the two PCs (figures 4(b), (c)), we see that positive values around most of the northern hemisphere are associated with PC1, particularly over the Arctic and eastern sections of northern hemisphere continents, consistent with observed positive trends in 500 hPa geopotential heights during summer over the domain (not shown). Thickness anomalies corresponding to PC2, however, exhibit a highly significant negative (cold) anomaly over the central Arctic along with strong positive anomalies over mid-latitude East Asia, Scandinavia, north-central North America, and the northwest Pacific Ocean. For this study, PC2 will be the primary focus of analysis.
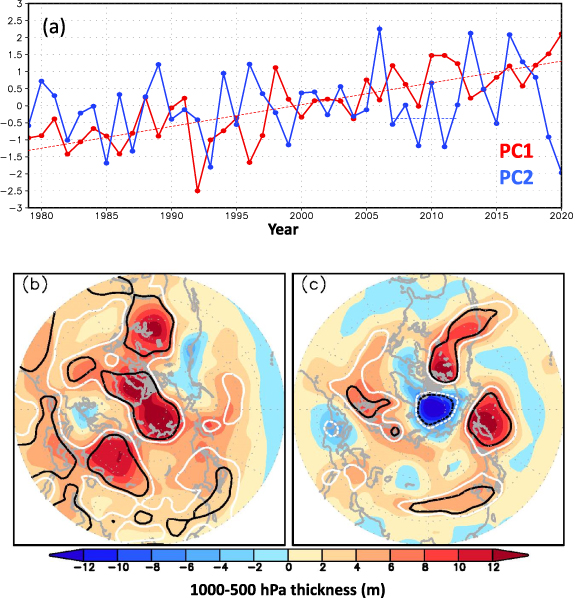
Figure 4. (a) The first two principal components (unitless) of summer (JJA) 1000–500 hPa thickness variability north of 30°N from 1979 to 2020 (red: PC1; blue: PC2), accounting for 30% and 10% of the variance. The red (blue) dashed line represents a linear trend in PC1 (mean of PC2 averaged over 2007–2012). (b) Summer 1000–500 hPa thickness anomalies (m), derived from a linear regression on the normalized detrended PC1. (c) As in (b), but for the regression on the normalized PC2. White and black contours represent 95% and 99% confidence levels.
Download figure:
Standard image High-resolution imageWe next composite SLP for recent Augusts with positive and negative values of PC2 (figure 5). When PC2 is positive, SLP over the Arctic exhibits a pronounced negative anomaly, along with a positive anomaly over northcentral Eurasia (figure 5(a)). These conditions favor cloudy conditions over the Arctic (figure S2) that tend to reduce air temperatures (figure S3) and sea-ice melt, while associated anomalous cyclonic winds prevent ice transport out of the Fram Strait and sea-water mixing over the Arctic Ocean. The combination of these factors would retard the pace of sea-ice decline leading up to the annual minimum extent in September. Meanwhile, the dome of anomalously high pressure across Eurasia is conducive to stagnant airmasses and descending vertical motions, both of which contribute to heatwaves. During summers dominated by negative PC2 values (figure 5(b)), August SLP anomalies differ markedly. Over the Arctic a dipole pattern of high pressure in the western Arctic along with anomalously low pressure over central Siberia sets up an anomalous wind flow that favors a strong Beaufort Gyre, the export of ice into the North Atlantic, and anomalously warm air temperatures over the Arctic Ocean (figure S3), contributing to a general reduction in sea-ice extent. Some of the lowest September ice extents occurred during this period of low PC2 values (figure 1).
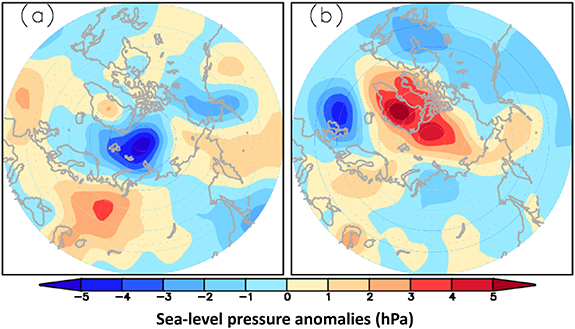
Figure 5. (a) Composites of SLP anomalies (hPa) in August during summers since 2005 with positive PC2 values (2006, 2013, 2016, 2017, 2018), (b) as in (a), but for summers with negative PC2 values (2007, 2008, 2009, 2011, 2012, 2015, 2019).
Download figure:
Standard image High-resolution imageCoincident with sea-ice loss in recent decades has been an increased frequency of heatwaves in several regions of the northern hemisphere, including parts of Asia, Scandinavia, and northern North America (e.g. Donat et al 2013, Christidis et al 2014). In figure 6(a) we present the frequency of heatwaves regressed onto PC2, indicating that several regions exhibit significant propensity for heatwaves when PC2 is positive. In addition to the continental areas mentioned above, ocean heatwaves have also increased significantly over the North Pacific and Atlantic Oceans, consistent with Smale et al (2019), a topic worthy of future research. Here we focus on the continental areas outlined with green boxes in figure 6(a). Figures 6(b), (c), and (d) display time series of regionally averaged heatwave occurrence for summers from 1979 to 2019. Positive trends over Asia and Scandinavia are particularly strong (p < 0.01), while northern North America has experienced a series of years with frequent heatwaves since 2011, especially summers with high PC2 values (2013, 2016, 2017, and 2018). These results suggest that positive PC2 values are accompanied by frequent heatwaves in several regions of the northern hemisphere, anomalously low SLP over the Arctic, and a reduced pace of sea-ice loss a few weeks before the typical summer minimum extent. But are they connected, and if so, what is the mechanism?
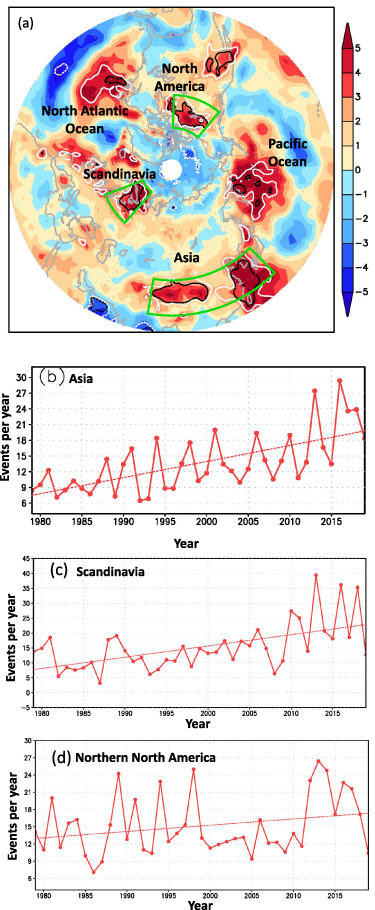
Figure 6. (a) Frequency of heatwaves (daily SATs > 1 standard deviation) during summers of 1979–2019 regressed onto PC2. White and black contours denote 95% and 99% confidence levels. Time series of heatwaves in regions denoted by green boxes in (a) for East Asia (b, p < 0.01), Scandinavia (c, p < 0.01), and northern North America (d, p < 0.1). Units are events per year.
Download figure:
Standard image High-resolution imageHeatwaves generally occur during stagnant high-pressure systems, which are caused by weak upper-level flow and intensified by persistent surface warming and drying soils. Indeed, Coumou et al (2015) and Coumou and De Luca (2020) report a weakening of summertime circulation in mid-latitudes associated with more persistent weather patterns and prolonged heat extremes. To investigate the role of the large-scale circulation in the proposed linkage between sea ice and heatwaves, we regress the summer zonal wind anomalies at 300 hPa onto PC2 (figure 7). A striking collocation of negative anomalies (weak winds) with regions of frequent heatwaves is apparent. Every region where a significant increase in heatwaves occurs in association with PC2 (figure 6(a)) corresponds to a band of significantly weaker zonal winds. Over the Arctic Ocean, we find that zonal westerly winds are strong when PC2 is positive, suggesting enhanced cyclogenesis that is responsible for the low SLP that dominates during summers with positive PC2 values (figures 5(a), S4). Wu and Francis (2019) found that the maximum Eady growth rate (baroclinicity) was significantly positive over the Arctic when PC2 was positive, suggesting an enhanced tendency for unsettled weather, while reduced baroclinicity was evident in regions with a high likelihood of heatwaves.
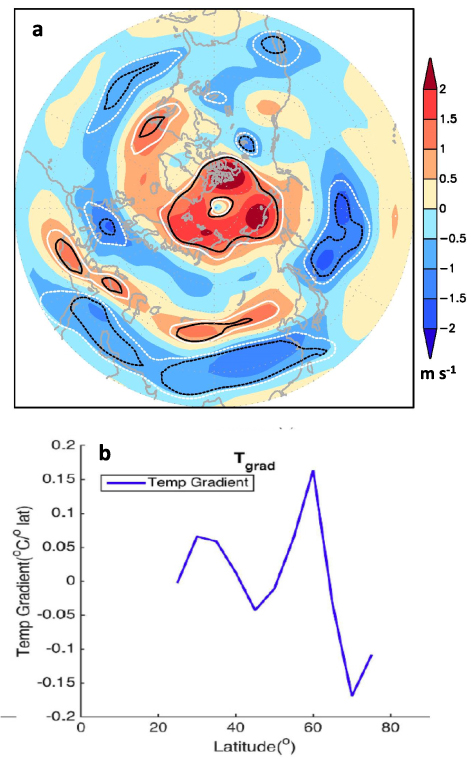
Figure 7. (a) 300 hPa zonal winds [m s−1] during summer regressed onto PC2. White and black contours denote 95% and 99% confidence levels. (b) Quasi-resonance fingerprint pattern in the poleward temperature gradient (From Mann et al 2017).
Download figure:
Standard image High-resolution image
The banded structure of the wind anomalies in figure 7(a), especially over Eurasia, is reminiscent of the QRA fingerprint identified by Mann et al (2017, 2018). Associated with this fingerprint is a double peak in the gradient of poleward temperature anomalies (figure 7(b)), which gives rise, through the thermal wind relationship, to a corresponding banding of zonal wind anomalies observed during extreme summer weather events over Eurasia (see figure 1 in Mann et al 2017). These conditions favor the occurrence of a split jet stream, with one branch located along the Arctic coastline and another through mid-latitudes. This configuration has been shown to establish a mid-latitude wave guide (Petoukhov et al 2013) that can trap high-amplitude atmospheric Rossby waves when hemispheric wavenumbers range between 6 to 8, increasing the likelihood of extreme summer weather events, including heatwaves and floods. Conditions favoring QRA appear to be occurring more frequently (Coumou et al 2014).
Over the continents, the northern zone of positive temperature anomalies may be at least partially caused by the observed recent decline in snow cover at high latitudes during late spring (figure S5). An earlier snow melt allows the underlying soil to be exposed to strong spring insolation earlier, which dries out the soil sooner and allows it to warm sooner, creating a zone of positive temperature anomaly. Amplified Arctic warming is observed to be strongest over high-latitude land areas during spring and summer (Francis and Vavrus 2012), which is consistent with earlier snow melt and contributes to a double peak in the poleward gradient of temperature anomalies.
4. Discussion and conclusions
The behavior of Arctic sea ice during recent years has perplexed the scientific community. The ice extent has attained or flirted with new record lows during winter and spring months every year since 2012, raising the specter of hitting a new minimum in September. Instead, however, the ice-loss trajectory took a sharp turn in August or early September (except in 2020), averting a broken record. Responsible for the cessation was the formation of low pressure over the region, which brings clouds, reduced insolation, and winds conducive for expanding the ice cover. The consistency of this occurrence begs the question: why is it happening?
Here we offer evidence that the dramatic negative trend in spring snow cover over high-latitude land areas—one of the most conspicuous indications of anthropogenic climate change—may be an important contributor to this behavior. The early loss of snow cover creates a belt of positive temperature anomalies that distorts the typically monotonic poleward temperature gradient by creating an additional peak. Through the thermal wind relationship, a split jet is more likely to form, favoring conditions that trap and amplify Rossby waves that have been implicated in causing extreme summer weather events over northern hemisphere continents.
The second most prominent atmospheric state (PC2) during summer is associated with similar split-jet conditions, along with continental heatwaves in Asia, Scandinavia, northern North America, and ocean heatwaves in the North Atlantic and Pacific Oceans. This pattern is also significantly correlated with strong westerly winds over the Arctic during summer, creating cyclonic conditions that favor cloudiness and reduced transport of sea ice southward through the Fram Strait into the Greenland Sea. Moreover, since 2012, this second PC has exhibited several of its highest values in the record back to 1979, while a stretch of 6 yr (2007–2012) with its lowest values was accompanied by rapid declines in sea-ice extent.
We hypothesize that these observations are connected, and while we cannot establish cause-and-effect and not every year will follow this chain of linkages, a negative feedback on the decline in sea-ice extent initiated by early spring snow-melt may provide a plausible explanation for the recent puzzling behavior of the late-summer sea-ice behavior. We note that the summers of 2019 and 2020, characterized by high values of PC1 and low values of PC2 (in contrast to most years since 2012), recorded near-record-low minimum sea-ice extent during September (Richter-Menge et al 2019; http://nsidc.org/arcticseaicenews/), suggesting that these atmospheric patterns during JJA may provide some predictive information for the annual sea-ice minimum. It should be noted that this application of EOF analysis reveals statistical relationships only, and future research will require targeted modeling experiments to verify causal mechanisms. These experiments might include comparisons of atmospheric patterns under conditions of climatological snow cover and soil moisture versus those projected for the late 21st century under continued greenhouse gas forcing. A further research opportunity could apply these atmospheric patterns to test the ability of climate models to simulate observed relationships between rates of sea-ice loss, large-scale circulation regimes, and extreme summer weather in mid-latitudes.
Acknowledgments
The authors thank three anonymous reviewers and ERL's Editorial Board for their constructive comments and suggestions that improved the manuscript. We are also grateful for research funding from the Woodwell Climate Research Center (JAF) as well as the Natural Science Foundation of China (41730959, 41790472) and the National Key Basic Research Project of China (2019YFA0607002) (BW).
Data availability statement
No new data were created or analysed in this study.