


Abstract
The relationship between tobacco smoking status and SARS-CoV-2 infection and coronavirus disease 2019 (COVID-19) severity is highly debated. We conducted a retrospective cohort study of >2.4 million adults in a large healthcare system to evaluate whether smoking is associated with SARS-CoV-2 infection and disease severity.
This retrospective cohort study of 2,427,293 adults in KPNC from March 5, 2020 (baseline) to December 31, 2020 (pre-vaccine) included smoking status (current, former, never), socio-demographics, and comorbidities from the electronic health record. SARS-CoV-2 infection (identified by a positive PCR test) and COVID-19 severity (hospitalization, ICU admission or death ≤ 30 days of COVID-19 diagnosis) were estimated in time-to-event analyses using Cox proportional hazard regression models adjusting for covariates. Secondary analyses examined COVID-19 severity among patients with COVID-19 using logistic regression.
During the study, 44,270 patients had SARS-CoV-2 infection. Current smoking was associated with lower adjusted rates of SARS-CoV-2 infection (aHR = 0.64 95% CI: 0.61–0.67), COVID-19-related hospitalization (aHR = 0.48 95% CI: 0.40–0.58), ICU admission (aHR = 0.62 95% CI: 0.42–0.87), and death (aHR = 0.52 95% CI: 0.27–0.89) than never-smoking. Former smoking was associated with a lower adjusted rate of SARS-CoV-2 infection (aHR = 0.96 95% CI: 0.94–0.99) and higher adjusted rates of hospitalization (aHR = 1.10 95% CI: 1.03–1.08) and death (aHR = 1.32 95% CI: 1.11–1.56) than never-smoking. Logistic regression analyses among patients with COVID-19 found lower odds of hospitalization for current versus never-smoking and higher odds of hospitalization and death for former versus never-smoking.
In the largest US study to date on smoking and COVID-19, current and former smoking showed lower risk of SARS-CoV-2 infection than never-smoking, while a history of smoking was associated with higher risk of severe COVID-19.
In this cohort study of 2.4 million adults, adjusting for socio-demographics and medical comorbidities, current tobacco smoking was associated with a lower risk of both SARS-CoV-2 infection and severe COVID-19 illness compared to never-smoking. A history of smoking was associated with a slightly lower risk of SARS-CoV-2 infection and a modestly higher risk of severe COVID-19 illness compared to never-smoking. The lower observed COVID-19 risk for current versus never-smoking deserves further investigation. Results support prioritizing individuals with smoking-related comorbidities for vaccine outreach and treatments as they become available.
Introduction
Tobacco smoking impairs lung immune function and upper airways and is a well-established risk factor for infectious respiratory diseases, morbidity and mortality.1–5 Whether smoking increases the risk for coronavirus disease 2019 (COVID-19), caused by a novel strain of the severe acute respiratory syndrome coronavirus 2 (SARS-CoV-2), is an important public health question. In what has been termed the “smoker’s paradox,” studies across the globe have generally found lower risk of SARS-CoV-2 infection for current versus never-smoking,6 an inverse association between smoking prevalence and the prevalence of SARS-CoV-2 infection, and a lower than expected prevalence of current smoking among patients hospitalized with COVID-19.6–11 Studies of smoking and COVID-19 severity are equivocal, with findings of greater risk of severe disease, no association, or lower disease severity risk.8,12–14
Much existing research is limited by inconsistent recording of smoking, possible misclassification, failure to differentiate former from current or never-smoking, inadequate adjustment for confounders including smoking-related comorbidities and healthcare access, inattention to potential differences in the likelihood of SARS-CoV-2 testing by smoking status, small samples, and examination of COVID-19 severity outcomes conditional on hospitalization.6,15,16 Cautioning that smoking may increase risk of SARS-CoV-2 infection and COVID-19 severity, the World Health Organization (WHO) has called for well-designed population-based studies to determine the association.17
We performed a population-based retrospective cohort study to examine the risk of SARS-CoV-2 infection, COVID-19–related hospitalization, intensive care unit (ICU) admission, and death among patients who reported current and former versus never-smoking within Kaiser Permanente Northern California (KPNC), an integrated healthcare delivery system with systematic screening for smoking status as standard care. Understanding whether smoking is associated with risk of SARS-CoV-2 infection and COVID-19 severity is crucial for informing public health strategies to mitigate risk during future outbreaks and prioritize at-risk groups for vaccination outreach, boosters, and treatments as they become available.
Methods
Setting and Study Population
KPNC is an integrated healthcare system with 21 hospital-based medical centers serving 4.4 million racially and socio-demographically diverse patients representative of Northern California.18 On March 4, 2020, California’s first COVID-19 death was announced and Governor Gavin Newsom declared a state of emergency.19 We performed a retrospective cohort study of KPNC enrollees from March 5, 2020 to December 31, 2020. Study end date was chosen based on introduction of COVID-19 vaccines that may cloud associations. Patients were aged ≥ 18, and for the year prior had continuous KPNC health plan membership (March 2019–March 2020), ≥1 in-person outpatient or inpatient nonemergency (ED) visit (to have smoking status assessed), and had nonmissing smoking status from March 5, 2018–March 5, 2020 (Figure 1). The KPNC IRB approved the project with a waiver of informed consent.
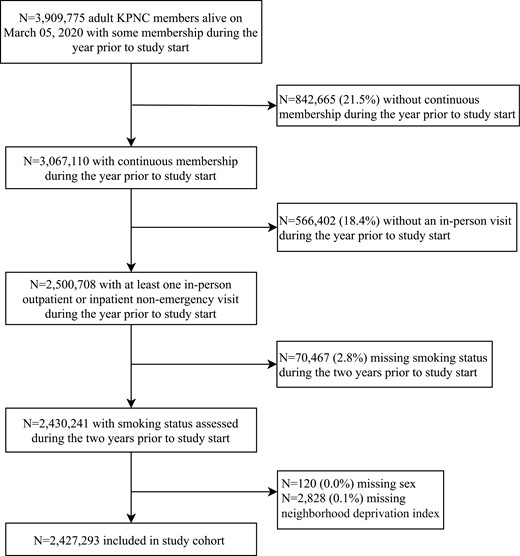
Inclusion criteria flow diagram. KPNC = Kaiser Permanente Northern California; NDI = neighborhood deprivation index.
Outcomes
Outcomes included SARS-CoV-2 infection, defined as a positive nasal/throat swab for SARS-CoV-2 by PCR, documented by KPNC (Supplementary Methods 1) and three measures of COVID-19 severity (hospitalization, ICU admission, death). Test positivity was defined as the number of positive PCR-tests divided by the number of PCR-tests performed.
For patients with positive SARS-CoV-2 tests, we extracted data on hospitalization, ICU admission, and death within 30 days of positive test. To account for patients with COVID-19 who were only tested upon admission to the hospital, we also included severity outcomes that occurred up to 5 days before the positive SARS-CoV-2 test result. Hospitalizations associated with elective surgeries (non-ED admissions), trauma (based on Health Care Utilization Project single-level diagnosis clinical classification software category numbers:166, 167, 169, 170, 173),20 and labor/delivery were excluded as unlikely to be COVID-19 related.
Exposure
Smoking status is routinely screened for during KPNC primary care visits. A prompt in the electronic health record (EHR) triggers medical assistants to assess and document smoking status (current, former, never) while taking vital signs. Ongoing education of clinicians and quarterly feedback to staff on screening rates reinforces performance.21 Smoking status was not time-varying and was defined as the most recent charted status during the 2 years before study start.
Covariates
We extracted baseline information from the most recent EHR documentation during the 2 years before study start, on age, sex, race/ethnicity, Medicaid enrollment, neighborhood deprivation index (NDI; categorized into quartiles with higher values representing greater deprivation),22 body mass index (BMI = kg/m2; underweight < 18.5, normal-18.5–24.9, overweight-25.0–29.9, obese ≥ 30.0), and medical comorbidities with COVID-19 risk (diabetes, hypertension, atherosclerotic cardiovascular disease, cardiac dysrhythmias, heart failure, renal disease, respiratory conditions [obstructive lung diseases, lung cancer, other lung conditions]) classified by ICD-10 codes (Supplementary Methods 2).
Analysis
We examined patient characteristics overall and by smoking status. We calculated unadjusted incidence rates (per 1,000 person-years) and 95% confidence intervals (CIs) of each outcome within each stratum of smoking status. As a comparison to COVID-19 related mortality, we also examined age-adjusted standardized mortality ratios (SMRs) of all-cause mortality (regardless of COVID-19) for former and current smoking status relative to never smoking status. Unadjusted and multivariable Cox proportional hazards regression analyses were used to examine the overall association between smoking status and risk of each outcome. Patients were followed from the study start (March 5, 2020) until outcome occurrence, with censoring on death, health plan disenrollment, or study end (November 30, 2020 for infection, December 31, 2020 for severity outcomes). Patients with SARS-CoV-2 infection who did not have the outcome within 30 days of their positive PCR test were censored on the 30th day following that test. Age had a nonlinear relationship with SARS-CoV-2 infection and COVID-19 severity outcomes; hence, we flexibly adjusted for age using restricted cubic splines.
Models were fit with varying levels of adjustment to understand the potential impact of confounding. Model 1 included age, sex, race/ethnicity, and medical service area. Model 2 added Medicaid status and NDI quartiles. Model 3 (fully adjusted model) added BMI, hypertension, atherosclerotic cardiovascular disease, heart failure, dysrhythmias, renal disease, and diabetes. Our fully adjusted models did not adjust for smoking-related respiratory conditions (eg, lung cancer), because they could be mediators rather than confounders (Table 1). Extended models (Model 4) included these, and results yield the independent effect of smoking not dependent on potential casual pathways through co-occurring respiratory conditions.
Baseline Characteristics of KPNC members, Overall and by Smoking Status.
| Characteristics | Smoking Status | |||
|---|---|---|---|---|
| Overall | Never | Current | Former | |
| (N = 2,427,293) | (N = 1,739,938) (71.7%) | (N = 145,888) (6.0%) | (N = 541,467) (22.3%) | |
| Age, years | ||||
| Mean (SD) | 51.1 (18.2) | 48.9 (18.1) | 49.0 (15.9) | 59.0 (17.2) |
| Sex, n (%) | ||||
| Female | 1,377,313 (56.7) | 1,061,602 (61.0) | 59,345 (40.7) | 256,366 (47.3) |
| Male | 1,049,980 (43.3) | 678,336 (39.0) | 86,543 (59.3) | 285,101 (52.7) |
| Race/ethnicity, n (%) | ||||
| Non-Hispanic White | 1,146,266 (47.2) | 754,461 (43.4) | 72,271 (49.5) | 319,534 (59.0) |
| Asian/Pacific Islander | 511,715 (21.1) | 411,189 (23.6) | 24,600 (16.9) | 75,926 (14.0) |
| Hispanic | 485,349 (20.0) | 373,358 (21.5) | 25,210 (17.3) | 86,781 (16.0) |
| Non-Hispanic Black | 166,575 (6.9) | 113,808 (6.5) | 15,492 (10.6) | 37,275 (6.9) |
| Other/Unknown | 117,388 (4.8) | 87,122 (5.0) | 8315 (5.7) | 21,951 (4.1) |
| Medicaid insurance, n (%) | 124,851 (5.1) | 87,951 (5.1) | 11,619 (8.0) | 25,281 (4.7) |
| NDI 2018 quartiles, n (%) | ||||
| Quartile 1 (least deprived) | 606,346 (25.0) | 457,152 (26.3) | 23,790 (16.3) | 125,404 (23.2) |
| Quartile 2 | 607,386 (25.0) | 435,332 (25.0) | 32,155 (22.0) | 139,899 (25.8) |
| Quartile 3 | 606,828 (25.0) | 425,348 (24.4) | 40,059 (27.5) | 141,421 (26.1) |
| Quartile 4 (most deprived) | 606,733 (25.0) | 422,106 (24.3) | 49,884 (34.2) | 134,743 (24.9) |
| BMI category, n (%) | ||||
| Underweight (<18.5 kg/m2) | 33,144 (1.4) | 24,954 (1.4) | 2715 (1.9) | 5475 (1.0) |
| Normal (18.5–24.9 kg/m2) | 722,357 (29.7) | 551,525 (31.7) | 40,280 (27.6) | 130,552 (24.1) |
| Overweight (25.0–29.9 kg/m2) | 807,484 (33.3) | 570,911 (32.8) | 47,628 (32.6) | 188,945 (34.9) |
| Obese (≥30.0 kg/m2) | 806,757 (33.2) | 547,731 (31.5) | 50,350 (34.5) | 208,676 (38.5) |
| Missing | 57,551 (2.4) | 44,817 (2.6) | 4915 (3.4) | 7819 (1.4) |
| Any cardiovascular condition, n (%) | 932,877 (38.4) | 572,154 (32.9) | 57,528 (39.4) | 303,195 (56.0) |
| Atherosclerotic cardiovascular disease, n (%) | 500,044 (20.6) | 270,587 (15.6) | 31,436 (21.5) | 198,021 (36.6) |
| Cardiac dysrhythmias, n (%) | 126,218 (5.2) | 70,278 (4.0) | 4837 (3.3) | 51,103 (9.4) |
| Heart failure, n (%) | 71,236 (2.9) | 35,424 (2.0) | 3387 (2.3) | 32,425 (6.0) |
| Hypertension, n (%) | 761,693 (31.4) | 471,451 (27.1) | 45,324 (31.1) | 244,918 (45.2) |
| Diabetes, n (%) | 345,974 (14.3) | 214,679 (12.3) | 21,237 (14.6) | 110,058 (20.3) |
| Renal disease, n (%) | 173,800 (7.2) | 98,252 (5.6) | 7574 (5.2) | 67,974 (12.6) |
| Any respiratory condition, n (%) | 538,370 (22.2) | 342,783 (19.7) | 35,743 (24.5) | 159,844 (29.5) |
| Obstructive lung disease, n (%) | 415,214 (17.1) | 257,946 (14.8) | 29,448 (20.2) | 127,820 (23.6) |
| Lung cancer, n (%) | 10,157 (0.4) | 4326 (0.2) | 613 (0.4) | 5218 (1.0) |
| Other lung diseases, n (%) | 183,389 (7.6) | 116,091 (6.7) | 10,943 (7.5) | 56,355 (10.4) |
BMI = body mass index; NDI = Neighborhood Deprivation Index; SD = standard deviation.
Note: Percentages may not add to 100 due to rounding.
We evaluated whether smoking status satisfied the Cox proportional hazards assumption by testing whether an interaction term between smoking and log time was significantly different from zero in the fully adjusted model.
In sensitivity analyses, we used frequency-matching by age to randomly select a subgroup of current smokers who resembled former smokers in their age and medical comorbidities, and we repeated the fully adjusted models using this subgroup of current smokers. We also conducted sensitivity analyses to evaluate the potential impact of unmeasured confounding on our results by computing the e-values for all fully adjusted models.23,24
Secondary analyses modeled COVID-19 severity only among patients with PCR-confirmed COVID-19, for comparability with prior published studies limited to patients with COVID-19. We calculated the unadjusted prevalence and 95% CIs of each outcome and ran multivariable logistic regression analyses to examine smoking-severity associations. Age had a nonlinear relationship with hospitalization and ICU and was flexibly adjusted for using restricted cubic splines.
Analyses were conducted using SAS software, v9.4. Statistical significance was assessed at two-sided p < .05.
Results
Of 2,430,241 KPNC members meeting inclusion criteria, we excluded n = 120 (0.0%) missing sex and n = 2,828 (0.1%) missing NDI for a final sample of 2,427,293 (Figure 1). The sample’s smoking status was 6.0% current, 22.7% former, and 71.3% never (Table 1). The sample had a median (interquartile range) of 112 (38–223) days since the most recently recorded smoking status at study start. Smoking status was assessed within 1 year of study start for 94.2% of patients who self-reported current smoking, 95.1% who self-reported a history of smoking, and 93.0% who self-reported never-smoking. Baseline socio-demographics and comorbidities differed by smoking status. Compared to current and never-smoking, former smoking was associated with having more comorbidities, older age, obesity, and being non-Hispanic White. Current and former smoking was more likely among males than females. Current smoking, compared to never- and former smoking, was associated with being in the most deprived quartile of NDI. During the study, membership was stable, with only 126,920 (5.2%) of patients censored for disenrollment.
Testing and Positivity Rate
Overall, 618,283 patients (25.5%) were tested for SARS-CoV-2 infection (24.7% of current, 28.1% of former, and 24.6% of never-smokers). The mean (1.4, SD = 1.0) and median (1.0, IQR = 1.0–2.0) number of tests per patient was the same across smoking categories. Test positivity rates by smoking status were 3.8% for current, 4.2% for former, and 5.9% for never-smoking.
Infection
Current smoking was associated with a lower incidence of SARS-CoV-2 infection (17.76/1000 person-years) than never-smoking (27.08/1000 person-years) and former smoking (22.27/1000 person-years) (Table 2). In unadjusted analyses, current smoking was associated with lower rates of infection compared to never-smoking (hazard ratio [HR] = 0.66 95% CI: 0.63–0.69; Table 2). The results changed minimally in the fully adjusted model that included sociodemographic characteristics and comorbidities (adjusted hazard ratio [aHR] = 0.64 95% CI: 0.61–0.67) and in the extended model that included respiratory conditions (aHR = 0.64 95% CI: 0.61–0.67) (Table 2).
Cox Proportional Hazard Regression Results for Risk of SARS-CoV-2 Infection and COVID-19 Outcomes Among KPNC Members, by Smoking Status (N = 2,427,293).
| Smoking Status | Never | Current | Former |
|---|---|---|---|
| N (row %) | 1,739,938 (71.3%) | 145,888 (6.0%) | 541,467 (22.7%) |
| SARS-CoV-2 infection | |||
| N events (row %) | 33,791 (76.3%) | 1836 (4.1%) | 8643 (19.5%) |
| Incidence rate* (95% CI) | 27.08 (27.07, 27.09) | 17.76 (17.74, 17.79) | 22.27 (22.25, 22.28) |
| Unadjusted, HR (95% CI) | 1.00 (ref) | 0.66 (0.63, 0.69) | 0.82 (0.80, 0.84) |
| Model 1, aHR (95% CI) | 1.00 (ref) | 0.67 (0.64, 0.71) | 1.03 (1.00, 1.05) |
| Model 2, aHR (95% CI) | 1.00 (ref) | 0.64 (0.61, 0.67) | 1.00 (0.98, 1.03) |
| Model 3, aHR (95% CI) | 1.00 (ref) | 0.64 (0.61, 0.67) | 0.96 (0.94, 0.99) |
| Model 4, aHR (95% CI) | 1.00 (ref) | 0.64 (0.61, 0.67) | 0.96 (0.93, 0.98) |
| Hospitalization | |||
| N events (row %) | 2540 (63.3%) | 112 (2.8%) | 1362 (33.9%) |
| Incidence rate* (95% CI) | 1.82 (1.82, 1.82) | 0.97 (0.97, 0.98) | 3.14 (3.14, 3.15) |
| Unadjusted, HR (95% CI) | 1.00 (ref) | 0.54 (0.44, 0.64) | 1.73 (1.62, 1.84) |
| Model 1, aHR (95% CI) | 1.00 (ref) | 0.53 (0.44, 0.64) | 1.31 (1.22, 1.40) |
| Model 2, aHR (95% CI) | 1.00 (ref) | 0.48 (0.40, 0.58) | 1.27 (1.18, 1.36) |
| Model 3, aHR (95% CI) | 1.00 (ref) | 0.48 (0.40, 0.58) | 1.10 (1.03, 1.18) |
| Model 4, aHR (95% CI) | 1.00 (ref) | 0.47 (0.38, 0.56) | 1.07 (1.00, 1.15) |
| ICU Admission | |||
| N events (row %) | 520 (59.8%) | 32 (3.7%) | 317 (36.5%) |
| Incidence rate* (95% CI) | 0.37 (0.37, 0.37) | 0.28 (0.27, 0.28) | 0.73 (0.73, 0.73) |
| Unadjusted, HR (95% CI) | 1.00 (ref) | 0.75 (0.51, 1.05) | 1.96 (1.71, 2.25) |
| Model 1, aHR (95% CI) | 1.00 (ref) | 0.69 (0.47, 0.97) | 1.41 (1.22, 1.63) |
| Model 2, aHR (95% CI) | 1.00 (ref) | 0.61 (0.42, 0.86) | 1.36 (1.17, 1.57) |
| Model 3, aHR (95% CI) | 1.00 (ref) | 0.62 (0.42, 0.87) | 1.11 (0.96, 1.29) |
| Model 4, aHR (95% CI) | 1.00 (ref) | 0.60 (0.41, 0.84) | 1.09 (0.94, 1.27) |
| Death | |||
| N events (row %) | 308 (50.2%) | 12 (1.9%) | 294 (47.9%) |
| Incidence rate* (95% CI) | 0.31 (0.31, 0.32) | 0.15 (0.15, 0.16) | 0.87 (0.87, 0.87) |
| Unadjusted, HR (95% CI) | 1.00 (ref) | 0.47 (0.25, 0.80) | 3.07 (2.62, 3.61) |
| Model 1, aHR (95% CI) | 1.00 (ref) | 0.60 (0.31, 1.01) | 1.57 (1.33, 1.85) |
| Model 2, aHR (95% CI) | 1.00 (ref) | 0.56 (0.30, 0.96) | 1.56 (1.32, 1.84) |
| Model 3, aHR (95% CI) | 1.00 (ref) | 0.52 (0.27, 0.89) | 1.32 (1.11, 1.56) |
| Model 4, aHR (95% CI) | 1.00 (ref) | 0.49 (0.26, 0.84) | 1.27 (1.07, 1.50) |
Notes: aHR = adjusted hazard ratio; BMI = body mass index; CI = confidence interval; HR = hazard ratio; NDI = neighborhood deprivation index; Bold = significant at p < .05 (results of 1.00 in bold are > 1 at the thousandth decimal place). Missing BMI (n = 57,551, 2.4%) was included as a category in all analyses.
Incidence rate per 1,000 person-years.
Model 1: age, sex, race, service area.
Model 2: age, sex, race, service area, Medicaid, NDI.
Model 3 (fully adjusted): age, sex, race, service area, Medicaid, NDI, BMI, hypertension, atherosclerotic cardiovascular disease, heart failure, dysrhythmias, renal disease, diabetes.
Model 4 (extended model): age, sex, race, service area, Medicaid, NDI, BMI, hypertension, atherosclerotic cardiovascular disease, heart failure, dysrhythmias, renal disease, diabetes, any respiratory condition.
Former smoking was associated with a lower SARS-CoV-2 infection rate compared to never-smoking in unadjusted analyses (HR = 0.82 95% CI: 0.80–0.84) (Table 2). However, most of this was explained by confounders, and risk of SARS-CoV-2 infection was only slightly lower for former versus never-smoking in the fully adjusted (aHR = 0.96 95% CI: 0.94–0.99) and extended models (aHR = 0.96 95% CI: 0.93–0.98).
Severity
The prevalence of severe COVID-19 outcomes was 0.17% hospitalization, 0.04% ICU admission, and 0.03% death. Current smoking was less prevalent among patients with severe COVID-19 outcomes (hospitalization, 2.8%, ICU, 3.7%, death, 1.9%) than in the full cohort (6.0%) (Table 2). In contrast to COVID-19 related mortality, there was a higher incidence of age-standardized all-cause mortality related to current-smoking (standardized mortality ratio [SMR] = 2.09 95% CI: 1.96–2.22) and former (SMR = 1.66 95% CI: 1.63–1.70) relative to never-smoking.
Current smoking was associated with lower unadjusted rates of hospitalization (HR = 0.54, 95% CI: 0.44–0.64) than never-smoking (Table 2). Associations were slightly stronger in the fully adjusted (aHR = 0.48 95% CI: 0.40–0.58) and extended models (aHR = 0.47 95% CI: 0.38–0.56). The unadjusted ICU admission rate did not differ for current versus never-smoking (HR = 0.75 95% CI: 0.51–1.05). However, current smoking was associated with a lower ICU admission rate than never-smoking in the fully adjusted (aHR = 0.62 95% CI: 0.42–0.87) and extended models (aHR = 0.60 95% CI: 0.41–0.84). Relative to never-smoking, current smoking was associated with a lower risk of death in unadjusted (HR = 0.47 95% CI: 0.25–0.80), fully adjusted (aHR = 0.52 95% CI: 0.27–0.89), and extended models (aHR = 0.49 95% CI: 0.26–0.84).
Former smoking was more prevalent among patients with severe COVID-19 (hospitalization: 33.9%, ICU: 36.5%, mortality: 47.9%) than in the full cohort (22.7%) (Table 2). Former (vs. never) smoking was associated with higher unadjusted rates of hospitalization (HR = 1.73 95% CI: 1.62–1.84) (Table 2), which were attenuated in the fully adjusted (aHR = 1.10 95% CI: 1.03–1.18) and extended models (aHR = 1.07 95% CI: 1.00–1.15). The ICU admission rate was higher for former than never-smoking in the unadjusted model (HR = 1.96 95% CI: 1.71–2.25), but no differences remained in fully adjusted (aHR = 1.11 95% CI: 0.96–1.29) and extended models (aHR = 1.09 95% CI: 0.94–1.27). For ICU severity, there was violation of the proportional hazards assumption for former smoking (p < .02). This means that the association between former smoking and ICU admission changes over time and should be interpreted as the average effect over the study period (Supplementary Table S1). Former (vs. never) smoking was associated with a higher unadjusted risk of death (HR = 3.07 95% CI: 2.62–3.61), which was somewhat attenuated in fully adjusted (aHR = 1.32 95% CI: 1.11–1.56) and extended models (aHR = 1.27 95% CI: 1.07–1.50).
Matched Sensitivity Analysis
In the subset of patients with current smoking status who were age-matched to those with former smoking status, those with current and former smoking status had similar sociodemographic characteristics and comorbidities (Supplementary Table S2). In fully adjusted models using this subset of patients with current smoking status, the pattern of results was very similar to results from the primary analyses: current smoking was associated with lower rates of infection (aHR = 0.62 95% CI: 0.57–0.67), lower rates of hospitalization (aHR = 0.54, 95% CI: 0.42–0.69), lower rates of ICU admission (aHR = 0.51, 95% CI: 0.30–0.87), and nonsignificantly lower rates of death (aHR = 0.57, 95% CI: 0.30–1.08) compared to never-smoking.
E-Value Sensitivity Analyses for Unmeasured Confounding
E-values for the aHRs for current smoking status ranged from 2.51 to 3.55, meaning that an unmeasured confounder would need to have associations of at least that magnitude with both the exposure and the outcome to fully explain reported associations between current smoking and risk of SARS-CoV-2 outcomes (Supplementary Table S3).
Analyses among Patients with COVID-19
In analyses restricted to the 44,270 patients with PCR-confirmed COVID-19 (Supplementary Table S4), current (vs. never) smoking was associated with lower odds of hospitalization in unadjusted (odds ratio [OR] = 0.80 95% CI: 0.66–0.97), fully adjusted (aOR = 0.79 95% CI: 0.64–0.98) and extended (aOR = 0.78 95% CI: 0.63–0.96) models (Table 3). Odds of ICU admission or death did not differ for the comparison of current versus never-smoking.
Logistic Regression Results for the Odds of COVID-19 Severity Outcomes by Smoking Status, Among KPNC Members with PCR-Confirmed COVID-19 (N = 44,270).
| Smoking Status | Never | Current | Former |
|---|---|---|---|
| N | 33,791 | 1836 | 8643 |
| Hospitalization | |||
| Prevalence (95% CI)* | 75 (72, 78) | 61 (50, 72) | 158 (150, 165) |
| Unadjusted, OR (95% CI) | 1.00 (ref) | 0.80 (0.66, 0.97) | 2.30 (2.14, 2.47) |
| Model 1, aOR (95% CI) | 1.00 (ref) | 0.82 (0.67, 1.01) | 1.26 (1.17, 1.37) |
| Model 2, aOR (95% CI) | 1.00 (ref) | 0.80 (0.65, 0.98) | 1.25 (1.15, 1.35) |
| Model 3, aOR (95% CI) | 1.00 (ref) | 0.79 (0.64, 0.98) | 1.12 (1.03, 1.21) |
| Model 4, aOR (95% CI) | 1.00 (ref) | 0.78 (0.63, 0.96) | 1.10 (1.01, 1.19) |
| ICU admission | |||
| Prevalence (95% CI)* | 15 (14, 17) | 17 (12, 24) | 37 (33, 41) |
| Unadjusted, OR (95% CI) | 1.00 (ref) | 1.13 (0.79, 1.63) | 2.44 (2.12, 2.81) |
| Model 1, aOR (95% CI) | 1.00 (ref) | 1.13 (0.78, 1.63) | 1.30 (1.12, 1.52) |
| Model 2, aOR (95% CI) | 1.00 (ref) | 1.09 (0.76, 1.58) | 1.28 (1.10, 1.49) |
| Model 3, aOR (95% CI) | 1.00 (ref) | 1.10 (0.76, 1.60) | 1.10 (0.94, 1.29) |
| Model 4, aOR (95% CI) | 1.00 (ref) | 1.09 (0.75, 1.59) | 1.09 (0.94, 1.28) |
| Death | |||
| Prevalence (95% CI)* | 9 (8, 10) | 6 (4, 11) | 34 (30, 38) |
| Unadjusted, OR (95% CI) | 1.00 (ref) | 0.72 (0.40, 1.28) | 3.83 (3.26, 4.50) |
| Model 1, aOR (95% CI) | 1.00 (ref) | 0.95 (0.52, 1.73) | 1.43 (1.19, 1.72) |
| Model 2, aOR (95% CI) | 1.00 (ref) | 0.95 (0.52, 1.73) | 1.44 (1.20, 1.73) |
| Model 3, aOR (95% CI) | 1.00 (ref) | 0.85 (0.46, 1.58) | 1.25 (1.04, 1.51) |
| Model 4, aOR (95% CI) | 1.00 (ref) | 0.84 (0.45, 1.56) | 1.24 (1.03, 1.49) |
Notes: aOR = adjusted odds ratio; BMI = body mass index; CI = confidence interval; NDI = neighborhood deprivation index; OR = odds ratio; Bold = significant at p < .05. Missing BMI (n = 817, 1.8%) was included as a category in all analyses.
Prevalence per 1,000 persons.
Model 1: age, sex, race, service area.
Model 2: age, sex, race, service area, Medicaid, NDI.
Model 3 (fully adjusted): age, sex, race, service area, Medicaid, NDI, BMI, hypertension, atherosclerotic cardiovascular disease, heart failure, dysrhythmias, renal disease, diabetes.
Model 4 (extended model): age, sex, race, service area, Medicaid, NDI, BMI, hypertension, atherosclerotic cardiovascular disease, heart failure, dysrhythmias, renal disease, diabetes, any respiratory condition.
Former (vs. never) smoking was associated with elevated unadjusted odds of hospitalization (OR = 2.30 95% CI: 2.14–2.47), which remained slightly higher in fully adjusted (aOR = 1.12 95% CI: 1.03–1.21) and extended models (aOR = 1.10 95% CI: 1.01–1.19). Former (vs. never) smoking was associated with elevated unadjusted odds of ICU admission (OR = 2.44 95% CI: 2.12–2.81), that were no longer statistically significant in fully adjusted (aOR = 1.10 95% CI: 0.94–1.29) or extended models (aOR = 1.09 95% CI: 0.94–1.28). Finally, former (vs. never) smoking was associated with higher unadjusted odds of death (OR = 3.83 95% CI: 3.26–4.50), which was attenuated in fully adjusted (aOR = 1.25 95% CI: 1.04–1.51) and extended models (aOR = 1.24 95% CI: 1.03–1.49).
Discussion
In a large healthcare delivery system with universal smoking status screening, current smoking was associated with lower risk of SARS-CoV-2 infection, COVID-19 related hospitalization, ICU admission and death relative to never-smoking. In contrast, former versus never-smoking was associated with a lower risk of SARS-CoV-2 infection but slightly greater risk of severe COVID-19.
Our finding of lower risk of SARS-CoV-2 infection for current versus never-smoking is consistent with a meta-analysis of 13 studies concluding that current smoking was associated with a reduced risk of testing positive for SARS-CoV-2 (risk ratio [RR] = 0.74, 95% CI: 0.58–0.93).6 The meta-analysis, however, reported no difference for former versus never-smoking. A national matched case–control study from Korea found that current (OR = 0.33, 95% CI: 0.28–0.38) and former smoking (OR = 0.81, 95% CI: 0.72–0.91) was associated with a lower odds of SARS-CoV-2 infection than never-smoking.25 Data from 38 European countries found that after covariate adjustment, smoking prevalence was inversely related to SARS-CoV-2 infection.26 Further evidence comes from a cohort study of an aircraft carrier crew exposed to SARS-CoV-2 while at sea.27 Current smoking was associated with a lower odds of SARS-CoV-2 infection (OR = 0.64, 95% CI: 0.49–0.84), with even lower odds for those smoking more heavily; however, there were no difference for former versus never-smoking. A cross-sectional national web-based Italian survey found half the odds of SARS-CoV-2 infection for those reporting current versus nonsmoking, with the odds of SARS-CoV-2 infection decreasing as heaviness of smoking increased.28 Finally, similar to evidence from hospitalized COVID-19 cases across multiple countries,11,29,30 current smoking prevalence in our study was lower among patients with severe COVID-19 compared to the cohort overall.
Prior studies have speculated that people who smoke may be more likely to get tested for COVID-19 when asymptomatic (eg, due to Centers for Disease Control and Prevention [CDC] guidance characterizing them as at-risk) or due to smoking-related symptoms mimicking COVID-19 symptomatology (eg, cough), increasing their percentage of negative tests. While we are unable to directly test this, it is reassuring that in our study, COVID testing prevalence was comparable by patient smoking status (24.7% current, 28.1% former, and 24.6% never-smoking) and with a similar number of tests, on average.
Notably, current smoking was associated with a reduced risk of hospitalization, ICU admission, and death relative to never-smoking. Adjustment for covariates had little influence on the strength of these findings suggesting that current smoking is independently associated with lower COVID-19 risk. Our results restricted to those with a positive SARS-CoV-2 test allow us to understand whether severity risk is partially explained by differences in infection risk. In these analyses, current versus never-smoking was only associated with lower hospitalization odds, suggesting lower risk of ICU admission and death for current smoking might be partly explained by a lower risk of infection. Findings are consistent with a large UK study that found smoking was associated with a reduced odds of COVID-19 death (OR 0.88).31 Conversely, data from patients with COVID-19 and smoking history within the Cleveland Clinic32 found that more pack-years of smoking was associated with more severe COVID-19, which was attenuated after adjusting for comorbidities. However, current and former smoking status was combined and results are likely driven by former smokers (representing 84% of those with pack years in the analysis).
Researchers have hypothesized that nicotine may offer protection against COVID-19 due to its anti-inflammatory properties and interactions between nicotinic acetylcholine receptors (nAChR) and SARS-CoV-2.15,33–35 SARS-CoV-2 is a nicotinic agent and nicotine may play an indirect role in lowering risk of SARS-CoV-2 infection by binding to ACE2 cell-membrane protein making it harder for SARS-CoV-2 to bind to it.15,36 Furthermore, nicotine is an agonist of the cholinergic anti-inflammatory path and nicotine and other nicotinic acetylcholine receptor agonists may have therapeutic benefits by promoting inflammatory control8 and interfering with the cytokine storm hyperactive immune response that can attack the body’s tissues and lead to more severe COVID-19 outcomes. Research is needed to investigate whether nicotinic agents (eg, nicotine replacement therapy) could offer protection against SARS-CoV-2 infection or severe disease,6,33–35 and trials are being conducted in France.37 Future studies are needed to examine other potential mechanisms (eg, differences in social distancing or other protective behaviors among current versus never-smokers).
In contrast, former smoking was associated with higher unadjusted rates of severe COVID-19, which were greatly attenuated for hospitalization and death, and no longer significant for ICU admission, adjusting for socio-demographics and smoking-related comorbidities. This suggests that the elevated risk of former smoking status may be partially due to the higher prevalence of tobacco-related comorbidities as well as older age, male sex, and obesity. Severity results for former smoking status were similar in models that used the entire cohort and patients with SARS-CoV-2 infection, suggesting that risk of severe COVID-19 was not explained by differences in infection risk. Results are consistent with prior systematic reviews and meta-analyses reporting greater risk of severe COVID-19 among former versus never-smokers.6,12,38,39 These findings also highlight the importance of separating current from former smoking when evaluating COVID-19 severity, as studies that combine the two together32 may overlook important differences in risk. Results suggest that smoking-related comorbidities place individuals at risk for more severe COVID-19 outcomes and support prioritizing those with smoking-related comorbidities for vaccine boosters and future treatments.
Notably, current smokers in our sample more closely resembled never-smokers than former smokers in terms of their younger age and fewer comorbidities. This is consistent with 2020 data from the California Health Interview Survey40 indicating that adults in Northern California who used to smoke and quit (former smokers) are older and have more comorbidities (eg, diabetes, heart disease, high blood pressure) than those who never smoked, while those who smoke currently tend to be younger and have rates of comorbidities in between that of current and former smokers. People tend to quit smoking as they get older and experience more smoking-related health issues. However, the lower risk associated with current versus never smoking remained in our sensitivity analyses that were limited to the subset of current smokers who resembled former smokers on socio-demographics and comorbidities.
Our study has several limitations. Our cohort was limited to KPNC patients with at least one in-person healthcare visit in the past year. Findings may not generalize to patients who did not interact with the healthcare system or to individuals in other states or countries where smoking prevalence remains high into older ages. Smoking status was based on the most recent self-report in the 2 years prior to the pandemic. While 93.6% had smoking status charted in the year before COVID-19, smoking changes during the pandemic are not reflected. We are unable to calculate amount of time since a patient’s smoking status changed to current or former smoking and patients may misreport their smoking and be misclassified. However, studies support the validity of EHR-based smoking status data.41–43 Data on pack-years, heaviness of smoking, and cannabis smoking are not available. Large studies with these data are needed. SARS-CoV-2 testing was limited to tests recorded by KPNC. Testing was not universal and we do not have data on why patients were tested or whether they were symptomatic at the time of testing. Finally, while we adjusted for many confounders, some possible confounders were missed, such as essential worker designation.
Our study has important strengths. First, it is now recognized that nonrepresentative sampling (eg, hospitalized patients, people tested for active infection, voluntary participants) in many observational studies of risk factors for COVID-19 can lead to collider bias distorting true associations between risk factors and outcomes.44 A unique strength of our study is the inclusion of a large defined cohort of patients at-risk for COVID-19 within a closed healthcare system followed from testing and infection to death. Since all patients were insured, results are unlikely due to variations in access to care. Our retrospective cohort study design properly estimates risk over time, making it more rigorous than convenience sample studies. Furthermore, the semiparametric Cox proportional hazards model flexibly allows the underlying baseline risk to vary over the study period, accounting for changes in risk/exposure as the pandemic unfolded. By assessing smoking status during standard care pre-pandemic, our smoking data do not reflect short-term changes resulting from infection (eg, if smokers with severe COVID-19 consequently quit smoking and report former smoking status).6 The small percentage missing smoking status was excluded rather than included with never-smoking, reducing the likelihood of misclassification.15
Results provide an important counterpoint to the narrative of public health organizations. The WHO cautioned that smoking may increase risk and severity of COVID-19, and the CDC warned that smoking increases the risk for more severe COVID-19 illness.17,45 Furthermore, some states prioritized people who smoke for COVID-19 vaccinations due to concerns about more severe COVID-19.46–48 Our findings indicate current smoking is not associated with greater risk of infection or severe illness. Results do not support using current smoking status to prioritize vaccination outreach or future treatments. However, the elevated rates of tobacco-related comorbidities observed among those who had quit smoking speaks to the importance of early intervention for preventing comorbidities. Importantly, the data here reflect health outcomes observed for the population at large and do not predict the outcome for any individual patient in relation to his or her smoking behavior and COVID-19 recovery. Thus, these findings are not meant to suggest that someone who smokes during the pandemic should delay quitting because they are likely to fare better if they get COVID-19 than if they had quit smoking.
It is critical to note that tobacco smoking remains the leading cause of preventable morbidity and mortality in the US and globally5,49,50 and there are many important reasons for quitting smoking for health. In our sample, there was a higher age-standardized incidence of all-cause mortality associated with current versus never-smoking. Smoking-related medical conditions45,51 are well-established risk factors, and a history of smoking was associated with worse COVID-19 severity. Healthcare providers should continue to identify and document smoking and support patients to quit. When the substantial toll of the pandemic on healthcare systems and communities starts to wane, the multidecades-long harms of smoking experienced in disease and death will persist and warrant consistent clinical attention and intervention.52–54
Supplementary Material
A Contributorship Form detailing each author’s specific involvement with this content, as well as any supplementary data, are available online at https://academic.oup.com/ntr.
Funding
This study was supported by grants from the Tobacco-Related Disease Research Program (grant numbers R00RG2609 and R01RG3724) and a NIH National Institute on Drug Abuse (NIDA) K01 Award (DA043604). The funding organizations had no role in the design and conduct of the study; collection, management, analysis, and interpretation of the data; preparation, review, or approval of the manuscript; or decision to submit the manuscript for publication.
Acknowledgments
We acknowledge with appreciation Neal Benowitz, MD, at the University of California, San Francisco, for his consultation on study findings with consideration of possible biological mechanisms and interpretation within the context of emerging evidence. We acknowledge Agatha Hinman, BA, for her editorial assistance.
Declaration of Interests
Judith J. Prochaska, PhD, MPH, has provided consultation to pharmaceutical and technology companies that make medications and other treatments for quitting smoking and has served as an expert witness in lawsuits against the tobacco companies. All other authors declare no conflict of interest.
Data Availability
The data underlying this article cannot be shared publicly as we do not have permission from patients to share their data outside of the Kaiser Permanente Northern California healthcare system.
References

Comments