Domestic Energy Collection System is an open source monitoring system designed to collect single appliance and main level energy data of domestic homes for ILM and NILM related research. Households send data each hour to a central server over an encrypted internet connection where the electricity data can be visualized and accessed in a central PostgreSQL database. This system was used to collect the DEDDIAG dataset, which is available for download:
- Scientific Publication: Nature Scientific Data
- Dataset Download: Figshare
The collection system was built with a focus on recording data for a user behaviour change scenario such as Real-Time-Pricing (RTP). Therefore, the focus lies on recording appliances with the following properties: • easily shiftable load, • significant energy consumption, • standard power plug.
Home-/Client-Side
The client software is available on GitHub at bbox
The hardware components used for each home are:
- computer: Raspberry Pi 3 Model B with 32GB storage,
- WiFi Access-Point: TP-Link TL-WR802N,
- individual appliance meter: TP-Link SmartPlug HS110,
- whole-house meter: ABB B23 112-100 + MAX485 module, 5V DC power supply.
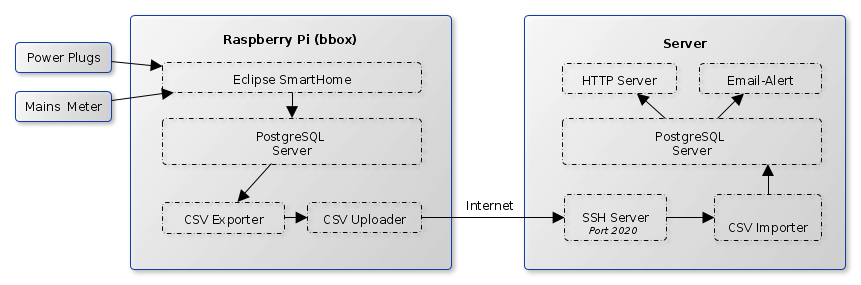
For the on-premise computer a Raspberry Pi 3 Model B with 32GB storage was used. It offers WiFi, Ethernet and GPIOs for Modbus communication with a whole-house meter at very low cost. In cases where a whole-house meter was installed, a DIN rail 3a casing was used to mount the Pi next to the meter as the read out using Modbus requires a cable connection. The full system was pre-configured in our lab, which reduced the steps required for installation by the residents in each home to: Plug in individual appliance meters and Raspberry Pi, and connect the Access-Point to a local router. This also allowed us to ship the system as a package without requiring an electrician when only appliance data was collected (i. e., no whole-house meter installed).
The computer is running Hypriot OS, a slim operating system with the main focus on Docker container support. We made use of the Eclipse Smarthome 4 system for collecting and persisting the data locally into a PostgreSQL database. The appliance meters are read over the wireless network every second, where the timestamp is added at receiving time of the value from the meter, thus introducing a reading latency equivalent to response time of device plus network latency. The system time is set using the NTP protocol. In order to keep the 1 Hz rate, the next value reading request will take this latency into account. Readings are persisted only on value change to minimize storage space. Additionally, one value is always stored at the full hour in order to detect connectivity problems.
Each hour the new data is exported into a CSV file and uploaded to central server using SSH with key authentication. In order to identify incomplete uploads on server side, the SHA checksum was used as a filename and checked before import on the server side.
Server-Side
The server software is available on GitHub at energy-server
The server side provides three main functionalities: Data storage including secure upload, visualization, provide software updates, and monitoring. For data storage a PostgreSQL 2 database is used, an open source relational database that provides a rich set of query functionality. The measurements of all homes and appliances are stored in a single table. In the following, all measurement sources, i. e. appliance or smart-meter phase, are called item. Each item is identified by a unique ID, that is assigned on first upload of measurements to the server. All measurements are stored into a database scheme as shown in Fig. 2, where all measurements are stored in a single table with a foreign-key to an items table. The items table contains the assigned unique ID as well as meta data such as item name and which household it is installed in. An alarm system was implemented that informs the residents in case there was no new data uploaded within the last 6 hours.
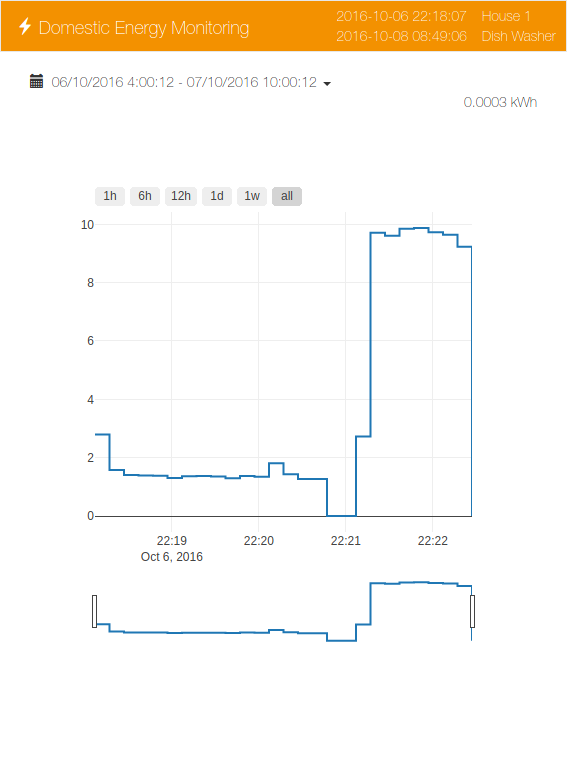
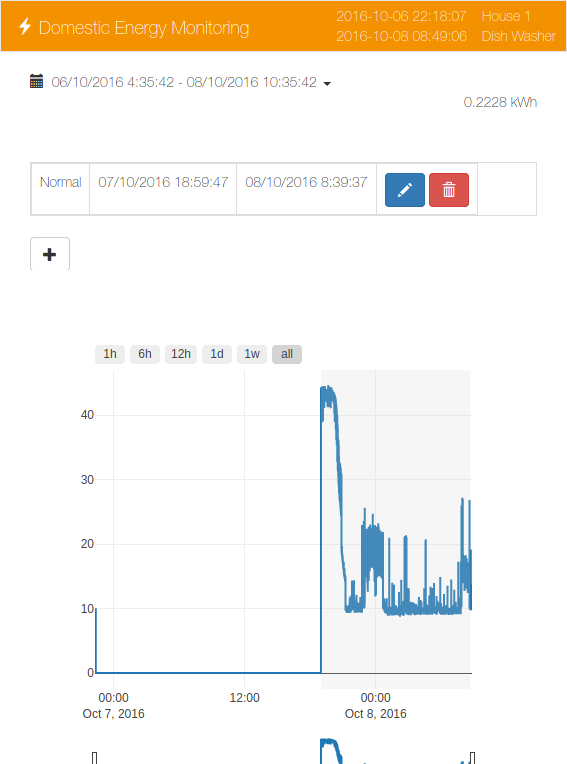
The energy-server provides a responsive UI that shows an overview of all houses, appliances as well as charts and an online annotation tool.
| Houses Overview | Appliances |
|---|---|
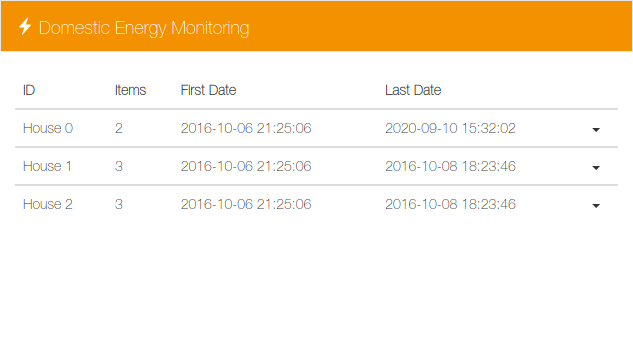 |
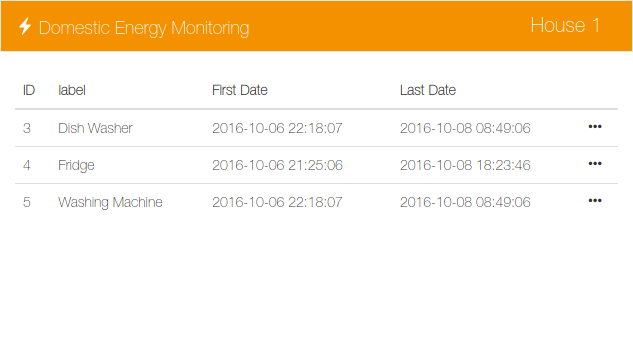 |
| House Details | Charts | Annotation Tool |
|---|---|---|
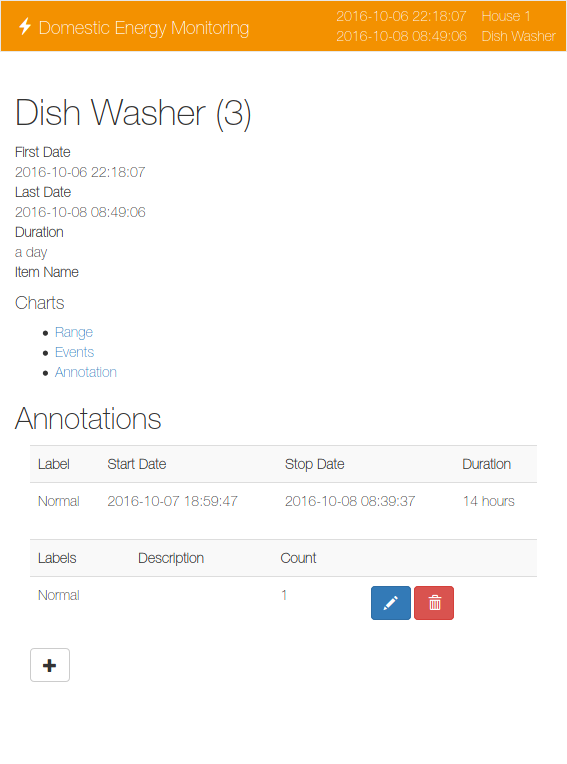 |
 |
 |
Citation
When using the dataset in academic work please cite this paper as the reference.
@article{DEDDIAG_2021,
  author = {Marc Wenninger and Andreas Maier and Jochen Schmidt},
  title = {{DEDDIAG}, a domestic electricity demand dataset of individual appliances in Germany},
  year = {2021},
  month = jul,
  volume = {8},
  number = {1},
  journal = {Scientific Data},
  doi = {https://doi.org/10.1038/s41597-021-00963-2},
  url = {https://rdcu.be/coGqL},
}