

Abstract
Feeding a growing population while minimizing environmental degradation is a global challenge requiring thoroughly rethinking food production and consumption. Dietary choices control food availability and natural resource demands. In particular, reducing or avoiding consumption of low production efficiency animal-based products can spare resources that can then yield more food. In quantifying the potential food gains of specific dietary shifts, most earlier research focused on calories, with less attention to other important nutrients, notably protein. Moreover, despite the well-known environmental burdens of livestock, only a handful of national level feed-to-food conversion efficiency estimates of dairy, beef, poultry, pork, and eggs exist. Yet such high level estimates are essential for reducing diet related environmental impacts and identifying optimal food gain paths. Here we quantify caloric and protein conversion efficiencies for US livestock categories. We then use these efficiencies to calculate the food availability gains expected from replacing beef in the US diet with poultry, a more efficient meat, and a plant-based alternative. Averaged over all categories, caloric and protein efficiencies are 7%–8%. At 3% in both metrics, beef is by far the least efficient. We find that reallocating the agricultural land used for beef feed to poultry feed production can meet the caloric and protein demands of ≈120 and ≈140 million additional people consuming the mean American diet, respectively, roughly 40% of current US population.
Export citation and abstract BibTeX RIS

Original content from this work may be used under the terms of the Creative Commons Attribution 3.0 licence. Any further distribution of this work must maintain attribution to the author(s) and the title of the work, journal citation and DOI.
1. Introduction
The combination of ongoing population rise and the increasing demand for animal-based products places a severe strain on world natural resources (Smil 2002, Steinfeld et al 2006, Galloway et al 2007, Wirsenius et al 2010, Bonhommeau et al 2013). Estimates suggest that global meat demand would roughly double over the period 2000–2050 (Pelletier and Tyedmers 2010, Alexandratos and Bruinsma 2012, Pradhan et al 2013, Herrero et al 2015). Earlier analyses (Steinfeld et al 2006, Godfray et al 2010, Foley et al 2011, Herrero et al 2015) of food supply chains identified inefficiency hotspots that lend themselves to such mitigation measures as improving yield (through genetics and agricultural practices), increasing energy, nutrient and water use efficiencies, or eliminating waste. Others focused on the environmental performance of specific products, for example animal-derived (de Vries and de Boer 2010, Pelletier et al 2010, 2011, 2014, Thoma et al 2013). A complementary body of work (Pimentel and Pimentel 2003, Eshel and Martin 2006, Eshel et al 2010, Hedenus et al 2014, Tilman and Clark 2014, Springmann et al 2016) quantifies the environmental performance of food consumption and dietary patterns, highlighting the large environmental impacts dietary choices can have.
Key to estimating expected outcomes of potential dietary shifts is quantifying the amount of extra food that would become available by reallocating resources currently used for feed production to producing human food (Godfray et al 2010, Foley et al 2011, Cassidy et al 2013, Pradhan et al 2013, West et al 2014, Peters et al 2016). One notable effort (Foley et al 2011, Cassidy et al 2013,) suggested that global reallocation to direct human consumption of both feed and biofuel crops can sustain four billion additional people. Yet, most cultivated feed (corn, hay, silage) is human inedible and characterized by yields well above those of human edible crops. Moreover, most previous efforts focused on calories (Cassidy et al 2013, Pradhan et al 2013), while other key dimensions of human diet such as protein adequacy are equally important.
Here we quantify efficiencies of caloric and protein fluxes in US livestock production. We answer such questions as: How much feed must enter the livestock production stream to obtain a set amount of edible end product calories? What is the composition of these feed calories in the current US system? Where along the production stream do most losses occur? We provide the analysis in terms of both protein and calories and use them to explore the food availability impacts of a dietary change within the animal portion (excluding fish) of the American food system using the dietary shift potential method as described below. While dietary changes entail changes in resource allocation and emissions (Hedenus et al 2014, Tilman and Clark 2014, Eshel et al 2016, Springmann et al 2016), here we highlight the food availability gains that can be realized by substituting the least efficient food item, beef, with the most efficient nutritionally similar food item, poultry. Because beef and poultry are the least and most efficient livestock derived meats respectively, this substitution marks the upper bound on food gains achievable by any dietary change within the meat portion of the mean American diet (MAD). In this study we focus on substitution of these individual items, and plan to explore the substitution of full diets elsewhere. As a yardstick with which to compare our results, we also present the potential food availability gains associated with replacing beef with a fully plant-based alternative.
2. Methods and data
The parameters used in calculating the caloric and protein Sankey flow diagrams (figures 1 and 2) are based on Eshel et al (2015, 2014) and references and sources therein. Feed composition used in figures 1 and 2 are derived from NRC data (National Research Council 1982, 2000). For this work, the MAD is the actual diet of the average American over 2000–2010 (United States Department of Agriculture ERS 2015), with approximate daily loss-adjusted consumption of 2500 kcal and 70 g protein per capita (see SI and supplementary data for additional details).

Figure 1. A Sankey flow diagram of the US feed-to-food caloric flux from the three feed classes (left) into edible animal products (right). On the right, parenthetical percentages are the food-out/feed-in caloric conversion efficiencies of individual livestock categories. Caloric values are in Pcal, 1012 kcal. Overall, 1187 Pcal of feed are converted into 83 Pcal edible animal products, reflecting a weighted mean conversion efficiency of approximately 7%.
Download figure:
Standard image High-resolution image
Figure 2. The US feed-to-food protein flux from the three feed classes (left) into edible animal products (right). On the right, parenthetical percentages are the food-protein-out/feed-protein-in conversion efficiencies of individual livestock categories. Protein values are in Mt (109 kg). Overall, 63 Mt of feed protein yield edible animal products containing 4.7 Mt protein, an 8% weighted mean protein conversion efficiency.
Download figure:
Standard image High-resolution image2.1. Calculating the dietary shift potential
The dietary shift potential, the number of additional people that can be sustained on a given cropland acreage as part of a dietary shift, is
In equation (1), the left-hand side (∆Pa→b) is the number of additional people that can be fed on land spared by the replacement of food item a with food item b. PUS ≈ 300 million denotes the 2000–2010 mean US population;  and
and  denotes the annual per capita land area for producing a set number of calories of foods a and b. This definition readily generalizes to protein based replacements, and/or to substitution of whole diets rather than specific food items.
To derive the mean per capita land requirement of the MAD,  we calculate the land needs of each of the non-negligible plant and animal based items the MAD comprises. We convert a given per capita plant item mass to the needed land by dividing the consumed item mass by its corresponding national mean loss adjusted yield. The land needs of the full MAD is simply the sum of these needs over all items (see supplementary data). The per capita crop land requirements of the animal based MAD categories (e.g.,
 are based on Eshel et al (2014, 2015).
The modest land needs of poultry mean that replacing beef with an amount of poultry that is caloric- or protein-equivalent spares land that can sustain additional people on a MAD. We denote by  the kcal (person yr)−1 consumption of any MAD item. The set number of calories (or protein) consumed in the MAD is different for beef and thus for the calculation of substituting beef with poultry, we multiply the per capita land area of poultry by
  the per capita caloric (or protein) beef:poultry consumption ratio in the MAD, which is 1.2 for calories and 0.6 for protein.
Using equation (1), the caloric dietary shift potential of beef is
For the beef replacement calculation, the resultant post-replacement calories (light orange arrows in figure 3(a)) comprise (1) the poultry calories that replace the MAD beef calories, plus (2) calories that the spared lands can yield if allocated to the production of MAD-like diet for additional people (national feed land supporting beef minus the land needed to produce the replacement poultry). The MAD calories that the spared land can sustain is calculated by multiplying the spared land area by the mean caloric yield of the full MAD with poultry replacing beef, ≈1700 Mcal (ac yr)−1. The national annual calories due to substituting beef for poultry is
where  and
and  are the per capita daily caloric consumption and annual land requirements of poultry, beef or the full MAD, respectively. The first and second terms on the right-hand side of equation (2) are terms (1) and (2) of the above explanation, respectively.
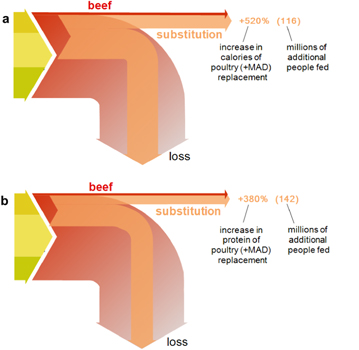
Figure 3. Dietary shift potential of substituting beef with poultry in the mean American diet (MAD). Percent change in available calories due to substituting beef with poultry (panel (a)), +520%. The number of additional people consuming 2500 kcal d−1 that these calories can sustain (the dietary shift potential) is 116 million (upper right parenthetical value). Caloric values are in Pcal, i.e. 1012 kcal. The protein gain due to dietary shift from beef to poultry will increase by 380% (panel (b)), meeting the protein needs of 142 million additional people consuming 70 g protein d−1 (as in the MAD). Protein values are in Mt (109 kg). The caloric loss following substitution is calculated based on the conversion efficiency for poultry and the MAD. The loss of the plant-based portion of MAD is calculated by assessing the loss of each individual plant item throughout the supply chain (see supplementary data); the loss of the animal-based portion of MAD is based on the caloric efficiency conversion estimates shown in table 1. A similar calculation is performed for protein.
Download figure:
Standard image High-resolution image
To derive the difference between the above replacement calories and the replaced beef calories (percentages in figure 3), we subtract the original national consumed beef calories  from the above equation. The difference between replacement and replaced caloric fluxes is
As noted above, the quotient on the right-hand side gives the number of extra people that can be fed, reported in figure 3. An analogous calculation replacing calories with protein mass, yields the protein dietary shift potential shown in figure 3(b). The current calculation of the dietary shift potential also enables calculating the food availability gains associated with any partial replacement. Figure S2 depicts the relation between the dietary shift potential (additional people that can be fed a full MAD diet) and the percentage of national beef calories (from MAD) replaced with poultry.
2.2. The choice of poultry as the considered substitute
We use poultry as the replacement food in our food availability calculations for several reasons. First, US poultry consumption has been rising in recent decades often substituting for beef (Daniel et al 2011), suggesting it can serve as a plausible replacement. In addition, poultry incur the least environmental burden among the major meat categories and thus the calculation of the dietary shift potential presented here serves as an upper bound on possible food gains achievable by any substitution within the meat portion of the MAD.
Plant-based diets can also serve as a viable replacement for animal products, and confer larger mean environmental (Eshel et al 2014, 2016) and food availability gains (Godfray et al 2010). Recognizing that the majority of the population will not easily become exclusive plant eaters, here we choose to present the less radical and perhaps more practical scenario of replacing the environmentally most costly beef with the more resource efficient poultry. We also augment this calculation with a plant-based alternative diet as a substitute.
Finally, poultry stands out in its high kcal g−1 and g protein g−1 values and its desirable nutritional profile. Per calorie, it can deliver more protein than beef while delivering as much or more of the other essential micronutrients (figure S1). While it is tricky to compare the protein quality of beef and poultry, we can use the biological value (modified essential amino acid index and chemical score index Ihekoronye 1988) and the protein digestible corrected amino acid score, the protein indicator of choice of the FAO. Within inevitable variability, the protein quality of poultry is similar to that of beef using both metrics (Sarwar 1987, Ihekoronye 1988, López et al 2006, Barrón-Hoyos et al 2013). While the FAO has recently introduced an updated protein quality score (DIAAS—digestible indispensable amino acid score) (FAO Food and Nutrition paper No. 92 2011), to our knowledge no reliable DIAAS data comparing beef and poultry exists.
3. Results
The efficiency and performance of the animal portion of the American food system is presented in table 1 (see detailed calculations in supplementary files), highlighting a dichotomy between beef and the other animal categories, consistent with earlier environmental burden estimates (Eshel et al 2014).
Table 1. Key parameters (±std. dev.) used in evaluating US feed allocation and conversion among animal categories (Eshel et al 2015) and energy (caloric) and protein efficiency.
| Parameter | Units | Beef | Poultry | Pork | Dairy | Eggs |
|---|---|---|---|---|---|---|
| Feed intake per LW | kg/kg LW | 14 ± 4 | 1.9 ± 0.4 | 3.1 ± 1.3 | N/A | N/A |
| Feed intake per EW | kg/kg EW | 36 ± 13 | 4.2 ± 0.8 | 6 ± 2.5 | N/A | N/A |
| Feed intake per CW | kg/kg CW | 49 ± 9 | 5.4 ± 1.4 | 9 ± 4 | 2.6 ± 0.6 | 2.4 ± 1.2 |
| Feed caloric content | kcal g–1 | 2.3 ± 0.6 | 3.4 ± 1.4 | 3.6 ± 2 | 2.8 ± 0.9 | 3.4 ± 2.4 |
| Food caloric content | kcal g–1 | 3.2 ± 0.3 | 2.3 ± 0.1 | 2.8 ± 0.2 | 1.2 ± 0.1 | 1.4 ± 0.1 |
| Caloric conversion efficiency | % | 2.9 ± 0.7 | 13 ± 4 | 9 ± 4 | 17 ± 4 | 17 ± 9 |
| Feed protein content | % | 12 ± 3 | 17 ± 7 | 17 ± 11 | 15 ± 5 | 17 ± 12 |
| Food protein content | % | 15 ± 2 | 20 ± 2 | 14 ± 1.4 | 6 ± 0.6 | 13 ± 1.3 |
| Protein conversion efficiency | % | 2.5 ± 0.6 | 21 ± 7 | 9 ± 4.5 | 14 ± 4 | 31 ± 16 |
Note: LW = live weight (USDA reported slaughter live weight); EW = edible weight (USDA reported retail boneless edible weight); CW = consumed weight (USDA reported loss-adjusted weight). N/A, denotes 'not applicable' as the parameter is relevant only for CW. Feed caloric content refers to metabolizable energy and feed protein content refers to crude protein. For further information on all data sources and calculations see SI and supplementary data.
The calories flow within the US from feed to livestock to human food is presented in figure 1. From left to right are primary inputs (concentrated feed, processed roughage and pasture) feeding the five secondary producer livestock categories, transformed into human consumed calories. We report energy fluxes in Pcal = 1012 kcal, roughly the annual caloric needs of a million persons. Annually, ≈1200 Pcals of feed from all sources (or ≈800 Pcals when pasture and byproducts are excluded) become 83 Pcals of loss adjusted animal based human food. This is about 7% overall caloric conversion efficiency. The overall efficiency value arises from weighting the widely varied category specific efficiencies, from 3% for beef to 17% for eggs and dairy, by the average US consumption (rightmost part of figure 1). Concentrate feed consumption, such as maize, is distributed among pork, poultry, beef and dairy, while processed roughage and pasture (50% of total calories) feed almost exclusively beef. The concentrated feed category depicted in figure 1 also includes byproducts. We note that because detailed information on the distribution of byproducts as feed for the different animal categories is lacking, we cannot remove them from the feed to food efficiency calculation. Yet, our analysis shows that for the years 2000–2010 the contribution of byproducts to the total feed calories (and protein) was less than 10% (see SI spreadsheet) and so their effect on the values is quantitatively small. The results reported in all figures are corrected for import-export imbalances, such that the presented values refer to the feed used to produce the animal-derived food domestically consumed in the US (i.e., excluding feed used for livestock to be exported, and including imported feed, albeit quite minor in the US context).
While calories are widely used to quantify food system performance, protein—which is often invoked as the key nutritional asset of meat—offers an important complementary dimension (Tessari et al 2016). The flow of protein in the American livestock production system, which supplies ≈45 g protein person−1 d−1 to the MAD, is shown in figure 2. Overall, 63 Mt (1 Mt = 109 kg) feed protein per year are converted by US livestock into 4.7 Mt of loss-adjusted edible animal based protein. This represents an overall weighted-mean feed-to-food protein conversion efficiency of 8% for the livestock sector. Protein conversion efficiencies by individual livestock categories span an ≈11-fold range, more than twice the corresponding range for calories, from 31% for eggs to 3% for beef (see SI for more details).
By isolating visually and numerically the contributions from pasture, which are derived from land that is unfit for production of most other foods, figures 1 and 2 quantify expected impacts of dietary shifts. Of those, we choose to focus on substituting beef with poultry. Because these are the most and least resource intensive meats, this substitution constitutes an upper bound estimate on food gains achievable by any meat-to-meat shift. Lending further support to the beef-to-poultry substitution choice, poultry is relatively nutritionally desirable (see the methods section and figure S1), and—judging by its ubiquity in the MAD—palatable to many Americans.
We quantify the dietary shift potential (a term we favor over the earlier diet gap Foley et al 2011), the number of additional people a given cropland acreage can sustain if differently reallocated as part of a dietary shift. While here we estimate the dietary shift potential of the beef-to-poultry substitution, the methodology generalizes to any substitution (see methods section for further information and equations). The beef-to-poultry dietary shift potentials are premised on reallocating the cropland acreage currently used for producing feed for US beef (excluding pastureland) to producing feed for additional poultry production. Subtracting from beef's high quality land requirements those of poultry gives the spared land that becomes available for feeding additional people. Dividing this spared acreage by the per capita land requirements of the MAD diet (modifying the latter for the considered substitution) yields the number of additional people sustained by the dietary substitution.
We calculate the dietary shift potential for beef (as defined above and in the methods section) by quantifying the land needed for producing calorie- and protein-equivalent poultry substitution, and their differences from the land beef currently requires. We derive the number of additional people this land can sustain by dividing the areal difference thus found by the per capita land demands of the whole modified MAD, ≈0.5 acres (≈2 × 10³ m2) per year.
Evaluating this substitution, and taking note of full supply chain losses, we obtain the overall dietary shift potential of beef to poultry on a caloric basis to be ≈120 million people (≈40% of current US population; figure 3, panel (a)). That is, if the (non-pasture) land that yields the feed US beef currently consume was used for producing feed for poultry instead, and the added poultry production was chosen so as to yield exactly the number of calories the replaced beef currently delivers, a certain acreage would be spared, because of poultry's lower land requirements. If, in addition, that spared land was used for growing a variety of products with the same relative abundance as in the full MAD (but with poultry replacing beef), the resultant human edible calories would have risen to six times the replaced beef calories (figure 3, panel (a)). For protein-conserving dietary shift (figure 3, panel (b)), the dietary shift potential is estimated at ≈140 million additional people (consuming ≈70 g protein person−1 d−1 as in the full MAD). As the protein quality of poultry and beef are similar (see the methods section and references therein), this substitution entails no protein quality sacrifices.
As a benchmark with which to compare the beef to poultry results, we next consider the substitution of beef with a plant based alternative based on the methodology developed in Eshel et al (2016). In that study, we derive plant based calorie- and protein-conserving beef-replacements. We consider combinations of 65 leading plant items consumed by the average American that minimize land requirements with the mass of each plant item set to ≤15 g d−1 to ensure dietary diversity. We find that these legume-dominated plant-based diets substitute beef with a dietary shift potential of ≈190 million individuals.
4. Discussion
In this study we quantify the caloric and protein cascade through the US livestock system from feed to consumed human food. Overall, <10% of feed calories or protein ultimately become consumed meat, milk or egg calories, consistent with mean or upper bound values of conversion efficiency estimates of individual animal categories (Herrero et al 2015). Our results combine biologically governed trophic cascade inefficiency with such human effects such as consumer preferences (e.g., using some animal carcass portions while discarding others) or leaky supply chains which is shared also by plant items. As conversion efficiencies reflect resource efficiencies (Herrero et al 2015), these results mirror our earlier ones quantifying the environmental performance of the US livestock system, highlighting the disproportionate impact of beef (Eshel et al 2014, 2015). Building on and enhancing earlier studies that considered direct human consumption of feed calories (Cassidy et al 2013, West et al 2014), our results quantify possible US calorie and protein availability gains that can be achieved by reallocating high quality land currently used for feed production for beef into producing the same amount of calories and protein from poultry and any extra land remaining is used to produce the MAD (only with poultry replacing beef). Using caloric and protein needs, we estimate 120 and 140 million additional sustained individuals, respectively. This potential production increase can serve as food collateral in face of uncertain food supply (e.g. climate change), or exported to where food supply is limited. In the case of envisioning various scenarios resulting in only partial substitution to poultry consumption, the current calculation also enables to deduce the food gains associated with substituting only a certain percentage of national beef calories with poultry (see figure S2). Our purpose here is not to endorse poultry consumption, nor can our results be construed as such. Rather, the results simply illustrate the significant food availability gains associated with the rather modest and tractable dietary shift of substituting beef with less inefficient animal based alternatives. Substitution of other food items with other nutritionally similar animal food items is also plausible (e.g., pork for beef), yet the food gains expected from such replacements are considerably lower (see supplementary data). Substitution of beef with non-meat animal based products (dairy and eggs) is possible on a caloric or protein basis (see supplementary data), yet given their dissimilar nutritional profile, a more elaborate methodology is required to construct and analyze such a shift (Tessari et al 2016). The dietary shift potential of replacing beef with a plant based alternative (dominated by legumes) (Eshel et al 2016) amounts to ≈190 million additional people. Thus while plant based alternatives offer the largest food availability gains, poultry is not far behind.
We note that the substitution of beef for either poultry or plants also entails vast reductions in demand for pastureland. The effects of dietary shifts on demand for agricultural inputs (such as fertilizer or water) for the production of food on the land spared from growing feed for beef requires further investigation.
This paper offers a system wide view of feed to food production in the US, and introduces the dietary shift potential as a method for quantifying possible food availability gains various dietary shifts confer. Building on this work, future work can quantify the dietary shift potential of full diets (e.g. Peters et al 2016), enhance the realism of various considered dietary shifts, and better integrate nutritional considerations, micronutrients in particular, in the assessment of expected outcomes.
Acknowledgments
We thank David Canty, David St-Jules, Avi Flamholz, Avi Levy, Tamar Makov, and Lisa Sasson for their important help with this manuscript. This research was funded by the European Research Council (Project NOVCARBFIX 646827). RM is the Charles and Louise Gartner professional chair.