


May to Date
Shot & Killed: 23
Shot & Wounded: 116
Total Shot: 139
Total Homicides: 27
May to Date
Shot & Killed: 23
Shot & Wounded: 116
Total Shot: 139
Total Homicides: 27
Week in Progress (5/12 – 5/18)
Shot & Killed: 9
Shot & Wounded: 41
Total Shot: 50
Total Homicides: 9
Year To Date
Shot & Killed: 161
Shot & Wounded: 729
Total Shot: 890
Total Homicides: 187
 It’s been a year since the reigns of power were transferred from a dumpster fire to a raging tire fire. While the tire fire has only recorded about an extra 45 wounded when comparing first-year runs, the inferno has managed an additional 75 homicides. Additionally, this is the final weekend of Spring Training as the Summer of Silly Decisions starts next Friday.
11:00p Demonized Tally: 1 killed, 5 wounded
2023 weekend tally: 2 killed, 24 wounded
2022 weekend tally: 3 killed, 30 wounded
2021 weekend tally: 14 killed, 41 wounded
2020 weekend tally: 7 killed, 34 wounded
2019 weekend tally: 3 killed, 13 wounded
2018 weekend tally: 4 killed, 34 wounded
2017 weekend tally: 5 killed, 36 wounded
2016 weekend tally: 6 killed, 40 wounded
2015 weekend tally: 2 killed, 47 wounded
2014 weekend tally: 7 killed, 24 wounded
Average tally: 5 killed, 32 wounded
Friday 5/17
4:35p 3800 W 85th, Ashburn, M/54
7:25p 5500 W Quincy, Austin, M/14
7:25p 5500 W Quincy, Austin, F/15
7:25p 5500 W Quincy, Austin, M/18
8:15p 5700 S Aberdeen, Englewood, M/42
8:30p 5300 W North, Austin, M/25
Key:
shooting
homicide
Weekend = 12p Friday – 6a Monday
Ahead of our DNC-themed merch drop next weekend, we released a new t-shirt featuring Chicago’s number one food export, Chicago-style hot dogs. Check ’em out.
View all Enlightening Commentary
| Placement | Killed | Wounded |
|---|---|---|
| chest | 44 | 38 |
| head | 38 | 22 |
| abdomen | 12 | 48 |
| face | 12 | 14 |
| back | 7 | 61 |
| neck | 5 | 21 |
| shoulder | 3 | 31 |
| unknown/other | 59 | 465 |
| As of 5/13/24 |

| N'hood | Homicides | Wounded |
|---|---|---|
| Austin | 12 | 47 |
| Englewood | 11 | 45 |
| Garfield Park | 10 | 45 |
| Auburn Gresham | 13 | 31 |
| South Shore | 8 | 34 |
| North Lawndale | 4 | 32 |
| Chatham | 12 | 22 |
| Grand Crossing | 15 | 18 |
| Humboldt Park | 3 | 30 |
| Roseland | 7 | 25 |
| Little Village | 6 | 25 |
| Near West Side | 5 | 26 |
| New City | 4 | 27 |
| West Pullman | 4 | 17 |
| South Chicago | 5 | 15 |
| All Others | 61 | 261 |
| As of 5/13/24 |

| Year | Homicides | Wounded |
|---|---|---|
| 2023 | 255 | 893 |
| 2022 | 261 | 996 |
| 2021 | 276 | 1191 |
| 2020 | 254 | 942 |
| 2019 | 211 | 746 |
| 2018 | 211 | 879 |
| 2017 | 257 | 1137 |
| 2016 | 262 | 1296 |
| 2015 | 174 | 843 |
| 2014 | 157 | 701 |
Previous year data is reflective of May’s end totals.

| Year | Killed | Wounded | Total |
|---|---|---|---|
| 2024 | 152 | 697 | 849 |
| 2023 | 196 | 716 | 912 |
| 2022 | 203 | 821 | 1,024 |
| 2021 | 210 | 959 | 1,169 |
| 2020 | 170 | 727 | 897 |
| 2019 | 154 | 614 | 768 |
| As of 5/12/24 | |||
 Mustard, relish, onions, tomatoes, dill pickle, sport peppers and a dash of celery salt, but hold the ketchup, or else!

| Gender | Killed | Wounded |
|---|---|---|
| Male | 141 | 527 |
| Female | 18 | 86 |
| As of 5/1/24 |

| Race | Victim | Assailant |
|---|---|---|
| Black | 124 | 22 |
| Hispanic | 30 | 3 |
| White/Other | 5 | - |
| As of 5/1/24 |

| Cause | Homicides | % |
|---|---|---|
| Gunshot | 135 | 84.9% |
| Stabbing | 9 | 5.7% |
| Trauma | 8 | 5.0% |
| Auto | 3 | 1.9% |
| Strangulation | 2 | 1.2% |
| Child Abuse | 1 | 0.6% |
| Unknown | 1 | 0.6% |
| As of 5/1/24 |
 We’ve set up a Substack channel where we’ll be posting longer form content that doesn’t necessarily work on the site. Subscribe if you like, or not. We spend most of our social media capital on Twitter/X, however we’ve been more active on Instagram of late and are close to becoming influencers, but only if influencer means having no influence. We’ve also set up a TikTok account so that we can participate in the banning. Plus we have a toehold on a number of smaller, alternative social media platforms to be used primarily as “just-in-case” backups: Odysee, Rumble, Minds and GETTR.

| Year | Killed | Wounded |
|---|---|---|
| 2024 | 1 | 2 |
| Previous Year Totals | ||
| 2023 | 5 | 5 |
| 2022 | 2 | 21 |
| 2021 | 9 | 13 |
| 2020 | 7 | 13 |
| 2019 | 6 | 6 |
| 2018 | 6 | 15 |
| 2017 | 11 | 12 |
| 2016 | 11 | 14 |
| 2015 | 9 | 16 |
| 2014 | 17 | 28 |
| 2013 | 13 | 30 |
| 2012 | 8 | 49 |
| 2011 | 23 | 37 |
| 2010 | 13 | 33 |
| 2009 | 19 | 42 |
| CPD Shot | 1 | 3 |
| CPD Suicides | 1 | - |

| Year | Killed | Wounded |
|---|---|---|
| 2024 | 3 | 7 |
| Previous Year Totals | ||
| 2023 | 8 | 15 |
| 2022 | 9 | 16 |
| 2021 | 5 | 7 |
| 2020 | 11 | 9 |
| 2019 | 6 | 9 |
| 2018 | 4 | 14 |
| 2017 | 13 | 8 |
| 2016 | 12 | 10 |
| 2015 | 5 | 3 |
| As of 4/30/24 | ||

| Cohort | Killed | Wounded |
|---|---|---|
| Kids (0-12) | 4 | 10 |
| Teens (13-17) | 12 | 63 |
| Young Adults (18-35) | 90 | 354 |
| Middle Aged (36-54) | 41 | 138 |
| AARP (55+) | 11 | 21 |
| Unknown | 1 | 27 |
| As of 5/1/24 |

| Victims | Incidents | Killed |
|---|---|---|
| 11 shot | 1 | 1 |
| 7 shot | 1 | - |
| 5 shot | 1 | 1 |
| 4 shot | 4 | 7 |
| Hat Trick | 11 | 8 |
| 2 shot | 64 | 24 |
| As of 4/30/24 |
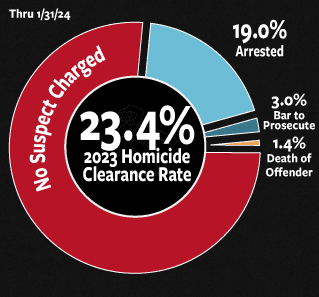
| Legal Outcome | Homicides | % |
|---|---|---|
| Total Homicides | 627 | 100% |
| No Suspect Charged | 480 | 76.6% |
| Suspect Charged | 119 | 19.0% |
| Bar to Prosecute | 19 | 3.0% |
| Death of Offender | 9 | 1.4% |
| As of 2/8/24 |
 Aside from the occasional live stream and videos some platforms find acceptable, most of our video content can now be found on Odysee. Warning: some of the images found within the Gallery may be graphic. View full Gallery
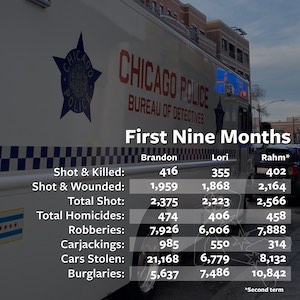
| Mayor | Term | Homicides |
|---|---|---|
| Richard J. Daley | 1955-1976 | 10,910 |
| Michael Bilandic | 1976-1979 | 2,408 |
| Jane Byrne | 1979-1983 | 3,202 |
| Harold Washington | 1983-1987 | 3,295 |
| Eugene Sawyer | 1987-1989 | 978 |
| Richard M. Daley | 1989-2011 | 14,653 |
| Rahm Emanuel | 2011-2019 | 4,535 |
| Lori Lightfoot | 2019-2023 | 2,945 |
| Brandon Johnson | 2023- | 548 |
As more and more CPD frequencies move towards encryption, scanners are becoming useless. Check out CrimeIsDown’s Live Audio Feeds to listen to any zone that hasn’t been encrypted (yet) or use the official feeds with a 30+ minute delay on Broadcastify.

As a small percentage of jagoffs ventilate one another with reckless abandon, we diligently record, document and illustrate every misconception, downward trending, mostly peaceful event. Your support in any amount is greatly appreciated.

If you’d like to support others in the Chicago Scanner community, we ask that you please support those who provide everyone with up to the minute news and information including – Spot News, Chicago Scanner, CrimeIsDown.com & Solutions & Resources Street Pastors
Hosting: Tired of shitty hosting services? We moved over to Nexcess two years ago and have had nothing but a positive experience. It’s never too late to start that cat blog you’ve been dreaming about. This referral link helps pay for our hosting fees and in turn you get a quality host.
Email: You get what you pay for and that includes email. Proton Mail is a quality email platform with an ad-free privacy bent. This referral link helps pay for our email fees and in turn you’ll get a free month of service.
Ad Blockers: We do make a few pennies from ad revenue, so if you wouldn’t mind whitelisting us if you run an ad blocker that would be super.
Brave Users: click on the BAT triangle in the address bar to either send a tip or make a monthly standing contribution. If you’re not using the Brave browser, you should be.
 Why can’t we be friends? Well, we are with these fine folks and you should be too. Check ’em and let them know HeyJackass! sent you.
We compile our own dataset using the following sources: Chicago Tribune, Chicago Sun-Times, Homicide Watch Chicago (no longer updated), DNAInfo Chicago (out of business), Chicago Redeye Homicide Tracker (long gone), NBC5 Chicago, Chicago Tribune’s Shooting Tracker (no longer updated) & Homicide Tracker (declared dead), Sun-Times Homicide Tracker, Cook County Medical Examiner, CPD’s Historical Data Set, City of Chicago Data Portal, Chicago Police Department Arrest Record Search, CPD CLEARMAP, Various CPD Dashboards, ISP Expressway Shooting Dashboard, CPD’s Media Major Incident Notifications and the needlessly woke Chicago Violence Reduction Dashboard.
Community areas and neighborhoods are determined by Crimeisdown.com’s most excellent Incident Map or the Chicago Tribune’s Boundaries App.
Editor’s note: All murders are homicides, but not all homicides are murders. We count homicides, whereas the CPD counts murders. A homicide, or a non-fatal shooting, regardless of type or by whom, within the city limits of Chicago counts towards our total metric, including anything on the expressways. CPD-involved, ISP-involved and justifiable homicides all count. Reckless homicides may count if the Medical Examiner rules that the cause of death was a homicide. Suicides do not count. Additional definitions can be found on the Glossary page.
All statistics, metrics, charts, graphs and other visualizations are preliminary based on the data available at the time. All incidents are subject to further analysis or change.


