


Abstract
To quantify the association of combined sleep behaviours and genetic susceptibility with the incidence of cardiovascular disease (CVD).
This study included 385 292 participants initially free of CVD from UK Biobank. We newly created a healthy sleep score according to five sleep factors and defined the low-risk groups as follows: early chronotype, sleep 7–8 h per day, never/rarely insomnia, no snoring, and no frequent excessive daytime sleepiness. Weighted genetic risk scores of coronary heart disease (CHD) or stroke were calculated. During a median of 8.5 years of follow-up, we documented 7280 incident CVD cases including 4667 CHD and 2650 stroke cases. Compared to those with a sleep score of 0–1, participants with a score of 5 had a 35% (19–48%), 34% (22–44%), and 34% (25–42%) reduced risk of CVD, CHD, and stroke, respectively. Nearly 10% of cardiovascular events in this cohort could be attributed to poor sleep pattern. Participants with poor sleep pattern and high genetic risk showed the highest risk of CHD and stroke.
In this large prospective study, a healthy sleep pattern was associated with reduced risks of CVD, CHD, and stroke among participants with low, intermediate, or high genetic risk.
Introduction
Cardiovascular disease (CVD), including coronary heart disease (CHD) and stroke, is among the leading causes of mortality globally.1 In addition to traditional lifestyle behaviours, emerging evidence has implicated several unhealthy sleep behaviours were important risk factors for CVD.2 , 3 For example, short or long sleep duration,4–9 late chronotype,10 , 11 insomnia,12–17 snoring,18 , 19 and excessive daytime sleepiness20 , 21 were associated with a 10–40% increased CVD risk. These sleep behaviours are typically correlated and may affect in a concerted manner; and modifications in one sleep behaviour usually lead to compensatory changes in other sleep behaviours. However, in most of the previous studies, sleep behaviours were assessed individually, without taking into account the complexity and correlations of various sleep behaviours among free-living individuals. Only several studies have assessed sleep behaviours jointly, suggesting that the co-occurrence of insomnia with objective short sleep duration is associated with the highest risk of CVD.22–26 However, the available findings are partially conflicting and limited due to selection bias as well as limited sleep behaviours included, with no prospective study has jointly examined all five sleep behaviours mentioned above in relation to CVD risk.
In addition, it is well-accepted that both genetic and behavioural factors contribute to the development of CVD. In recent year, several studies have shown that genetic susceptibility might interact with lifestyle factors on cardiometabolic outcomes,27–29 and genetically predetermined rise on CVD risk could be offset at least to some extent by healthy lifestyle.30 , 31 However, whether the healthy sleep pattern, which integrate several cardiovascular-related sleep behaviours, may modify the effect of genetic predisposition on CVD remain largely unknown.
Therefore, based on UK Biobank study, we prospectively assessed the associations between a combination of major sleep behaviours, characterized by a healthy sleep score, and the risk of CVD (CHD and stroke). In addition, we estimated the proportion of cardiovascular events that theoretically would not have occurred if all participants had a healthy sleep pattern. We also aimed to examine the joint association of sleep pattern and genetic susceptibility with CVD outcomes and explore the potential gene–sleep interactions.
Methods
Study population
Study design and methods of UK Biobank have been reported in detail previously.32 In brief, UK Biobank is a large-scale prospective study with over 500 000 participants aged 37–73 years recruited in 2006–2010. Participants provided information on sleep and other health-related aspects through touch-screen questionnaires and physical measurements. Blood samples were collected for genotyping. The UK Biobank research has approval from the North West Multicenter Research Ethical Committee. All participants provided written informed consent for the study.
In the present study, we excluded participants with CVD (n = 32 187) and those with missing values on the main exposures of the current study (n = 91 833) at baseline, leaving 385 292 participants remained for the primary analysis. In the joint association between genetic risk and sleep pattern analysis, only participants of European descent were included (n = 357 246).
To validate the novel sleep score, we further examined the associations of healthy sleep score with CVD outcomes in an independent, prospective cohort: China Kadoorie Biobank (CKB). Details of the methods regarding validation analysis in CKB have been provided in Supplementary material online, Method.
Assessment of sleep behaviours
All sleep behaviours were self-reported. Chronotype preference was assessed using the following question, ‘Do you consider yourself to be (i) definitely a “morning” person, (ii) more a “morning” than “evening” person, (iii) ‘more an “evening” than “morning” person’, or (iv) definitely an “evening” person’. Sleep duration was recorded as number of reported hours by asking ‘About how many hours sleep do you get in every 24 h? (include naps)’. Given previously established U-shape relationships with CVD, sleep duration was categorized as short (<7 h/day), normal (7–8 h/day), and long (≥9 h/day) consistent with previous studies.4 , 6 Insomnia symptoms were obtained by asking ‘Do you have trouble falling asleep at night or do you wake up in the middle of the night?’ with responses of (i) never/rarely, (ii) sometimes, or (iii) usually. Information on snoring was collected by asking ‘Does your partner or a close relative or friend complain about your snoring?’ with responses of (i) yes or (ii) no. Subjective daytime sleepiness was coded based on the question ‘How likely are you to doze off or fall asleep during the daytime when you don’t mean to? (e.g. when working, reading or driving)’ with responses of (i) never/rarely, (ii) sometimes, (iii) often, or (iv) all of the time.
Definition of a healthy sleep score and sleep patterns
We included five sleep factors (chronotype, duration, insomnia, snoring, and excessive daytime sleepiness) to generate a healthy sleep score. Low-risk sleep factors were defined as follows: early chronotype (‘morning’ or ‘morning than evening’); sleep 7–8 h per day; reported never or rarely insomnia symptoms; no self-reported snoring; and no frequent daytime sleepiness (‘never/rarely’ or ‘sometimes’). For each sleep factor, the participant received a score of 1 if he or she was classified as low risk for that factor or 0 if at high risk for that factor. All component scores were summed to obtain a healthy sleep score ranging from 0 to 5, with higher scores indicating a healthier sleep pattern. We then define the overall sleep patterns as ‘healthy sleep pattern’ (healthy sleep score ≥4), ‘intermediate sleep pattern’ (2≤healthy sleep score ≤3), and ‘poor sleep pattern’ (healthy sleep score ≤1) based on the healthy sleep score.
In sensitive analysis, we further constructed a weighted sleep score based on the five sleep factors by using the equation: weighted sleep score = (β1×factor1 +β2 ×factor 2 +…+β5×factor 5) × (5/sum of the β coefficients). This weighted score also ranges from 0 to 5 points but considers magnitudes of the adjusted relative risk for each factor in each sleep pattern as a combination of five factors.
Definition of genetic risk score
The genotyping process and arrays used in the UK Biobank study have been described elsewhere.33 In the present study, we selected 74 independent single nucleotide polymorphisms (SNPs) and 10 SNPs that showed significant genome-wide association with CHD34 and stroke35 in recent published genome-wide associations studies (GWASs), respectively. Details regarding the selected SNPs are provided in Supplementary material online, Table S1. On the basis of the selected SNPs, the genetic risk score (GRS) for CHD and stroke was calculated separately, using previously reported weighted method31 , 36 , 37: weighted GRS = (β1 × SNP1 + β2 × SNP2 + … + βn × SNPn) × (N/sum of the β coefficients). Individual SNP was recoded as 0, 1, and 2 according to the number of risk alleles. The effect size (β-coefficient) for each SNP was obtained from the reported GWAS data. We determined whether participants were at high (quintile 5), intermediate (quintile 2–4), or low (quintile 1) genetic risk for each outcome.
Assessment of outcomes
In UK Biobank study, the vital status of each participant was identified chiefly by using linkage with hospital admission data and death registry records. Detailed information regarding the linkage procedure is available online (https://www.ukbiobank.ac.uk/wp-content/uploads/2011/11/UK-Biobank-Protocol.pdf). The primary outcomes in the present study were incident CVD and its two major component endpoints—CHD and stoke. Also, outcomes of incident CHD and stroke were assessed separately. We defined outcomes according to the International Classification of Diseases edition 10 (ICD-10): I20–I25 for CHD and I60–I64, I69 for stroke.
Statistical analysis
Baseline characteristics of 385 292 participants were described as means or percentages in each category of healthy sleep score, with adjustment for age and sex as appropriate, by means of either multiple linear regression (for continuous characteristics) or logistic regression (for binary characteristics). Follow-up time was calculated from the baseline date to diagnosis of outcome, death, or the censoring date (16 February 2016), whichever occurred first. Cox proportional hazards model was used to estimate the hazard ratio (HR) and 95% confidence interval (CI). The proportional hazards assumptions for the Cox model was tested using Schoenfeld residuals method and was satisfied. Models were adjusted for age (continuous), sex (male/female), the Townsend Deprivation Index (continuous), ethnic (Whiter, Black, Asian, and mixed/other), total physical activity level (continuous), smoking (current/past/never), alcohol consumption (current/past/never), family history of heart diseases or stroke (yes/no, in the corresponding analysis), body mass index (BMI, continuous), hypertension (yes/no), and diabetes (yes/no). Townsend Deprivation Index is an area-based proxy measure for socioeconomic status provided in UK biobank study. If covariate information was missing, we imputed sex-specific mean values for continuous variables or used a missing indicator approach for categorical variables (all covariates <1% missing). In the analysis of individual sleep factors, the models included all the sleep factors simultaneously. The linear trend test was performed by treating the healthy sleep score as a continuous variable. The test for interaction between healthy sleep score and genetic susceptibility to CVD outcomes was performed by using the likelihood ratio test comparing models with and without a cross-product term. We also plotted the age- and sex-adjusted cumulative incidences of CVD according to genetic and sleep risk in this study cohort, accounting for death as a competing risk.
To examine the robustness of our findings, we also conducted several sensitivity analyses: additionally adjusting for education (qualification) and household income; additionally adjusting for environmental stressors including residential noise pollution, residential particulate matter air pollution (pm10), and work satisfaction.
To estimate the proportion of CVD that theoretically would not have occurred if all participants had a healthy sleep pattern, we calculated the population attributable risk percent (PAR%), an estimate of cases in this population that would not have occurred if all participants had been in the low-risk group, assuming a causal relationship.38 Analyses were performed using Stata 14.0 (StataCorp, College Station, TX, USA). The statistical tests were two-sided and statistical significance was defined as P-values <0.05.
Results
Table 1 shows the baseline characteristics of the study participants according to healthy sleep score. Of 385 292 participants, 21.8%, 37.0%, and 27.9% had a healthy sleep score of 5, 4, and 3, respectively. Participants with higher healthy sleep scores had lower measurements of BMI, and lower prevalence of pre-existing hypertension and diabetes, were more likely to be women, physically active and were less likely to be current smokers.
Age- and sex-adjusted baseline characteristics of 385 292 participants according to healthy sleep score
| Baseline characteristics | Healthy sleep score
|
||||
|---|---|---|---|---|---|
| 0–1 | 2 | 3 | 4 | 5 | |
| Number of participants | 8805 | 42 383 | 107 626 | 142 642 | 83 836 |
| Age (years) | 56.1 | 56.3 | 56.3 | 56.1 | 55.9 |
| Female (%) | 53.4 | 54.2 | 53.1 | 55.4 | 64.1 |
| White (%) | 92.7 | 94.2 | 94.6 | 94.9 | 95.2 |
| Townsend indexa | −0.7 | −1.1 | −1.4 | −1.5 | −1.7 |
| Current smoker (%) | 17.4 | 14.5 | 11.9 | 9.2 | 6.7 |
| Current drinker (%) | 90.4 | 92.1 | 92.7 | 92.9 | 92.4 |
| Physical activity (MET-h/week) | 2393.7 | 2491.6 | 2643.3 | 2740.1 | 2935.0 |
| Sedentary time (h/day) | 5.6 | 5.2 | 4.9 | 4.7 | 4.4 |
| BMI (kg/m2) | 29.8 | 28.6 | 27.7 | 27.0 | 26.2 |
| Family history of heart diseases (%) | 46.1 | 45.0 | 42.7 | 41.4 | 40.1 |
| Family history of stroke (%) | 28.1 | 27.1 | 26.3 | 25.6 | 24.9 |
| Hypertension (%) | 62.6 | 58.4 | 55.4 | 52.7 | 49.9 |
| Diabetes (%) | 1.6 | 1.0 | 0.8 | 0.7 | 0.5 |
| Having low-risk sleep factors (%) | |||||
| Early chronotype | 8.6 | 28.0 | 46.6 | 66.6 | — |
| Sleep 7–8 h/day | 4.1 | 20.5 | 50.9 | 82.2 | — |
| Never/rarely insomnia | 4.6 | 27.7 | 57.7 | 85.5 | — |
| No self-reported snoring | 6.3 | 31.6 | 47.3 | 66.5 | — |
| No frequent daytime sleepiness | 69.7 | 92.2 | 97.4 | 99.3 | — |
The results are presented as adjusted means or percentages, with adjustment for age and sex, as appropriate. All baseline characteristics were associated with the healthy sleep score, with P < 0.001 for trend across categories.
BMI, body mass index.
Positive values of the index will indicate areas with high material deprivation, whereas those with negative values will indicate relative affluence.
During a median of 8.5 years (4.3 million person-years) of follow-up, we documented 7280 incident CVD including 4667 CHD cases and 2650 stroke cases. Table 2 and Supplementary material online, Table S2 shows the associations between each of sleep factors and cardiovascular outcomes, including the adjustments. In multivariable-adjusted models, short (≤6 h) or long sleep duration (≥9 h), insomnia, snoring, and excessive daytime sleepiness were each associated with an increased risk of CVD. After additionally adjusting for BMI, hypertension, and diabetes (fully adjusted models), these associations remained statistically significant except for snoring. For each of sleep factors, a similar pattern of association was observed with CHD risk. For stroke, only short or long sleep duration was significantly associated with an increased risk of this outcome.
Multivariable-adjusted HRs (95% CIs) for cardiovascular diseases by sleep factors among 385 292 participants
| Age and sex adjusted | Multivariable adjusted: + TDI, ethnic, physical activity, smoking, alcohol, family history | Fully adjusted: + BMI, HYP, diabetes | |
|---|---|---|---|
| Cardiovascular disease | |||
| Late chronotype | ↑ | — | — |
| Short or long sleep duration | ↑ | ↑ | ↑ |
| Insomnia | ↑ | ↑ | ↑ |
| Snoring | ↑ | ↑ | — |
| Excessive daytime sleepiness | ↑ | ↑ | ↑ |
| Coronary heart disease | |||
| Late chronotype | ↑ | — | — |
| Short or long sleep duration | ↑ | ↑ | ↑ |
| Insomnia | ↑ | ↑ | ↑ |
| Snoring | ↑ | ↑ | — |
| Excessive daytime sleepiness | ↑ | ↑ | ↑ |
| Stroke | |||
| Late chronotype | ↑ | — | — |
| Short or long sleep duration | ↑ | ↑ | ↑ |
| Insomnia | — | — | — |
| Snoring | — | — | — |
| Excessive daytime sleepiness | ↑ | — | — |
BMI, body mass index; HYP, hypertension; TDI, Townsend Deprivation Index.
When the five sleep factors were collapsed into binary categories of low risk vs. high risk (reference group), early chronotype, adequate sleep duration, free of insomnia, and no frequent daytime sleepiness were each independently associated with incident CVD, with a 7%, 12%, 8%, and 15% lower risk, respectively (Table 3). Early chronotype, adequate sleep duration, and free of insomnia were independently associated with a significantly reduced risk of CHD; while only adequate sleep duration was associated with stroke.
Multivariable-adjusted HRs (95% CIs) for cardiovascular diseases by low-risk sleep factors among 385 292 participants
| Low-risk sleep factors | % of 385 292 participants | CVD
|
CHD
|
Stroke
|
|||
|---|---|---|---|---|---|---|---|
| HR (95% CI)a | PAR% | HR (95% CI)a | PAR% | HR (95% CI)a | PAR% | ||
| Early chronotype | 62.7 | 0.93 (0.89–0.97) | 2.7 (1.0 to 4.5) | 0.92 (0.87–0.98) | 3.0 (0.8 to 5.2) | 0.93 (0.86–1.01) | 2.5 (0.0 to 5.0) |
| Sleep 7–8 h/day | 68.7 | 0.88 (0.84–0.92) | 4.4 (2.3 to 6.5) | 0.87 (0.82–0.92) | 4.9 (2.1 to 7.7) | 0.90 (0.83–0.98) | 3.4 (0.2 to 6.5) |
| Never/rarely insomnia | 72.7 | 0.92 (0.87–0.97) | 2.5 (1.4 to 3.6) | 0.90 (0.84–0.96) | 3.2 (2.5 to 3.9) | 0.96 (0.88–1.05) | 1.1 (−1.4 to 3.6) |
| No self-reported snoring | 63.2 | 0.96 (0.91–1.01) | 2.0 (−0.2 to 4.1) | 0.95 (0.90–1.01) | 2.3 (−0.4 to 5.0) | 0.97 (0.90–1.05) | 1.5 (−1.8 to 4.8) |
| No frequent daytime sleepiness | 97.5 | 0.85 (0.76–0.97) | 0.5 | 0.87 (0.75–1.01) | 0.5 | 0.83 (0.68–1.02) | 0.6 |
| All five factors | 21.8 | 0.87 (0.82–0.93) | 11.5 (4.9 to 18.1) | 0.86 (0.79–0.93) | 13.1 (5.1 to 20.9) | 0.90 (0.81–0.99) | 8.7 (−2.5 to 19.8) |
CHD, coronary heart disease; CI, confidence interval; CVD, cardiovascular disease; HR, hazard ratio; PAR, population attributable risk.
Compared with all other participants not in this low-risk group. All models adjusted for age (continuous), sex (male/female), the Townsend Deprivation Index (continuous), ethnic (Whiter, Black, Asian, mixed/other), total physical activity level (continuous), smoking status (current/past/never), alcohol consumption (current/past/never), family history of heart diseases or stroke (yes/no, in the corresponding analysis), body mass index (continuous), hypertension (yes/no), and diabetes (yes/no). All low-risk factors were included simultaneously in the same model.
When these five sleep factors were considered jointly by using healthy sleep score, the risks of CVD, CHD, and stroke decreased significantly with an increasing healthy sleep score (Figure 1 and Supplementary material online, Table S3, all P for linear trend <0.001). Compared to those with a sleep score of 0–1, the fully adjusted HRs (95% CI) of those with a sleep score of 5 was 0.65 (0.52–0.81) for CVD, 0.66 (0.56–0.78) for CHD, and 0.66 (0.58–0.75) for stroke, respectively. When evaluated ordinally, each additional healthy sleep score was associated with an 8% lower risk of CVD (HR for a one point higher healthy sleep score = 0.92; 95% CI 0.89–0.94), a 9% lower risk of CHD (HR = 0.91; 95% CI 0.88–0.93), and a 7% lower risk of stroke (HR = 0.93; 95% CI 0.90–0.97). The results were largely unchanged with further adjustment for the sociodemographic or environmental stressors. We performed validation analysis in an independent cohort, the CKB study, and consistently found that an increasing healthy sleep score was associated with decreased risks of CVD, CHD, and stroke (Supplementary material online, Table S4).
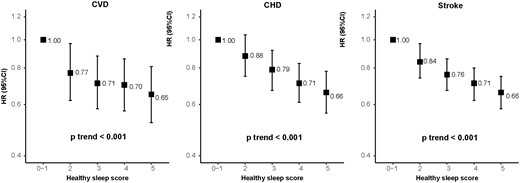
Incident risk of cardiovascular diseases according to healthy sleep score among 385 292 participants. Multivariable model was adjusted for age, sex, the Townsend Deprivation Index, ethnic, total physical activity level, smoking status, alcohol consumption, family history of heart diseases or stroke (only in the corresponding analysis), body mass index, prevalent hypertension, and prevalent diabetes. CHD, coronary heart disease; CI, confidence interval; CVD, cardiovascular disease; HR, hazard ratio.
For each CVD outcome, the associations per 1 higher score of healthy sleep pattern were broadly similar between men and women and among subgroups that were classified by age, smoking status, levels of physical activity, or BMI (Supplementary material online, Table S5). However, the associations appeared to be modified by sedentary time. For stroke, there was further evidence of a somewhat stronger association among current smoker and inactive participants.
We also calculated the PAR% for each sleep factor separately as well as all five factors combined (Table 3). Compared with the low-risk group, each sleep factor was estimated to explain 0.5% (excessive daytime sleepiness) to 4% (sleep duration) of the population risk of developing CVD, CHD, and stroke. For participants having a healthy sleep score of five, the PAR% for CVDs was 11.5% (95% CI 4.9–18.1%), suggesting that more than one-tenth of all CVD events in this cohort would not have occurred if all participants had been in the low-risk group for all five sleep factors. The respective PAR% was 13.1% (5.1% to 20.9%) for CHD and 8.7% (−2.5% to 19.8%) for stroke.
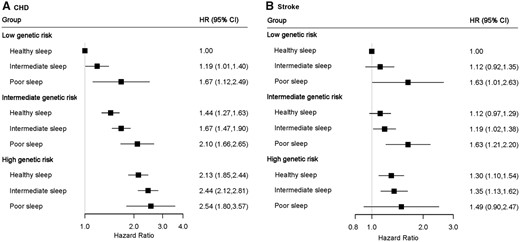
We further assessed the joint association of the healthy sleep score and polygenetic risk score of CVDs with the CVD outcomes. Supplementary material online, Figures S1 and S2 show the adjusted cumulative incidences of CVD by sleep pattern and genetic risk, respectively. We further found that participants with high genetic risk and poor sleep pattern had the highest risk of CHD, even though there was no statistically significant interaction between healthy sleep score and genetic susceptibility to CHD (P for interaction = 0.775) (Figure 2, Take home figure). Participants with high genetic risk and poor sleep pattern had a more than 2.5-fold greater risk of CHD (HR = 2.54; 95% CI 1.80–3.57) than participants with low genetic risk and healthy sleep pattern. A similar pattern of joint association was observed for stroke (P for interaction = 0.863). The results were not materially changed for weighted healthy sleep score (Supplementary material online, Tables S6 and S7).
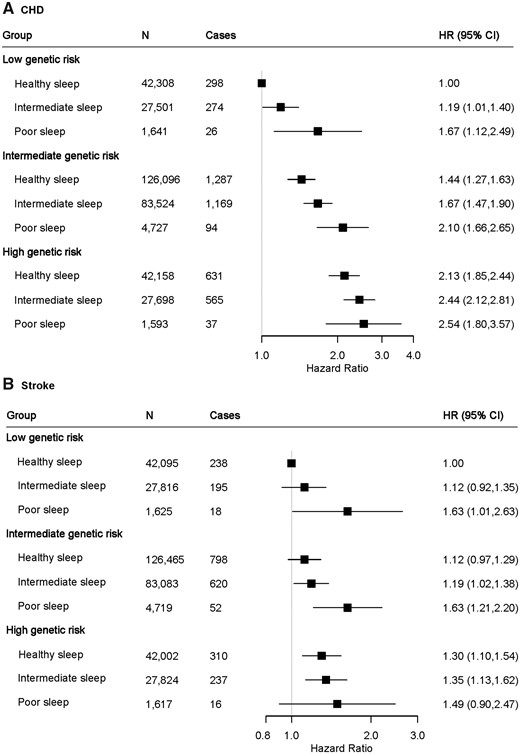
The joint association of genetic risk and sleep pattern with CHD (A) and stroke (B) among 357 246 European ancestry participants. Multivariable model was adjusted for age, sex, the Townsend Deprivation Index, ethnic, total physical activity level, smoking status, alcohol consumption, family history of heart diseases or stroke (only in the corresponding analysis), body mass index, prevalent hypertension, and prevalent diabetes. The vertical line indicates the reference value of 1. CHD, coronary heart disease; CI, confidence interval; CVD, cardiovascular disease; HR, hazard ratio.
The joint association of genetic risk and sleep pattern with cardiovascular disease. Healthy sleep score to each participant was calculated by summing the binary score for each of the low-risk sleep factors: early chronotype; sleep 7–8 h per day; never or rarely insomnia; no snoring; no frequent excessive daytime sleepiness. The overall sleep pattern was defined as healthy (≥4), intermediate (2–3), and poor (≤1) based on the healthy sleep score. The overall genetic risk for each outcome was defined as high (Q5), intermediate (Q2–Q4), and low (Q1) based on the genetic risk score, separately.
Discussion
In this large, prospective cohort of middle-aged to older men and women, we examined the joint associations of five sleep behaviours, in a form of a healthy sleep score integrating sleep duration, chronotype, insomnia, snoring, and excessive daytime sleepiness, with incident CVD events. Participants with a healthy sleep score of 5, compared with 0–1, had a 35%, 34%, and 34% lower risk of developing CVD, CHD, and stroke, respectively. If these associations are causal, our results suggest that more than 10% of CVD, CHD, and stroke events would not have occurred if all participants had been in the low-risk group for all five sleep factors.
In line with our findings, several previous studies assessing other combination of sleep behaviours found that short or long sleepers who reported frequent insomnia symptoms,22–24 as well as participants who reported snoring and daytime sleepiness had the highest risk of CVD.39 In the current study, we newly constructed a healthy sleep score by taking into account the combined impact of five sleep behaviours on CVD risk, which reflects a more comprehensive sleep pattern. Besides traditional risk factors that are part of the 2016 European Guidelines on CVD prevention in clinical practice,40 we found that a healthy sleep pattern was related to a reduced risk of CVD events. Our findings underline the importance of considering sleep behaviours in cardiovascular practice. The healthy sleep pattern defined by this study (early chronotype, sleep 7–8 h per day, never or rarely insomnia, no snoring, and no frequent excessive daytime sleepiness) provides a positive frame of reference for sleep and is also of value in identifying high-risk individuals and facilitating health management. From a public health perspective, the use of the simple score algorithm makes epidemiological findings easier to be interpreted and translated into practice, and therefore to be more informative to the general population. It is worthy to note that this is an observational study and the results should be interpreted with caution. Further clinical trials on sleep intervention will be necessary to assess whether the observed associations are causal.
Existing evidence from different studies, together with present analysis of single sleep factors, support the selection of sleep behavioural factors included in the healthy sleep score. Previous epidemiological studies have consistently shown associations of abnormal sleep duration,4–9 late chronotype,10 , 11 insomnia,15–17 snoring,18 , 19 , 39 and excessive daytime sleepiness20 , 21 , 39 with increased risks of CHD and stroke. In the present study, however, the associations between sleep factor and stroke risk were less clear (except for sleep duration), partially due to the small number of stroke events. In addition, we observed an association of snoring with the incidence of either CVD or CHD; but the associations became not significant after further adjustment for BMI, hypertension, and diabetes. Similar to the present observations, several previous studies also found such associations were attenuated or even disappeared after adjustment for these metabolic factors.19 , 39 , 41 , 42 These data, taken together, suggested that snoring might not be an independent risk factor for CVD, and the observed association with CVD events might be partly due to its correlations with other cardiometabolic risk factors.
It is important to evaluate the combination of these sleep behaviours because these sleep-related factors are often interconnected. For instance, frequent insomnia may result in shorter duration of sleep and excessive daytime sleepiness, and participants with late chronotype often have reduced sleep duration. No study has explored the mechanism by which the combination of sleep behaviours might affect CVD risk; however, these sleep behaviours may individually act through several mechanisms that could operate synergistically to increase the risk of CVD. Shortened sleep or insomnia symptoms were associated with endocrine or metabolic disruption, increased sympathetic nervous activity, and/or inflammatory pathways.7 Late chronotype may lead to disrupted circadian rhythm.43 Habitual snoring is often accompanied by sleep apnoea, and heavy snoring has been linked to an increased carotid intima media thickness and plaque and atherosclerosis.44
To the best of our knowledge, this is the first prospective study to assess the joint associations of sleep pattern and genetic risk score with incident CVD risk. We observed that there was no statistically significant interaction between healthy sleep score and genetic susceptibility to CHD or stroke. Even though, we found that a high genetic risk could be partly offset by a healthy sleep pattern, but, in addition, individuals with low genetic risk could lose their inherent protection if they had a poor sleep pattern. Thus, a healthy sleep pattern (treating the sleep disorders) may play an important role in the primary prevention of CVD and other related disorders among the whole population regardless of the individuals’ genetic risk profile.
Strengths and Limitations
Strengths of our study include the large sample size and the prospective study design. More importantly, we constructed a healthy sleep score to assess the relation between the overall sleep patterns, which integrate several sleep behaviours, and CVD risk. We are not aware there is another similar study addressing such a novel scientific concept. Another major novelty of the current study is to examine the joint associations of sleep pattern and genetic risk with CVD events. The present study has several potential limitations. First, this is an observational study and the associations between sleep pattern and the risks of cardiovascular events cannot be interpreted as causal relations. Second, because self-reported sleep data was used in our analyses, misclassification of exposures was inevitable. However, such misclassification would likely attenuate findings toward the null and underestimate the effect of the observed associations. Third, we dichotomized five sleep factors to create a healthy sleep score for simplicity, which might result in loss of information and study power. In addition, the healthy sleep score did not include all the sleep behaviours, such as restless legs syndrome that could additionally increase cardiovascular risk.45 , 46 With these additional factors, the estimated risk reductions and PAR could have been potentially larger. Fourth, a single measurement of sleep factors at baseline was used to create a healthy sleep score, which did not take into account changes of sleep behaviours before and after assessment. Future cohort studies with repeated measurements of sleep behaviours are needed to investigate the effect of changing sleep patterns on cardiovascular outcomes. Fifth, although we adjusted for major confounding factors, residual confounding from unknown or unmeasured factors still remains possible. In addition, since snoring was associated with adiposity, hypertension, and diabetes, adjustment for those factors might lead to a further underestimate of the overall benefit of healthy sleep pattern. Finally, the present study was based on UK Biobank and most participants of European descent. This might affect the generalization of the results to other populations but not affect the internal validity of the study.
Conclusions
In summary, a healthy sleep pattern, including early chronotype, sleep 7–8 h per day, never or rarely insomnia, no snoring, and no frequent excessive daytime sleepiness, was associated with a reduced risk of CVD, CHD, and stroke among participants with low, intermediate, or high genetic risk.
Acknowledgements
The most important acknowledgement is to the participants in the study and the members of the survey teams, as well as to the project development and management teams.
Funding
The study was supported by grants from the National Heart, Lung, and Blood Institute (HL071981, HL034594, HL126024), the National Institute of Diabetes and Digestive and Kidney Diseases (DK115679, DK091718, DK100383, DK078616). L.Q. is a recipient of the American Heart Association Scientist Development Award (0730094N). L.Q. is also supported by NIGMS P20GM109036. M.F. is a recipient of a scholarship under the China Scholarship Council to pursue her study in the United States of America (201706010313). The CKB work was supported by grants (2016YFC0900500, 2016YFC0900501, 2016YFC0900504) from the National Key R&D Program of China.
Conflict of interest: none declared.
References

