A majority of Americans across every state and almost every demographic support LGBTQ nondiscrimination protections, according to a poll released Tuesday by the nonprofit research firm Public Religion Research Institute.
The nonpartisan organization's "American Values Atlas" survey found that 69 percent of Americans support “broad nondiscrimination protections for lesbian, gay, bisexual and transgender people.” That includes majorities in all major religions, from 90 percent of Unitarian/Universalists to 53 percent of Jehovah’s Witnesses.
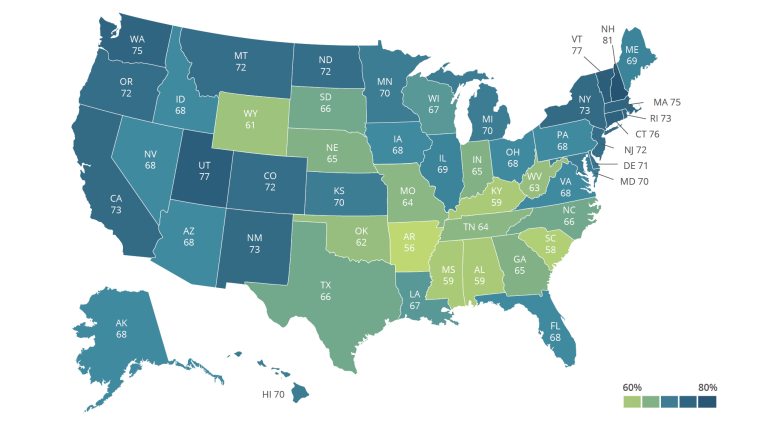
“I still think that certainly in today’s polarized climate, it’s quite remarkable on any issue to be able to say there's bipartisan, cross-religious support on an issue, and much less one like an issue like LGBT rights, one that’s historically controversial,” PRRI CEO Robert Jones told NBC News. “And to be able to say there’s majority support in all 50 states for that policy as well” is significant, he added.
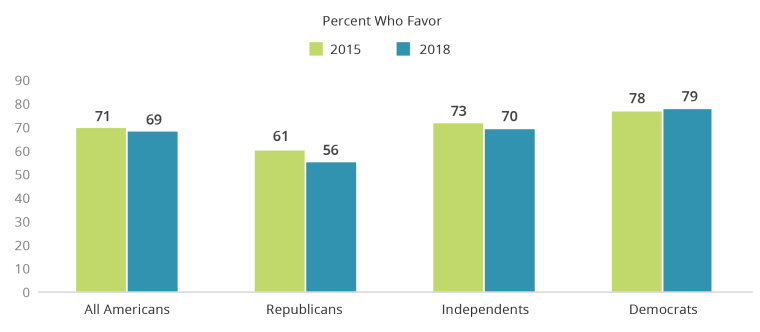
While the report characterizes the support for LGBTQ nondiscrimination protections among Americans as “stable,” it in fact declined from 71 percent in 2015 to 69 percent in 2018 (margin of error is 0.5 percent). One pronounced decline was among Republicans — there was a 5 percentage point drop in support. In 2015, 61 percent of Republicans supported LGBTQ nondiscrimination protections, while in 2018, that support fell to 56 percent.
“The reason why we highlighted that is because it is significant,” Jones said. “We had such a large sample size, so we are really confident that the difference is real.”
“Notably, among Republicans, this drop in support has been concentrated among those who showed the highest support for LGBT protections just a few years ago,” the report explains.
One demographic slice with comparatively low support and strong opposition is that of Republicans, 65 and older — just 48 percent support LGBTQ protections, while 42 percent oppose them.
“There are fewer liberal Republicans today than there were in 2015 and fewer younger Republicans today than in 2015,” Jones said, noting the polls are a snapshot in time. “They’ve moved into the independent category.”
“If you're a liberal Republican or a Republican under 30, you may feel out of step," Jones added.
Another group with a relatively low overall support for LGBTQ protections is the evangelical Christians, whose attitudes “are highly structured by party affiliation,” the report found. The poll found that 47 percent of white evangelical Republicans support LGBTQ protections, compared to 58 percent of white evangelical independents and 71 percent of white evangelical Democrats.
Related

The report notes that attitudes toward this political question are highly segmented by age: A majority, 63 percent, of white evangelical Protestants ages 18-29 support nondiscrimination laws, while 45 percent of those ages 65 and older do. A version of that age gap — younger people expressing greater LGBTQ support than their older coreligionists — exists across many religious groups, according to the report, including black Protestants, white mainline Protestants, white Catholics, Hispanic Catholics and the religiously unaffiliated.
“Age is the great sorter on this issue,” Jones said.
The poll also queried respondents about an unsettled area of constitutional law: whether small businesses may refuse to serve LGBTQ people because of their religious beliefs. While 57 percent of Americans oppose allowing business to discriminate, respondents from two major religious groups — white evangelical Protestants and Mormons — support allowing it, at 55 percent and 54 percent, respectively.
Related

The report states that, "while determining causality between events in the news and public opinion is notoriously difficult," opposition to religiously based service refusals of gay and lesbian people declined “across virtually every demographic” in the two months after the highly publicized Masterpiece Cakeshop decision, in which the U.S. Supreme Court narrowly ruled in favor of religious baker Jack Phillips who had refused to bake a wedding cake for a same-sex couple.
PRRI debuted some of its findings earlier this month in order to highlight its conclusions regarding support for a bill resembling the Equality Act, which Democrats reintroduced earlier this month. The Equality Act would add “sexual orientation” and “gender identity” to the classes protected by the Civil Rights Act of 1964 and other civil rights laws.
