


Understanding what causes populist sentiment in the mass publics of Western democracies is one of the major challenges of contemporary research in political behavior. Several studies have found a strong relationship between populist attitudes and vote choice for populists (e.g., Schumacher and Rooduijn, Reference Schumacher and Rooduijn2013; Akkerman et al., Reference Akkerman, Mudde and Zaslove2014; Oliver and Rahn, Reference Oliver and Rahn2016; Van Hauwaert and Van Kessel, Reference Van Hauwaert and Van Kessel2018): citizens who rage against the political elite, put their trust in the people's “general will” and view politics in black-and-white terms are significantly more willing to support populist forces. Hence, the factors that explain the formation of such populist attitudes promise to provide important puzzle pieces to explain prominent populist “successes” in recent years.
The main explanations for the rise of populism have focused on two aspects (Mudde and Rovira Kaltwasser, Reference Mudde and Rovira Kaltwasser2018): economic (e.g., Kriesi et al., Reference Kriesi, Grande, Lachat, Dolezal, Bornschier and Frey2006; Rico and Anduiza, Reference Rico and Anduiza2019) or cultural grievance factors (e.g., Spruyt et al., Reference Spruyt, Keppens and Van Droogenbroeck2016; Norris and Inglehart, Reference Norris and Inglehart2019). However, a fast-growing literature has searched for the roots of populist success in political factors and representation crises (e.g., Hawkins and Rovira Kaltwasser, Reference Hawkins and Rovira Kaltwasser2017; Halikiopoulou and Vasilopoulou, Reference Halikiopoulou and Vasilopoulou2018). Here, we advance this agenda by investigating whether failures by national political parties to represent citizens’ policy positions trigger feelings of poor representation on the citizens’ side, which in turn increase citizens’ populist attitudes.
We design a survey experiment that randomly nudges respondents’ feelings of representation to estimate the causal effect of representation feelings on populist attitudes. Specifically, we exploit the run-up to the 2019 European Parliament (EP) elections to manipulate respondents’ beliefs about how well parties will represent them in the upcoming campaign. Using an instrumental variable (IV) setup, we first provide respondents with randomized information about national parties’ political positions on various issues salient during the EP election campaign, which affects their feelings of being represented by the parties. Subsequently, we measure the impact of feelings of representation on populist attitudes for individuals that were influenced by our treatment. We implement this design on nationally representative samples of the voting-eligible populations in 12 European Union (EU) countries, with a total of 23,257 respondents. This allows us to assess whether poor representation by parties in the context of a real election campaign can trigger (or not) populist attitudes among European citizens.
1. Populism and representation
After decades of debate, political science has recently coordinated on a common ideational definition of populism (Mudde and Rovira Kaltwasser, Reference Mudde and Rovira Kaltwasser2013; Rooduijn, Reference Rooduijn2018). In this definition, populism is seen as a “thin” ideology, a narrow set of connected ideas, according to which politics is a moral struggle between two antagonistic groups: “the people” and “the elite” (Mudde, Reference Mudde2004; Stanley, Reference Stanley2008). The people is homogeneous and unified instead of pluralist, essentially virtuous, and politics should be nothing but the implementation of the popular will. This people, however, is oppressed by the elite: a small coalition of powerful actors that illegitimately controls politics for its own benefit. Populists, therefore, call for systemic changes to take politics back from the elites and restore power to the people, while perceiving politics as a Manichaean struggle between the “good” and the “evil” (Hawkins, Reference Hawkins2010). A key property of the ideational approach to populism is that populist ideology can be adopted not only by parties but also by voters.
Akkerman et al. (Reference Akkerman, Mudde and Zaslove2014) follow this definition to argue that populism is a set of attitudes which voters hold about politics, to varying degrees. Other research has also shown that these attitudes are substantively different and better at predicting support for populist parties than attitudes regarding similar concepts such as political trust and political efficacy (Geurkink et al., Reference Geurkink, Zaslove, Sluiter and Jacobs2020). According to Hawkins et al. (Reference Hawkins, Carlin, Littvay and Rovira Kaltwasser2018), populist attitudes translate into voting for a populist candidate under two conditions: (1) a context of political crisis or endemic corruption, in which a populist description of politics as a rigged game in favor of the elites becomes credible; and (2) the presence of a viable populist candidate who frames political conflict in this way, and mobilizes dissatisfied citizens (see also Van Kessel, Reference Van Kessel2015). For that reason, proclaiming a crisis is a permanent feature in populist actors’ discourse (Rooduijn, Reference Rooduijn2014; Moffitt, Reference Moffitt2015).
Much theoretical research on populism stresses the ideology's core critique of representative democracy, and in particular, representative party government (e.g., Mair, Reference Mair2002; Caramani, Reference Caramani2017; Urbinati, Reference Urbinati2019). According to Canovan (Reference Canovan1999), the perpetual attraction of populism derives from inherent tensions within modern democracy itself. Although, on the one hand, democracy promises salvation through direct, spontaneous exercise of power by the people, on the other hand, a set of representative institutions is necessary to establish this very popular control in complex modern societies. Paradoxically, however, these representative institutions—above all, the exercise of government by political parties with dull party machines—“separate people and power in the very process of mediating between them” (Canovan, Reference Canovan2002: p. 28). Populist ideology exploits these tensions and points to the eternal gap between democracy as the realization of the popular will versus democracy as a set of representative institutions guaranteeing inclusive and transparent access to power. Its appealing message is that the people “have been shut out of power by corrupt politicians and an unrepresentative elite who betray our interests, ignore our opinions, and treat us with contempt” (Canovan, Reference Canovan2002: p. 27).
Due to their importance in European parliamentary democracies, parties represent the closest embodiment of the “unrepresentative elite” populism criticizes. We, therefore, expect that populist sentiment should be receptive to information about parties’ representative performance. The more parties appear as unrepresentative elites in voters’ eyes, the more heightened should populist sentiment become. Probably, the core representative function of parties relates to the input side of the political process, namely their programmatic offer (e.g., in election campaigns) that is supposed to ensure an equal aggregation of society's plural preferences (Caramani, Reference Caramani2017: p. 57). It is this function that parties are said to have increasingly given up during the last decades according to Katz and Mair's “party cartel thesis” (Katz and Mair, Reference Katz and Mair1995; Reference Katz and Mair2009; Mair, Reference Mair2013). In their view, parties collude and limit programmatic competition among each other due to several mechanisms, since collusion (a) is needed to share the resources of the state (e.g., enhance party financing); (b) facilitates cooperation in coalition systems, providing and ensuring access to the perks of office; and (c) is demanded by supranational politics (e.g., finding agreement in the EU) and incentivized by international market forces.
Mudde and Rovira Kaltwasser (Reference Mudde and Rovira Kaltwasser2018: p. 1679) argue that the economic and European debt crises following the Lehman Brothers bankruptcy in 2008 put further pressure on mainstream parties to act responsibly and collude on certain positions (e.g., austerity and euro rescue) instead of representing voters. But, the fact that this collusion was exploited by parties like SYRIZA in Greece or the AfD in Germany demonstrates that mainstream party cartels can be challenged, precisely by those populist actors whose ideology is believed to be fueled by mainstream parties’ representation failures. Multiparty systems with many parties and low barriers to entry arguably make it more likely that citizens will find a party representing their views. Nevertheless, strong collusion may leave some voters, especially those with non-centrist views, unrepresented.
In terms of Pitkin's (Reference Pitkin1967) seminal conceptions of representation, parties are said to fail with regard to substantive representation. They no longer serve as effective substitutes of the represented, acting in their interest and on their behalf. An important question in this regard is whether we view representation from the perspective of the individual or the collective. Although an individual may not find any party advocating the policy positions they favor, parties as a whole may be able to represent the policy positions of most voters, and our individual may belong to a small minority. However, studies on related topics have demonstrated that citizens mostly care about their personal representation rather than that of the collective when forming political attitudes (Mayne and Hakhverdian, Reference Mayne and Hakhverdian2017). Hence, we focus here on how parties’ failures to advocate the personal policy preferences of an individual fuel populist sentiment.
Despite the key role unrepresentative elites take in populist ideology, the empirical evidence for a link between the quality of party-based representation and populist attitudes has been quite limited to date. Castanho Silva (Reference Castanho Silva2018) presents some observational evidence linking the formation of grand coalitions—a particular form of party collusion—and populist party success, and Oliver and Rahn (Reference Oliver and Rahn2016) show that citizens’ perceptions of party responsiveness were particularly low in the United States preceding the election of Donald Trump as president (for further suggestive evidence from Latin America, see also Ruth and Hawkins, Reference Ruth and Hawkins2017). Nevertheless, all these studies are entirely observational and rather suggestive instead of explicitly investigating causality in the link between personal, perceived representation by parties and populist attitudes. The causal identification problem is aggravated by the potential of reversed causation: citizens’ perceptions of how well their preferences are represented by parties may well be endogenous to their populist predispositions and partisanship for a populist party. Hooghe and Dassonneville (Reference Hooghe and Dassonneville2018) and Rooduijn et al. (Reference Rooduijn, van der Brug and de Lange2016) present some evidence, based on panel data, in favor of a potential reinforcing effect between protest/populist voting and democratic dissatisfaction, a closely related concept to populist attitudes.
On the other hand, the current experimental literature on populism has focused almost exclusively on the effects of different frames on increasing or lowering populist attitudes. Bos et al. (Reference Bos, Schemer, Corbu, Hameleers, Andreadis, Schulz, Schmuck, Reinemann and Fawzi2020) look at how manipulating social identity frames affects populist attitudes, whereas others such as Hameleers et al. (Reference Hameleers, Bos and de Vreese2018) and Busby et al. (Reference Busby, Hawkins and Gubler2019) investigate how blame frames increase populist attitudes. Neuner and Wratil (Reference Neuner and Wratil2020), on their turn, experimentally look at the effects of politicians’ issue positions on populist vote choice. To our knowledge, we are the first trying to experimentally manipulate actual feelings of poor partisan representation that many theorists propose as a key driver of populist attitudes.
Although we have outlined the general link between feelings of representation and populist attitudes, we expect one variable to intervene. We hypothesize that the effect of perceived representation on populist sentiment will mostly play out in individuals whose populist predispositions are moderate or low. This is in line with Hawkins and Rovira Kaltwasser (Reference Hawkins and Rovira Kaltwasser2017), according to whom populist attitudes are triggered by the right contextual and communication cues, such as anti-elite frames (Hameleers et al., Reference Hameleers, Bos and de Vreese2018). Hence, individuals who already have a populist view of politics are unlikely to be affected by information on poor representation by parties, given their populist priors. In turn, among the pool of less populist citizens, learning about failures of representation could be the trigger for some individuals to turn toward a more populist view of politics. Such a “ceiling effect” has also been theorized and experimentally found by Busby et al. (Reference Busby, Hawkins and Gubler2019).
2. Case: the European elections 2019
We test our theoretical argument in the context of the 2019 EP elections, which present an excellent case for our purpose. A large body of literature has argued that populist sentiment in Europe is often mobilized by populist forces through appeals to public discontent about European integration (e.g., Taggart, Reference Taggart1998, Reference Taggart2000). In particular, the historically strong pro-integration consensus among most traditional European mainstream parties (e.g., Hooghe et al., Reference Hooghe, Marks and Wilson2002; van der Eijk and Franklin, Reference van der Eijk and Franklin2004) provides opportunities for populists to pinpoint the unrepresentative political elite that does not offer the full variety of voters’ views on EU politics (e.g., Eurosceptic views). This suggests that parties’ representative performance in EP elections as key opportunity to present voters with parties’ EU-related policy positions should be a particularly important driver of populist sentiment.
Although we are, therefore, focusing on a seemingly “likely case” for the triggering of populist attitudes, our empirical design has several features that increase its validity at the expense of the expected probability to find an effect of representation, especially compared to other possible survey-experimental designs. First, although all existing literature on the link between party-based representation and populist attitudes is entirely observational, we here use a survey-experimental design to increase internal validity. Specifically, we experimentally nudge feelings of representation to ensure that any relationship between them and populist attitudes is not endogenous.
Second, to ameliorate concerns about the ecological validity of survey experiments (e.g., as they may render concepts salient that may not be salient outside the survey context), our design and its implementation most closely approximate “real-world” conditions. We conduct our experiment in the run-up to an actual European elections campaign in January 2019 and present respondents with randomly drawn positions on political issues that became relevant and discussed in the media during the campaign. Although these choices arguably increase the validity of our findings, they mean that we need to move respondents’ perceptions of party positions against potentially high levels of pretreatment information. Some research has shown how average experimental treatment effects can be vastly reduced by pretreatment communications (e.g., Druckman and Leeper, Reference Druckman and Leeper2012).Footnote 1 In order to preserve the credibility of our treatments against potentially high levels of pretreatment communications, we do not identify the positions of specific parties, but provide information on a systemic level as explained below.
In total, we therefore aim to reduce endogeneity bias through the survey experiment, while increasing this method's ecological validity by running the study during an actual campaign on actual campaign issues.
3. Experimental design
The basic idea of our design is to experimentally manipulate information about parties’ policy positions on issues, which should affect respondents’ feelings of the quality of representation by parties, and to test whether triggered differences in representation feelings affect populist attitudes. Practically, our survey-experimental design works as follows:
First, respondents are asked to provide their substantive opinion on two (randomly drawn) out of eight political issues which we identified as relevant in the 2019 European elections campaign. One example issue is EU-level spending on social concerns. Figure 1 is a screenshot of how respondents saw this issue question. For each issue, respondents have three options to express their personal positions. Two options mark opposite directions on an issue and one marks the status quo. In the case of social spending, respondents can opt for increasing, decreasing, or keeping it at current levels. Respondents also indicate how much they care about the issue.Footnote 2 After the first issue, respondents provide their personal position on the second issue.Footnote 3

Fig. 1. Screenshot from online experiment—respondent's position (example issue “social spending”)
Our selected political issues were: Brexit negotiations; payments to member states accused of violating democratic norms; financial support to member states in economic trouble; financial support to farmers; restrictions on factory farming in the EU; military cooperation between member states; EU-level spending on social concerns; and EU influence on asylum policy. These issues cover a wide range of policy areas in which the EU is active, including regulatory (e.g., restrictions on factory farming) versus distributive policies (e.g., financial support to member states in economic trouble).
Second, after having recorded their personal preferences on the two issues, we present respondents with randomized scenarios of national parties’ policy positions on these issues. To prevent any form of deception about parties’ actual policy positions, we exploit the fact that we conducted the experiment in January 2019, just before the election campaign started, which renders it theoretically possible that parties could take any positions during the upcoming weeks.Footnote 4 Specifically, we tell respondents on an introductory screen: “Thanks for your opinion! In the following, we are going to describe scenarios. They concern the positions that parties could take on these two issues during the upcoming European elections. At the moment, these scenarios are hypothetical. However, it is possible that parties will take these positions during the election campaign. Please read the details very carefully and tell us how you would react to these positions.”
Next, for each of their two policy issues, respondents are shown different scenarios as to how parties may position themselves. The scenarios described vary between the options presented in Table 1, still using social spending as an example. All scenarios are introduced with the following text: “[ISSUE] will be a key issue in this year's European election campaign. Some people expect that the major [COUNTRY ADJECTIVE] parties will adopt the following positions on this issue.” The scenarios in Table 2 themselves simply display again in tabular form the different preference options on a policy issue (in this example, “Keeping social spending at current levels,” “Increasing social spending,” and “Reducing social spending”) and provide information to respondents on how many parties in their country have taken the respective positions. While scenario 1 depicts a situation in which only one of the three positions is taken by “All parties,” in scenario 3 all positions are represented by “At least one party.” Scenario 2 is an intermediate situation in which two of the three policy positions are taken by “At least one party” each, and the third is represented by “No party” in the system.
Table 1. Illustration of experimental vignettes (example Issue “social spending”)

Note: The ordering of the positions in each scenario is randomized with equal probabilities.
It is important to highlight that the column “Taken by” shows exact reproductions of what respondents see, i.e., we tell respondents that a position is taken by “All parties,” “At least one party,” or “No party” rather than mentioning any specific names of national parties. Moreover, we randomize the order of the positions in the “Position” column, i.e., which position is shown at the top, middle, and bottom. For our example issue, “Reducing social spending” appears at the top in only 1/3 of the cases and as middle or bottom position in another 1/3 of the cases each, creating six different orderings within each scenario. This ensures that the probability of a respondent to have a party representing her personal preference is independent of the respondent's preference itself.
As 1/3 of all personal preferences are represented in scenario 1, 2/3 in scenario 2, and any personal preference in scenario 3, the average probability of having a personal preference represented by at least one party is 2/3. In order to address this imbalance in our treatment, we fix the probabilities of showing scenarios 1, 2, and 3 to 0.5, 0.25, and 0.25, respectively. This results in a probability of being represented by at least one party of around 58 percent, and of not being represented by any party at around 42 percent.
Below the displayed vignette, we survey respondents’ feelings of representation: “Based on this information, on a scale from 1 to 7, how well do you personally feel represented by the parties on this issue?,” where “1” means “Not at all represented” and “7” is labeled as “Very well represented.” In addition, we also implement a manipulation check by asking respondents how likely they think it is that parties will take the displayed positions (7-point scale). This allows us to track whether respondents pay attention to the treatments and to gage the overall plausibility of the treatments. Finally, we measure populist attitudes as our dependent variable with the scale developed by Castanho Silva et al. (Reference Castanho Silva, Andreadis, Anduiza, Blanuša, Morlet Corti, Delfino, Rico, Ruth, Spruyt, Steenbergen and Littvay2018),Footnote 5 which consists of nine items, with three representing each conceptual dimension of populism: (1) people-centrism, (2) anti-elitism, and (3) a Manichaean outlook of politics. To keep the experiment practical, we randomly select for each respondent one item for each subdimension—three in total—that are rated on a 7-point agree–disagree scale (for details on the items, see below). After answering the outcome questions on the first political issue, respondents are queried on the second issue with a new randomly drawn vignette. In the second round, the three populist attitudes items are drawn from the two remaining items per dimension that were not shown in the first round. The respondents’ view of one experimental round is illustrated with the social spending issue in Figure 2.
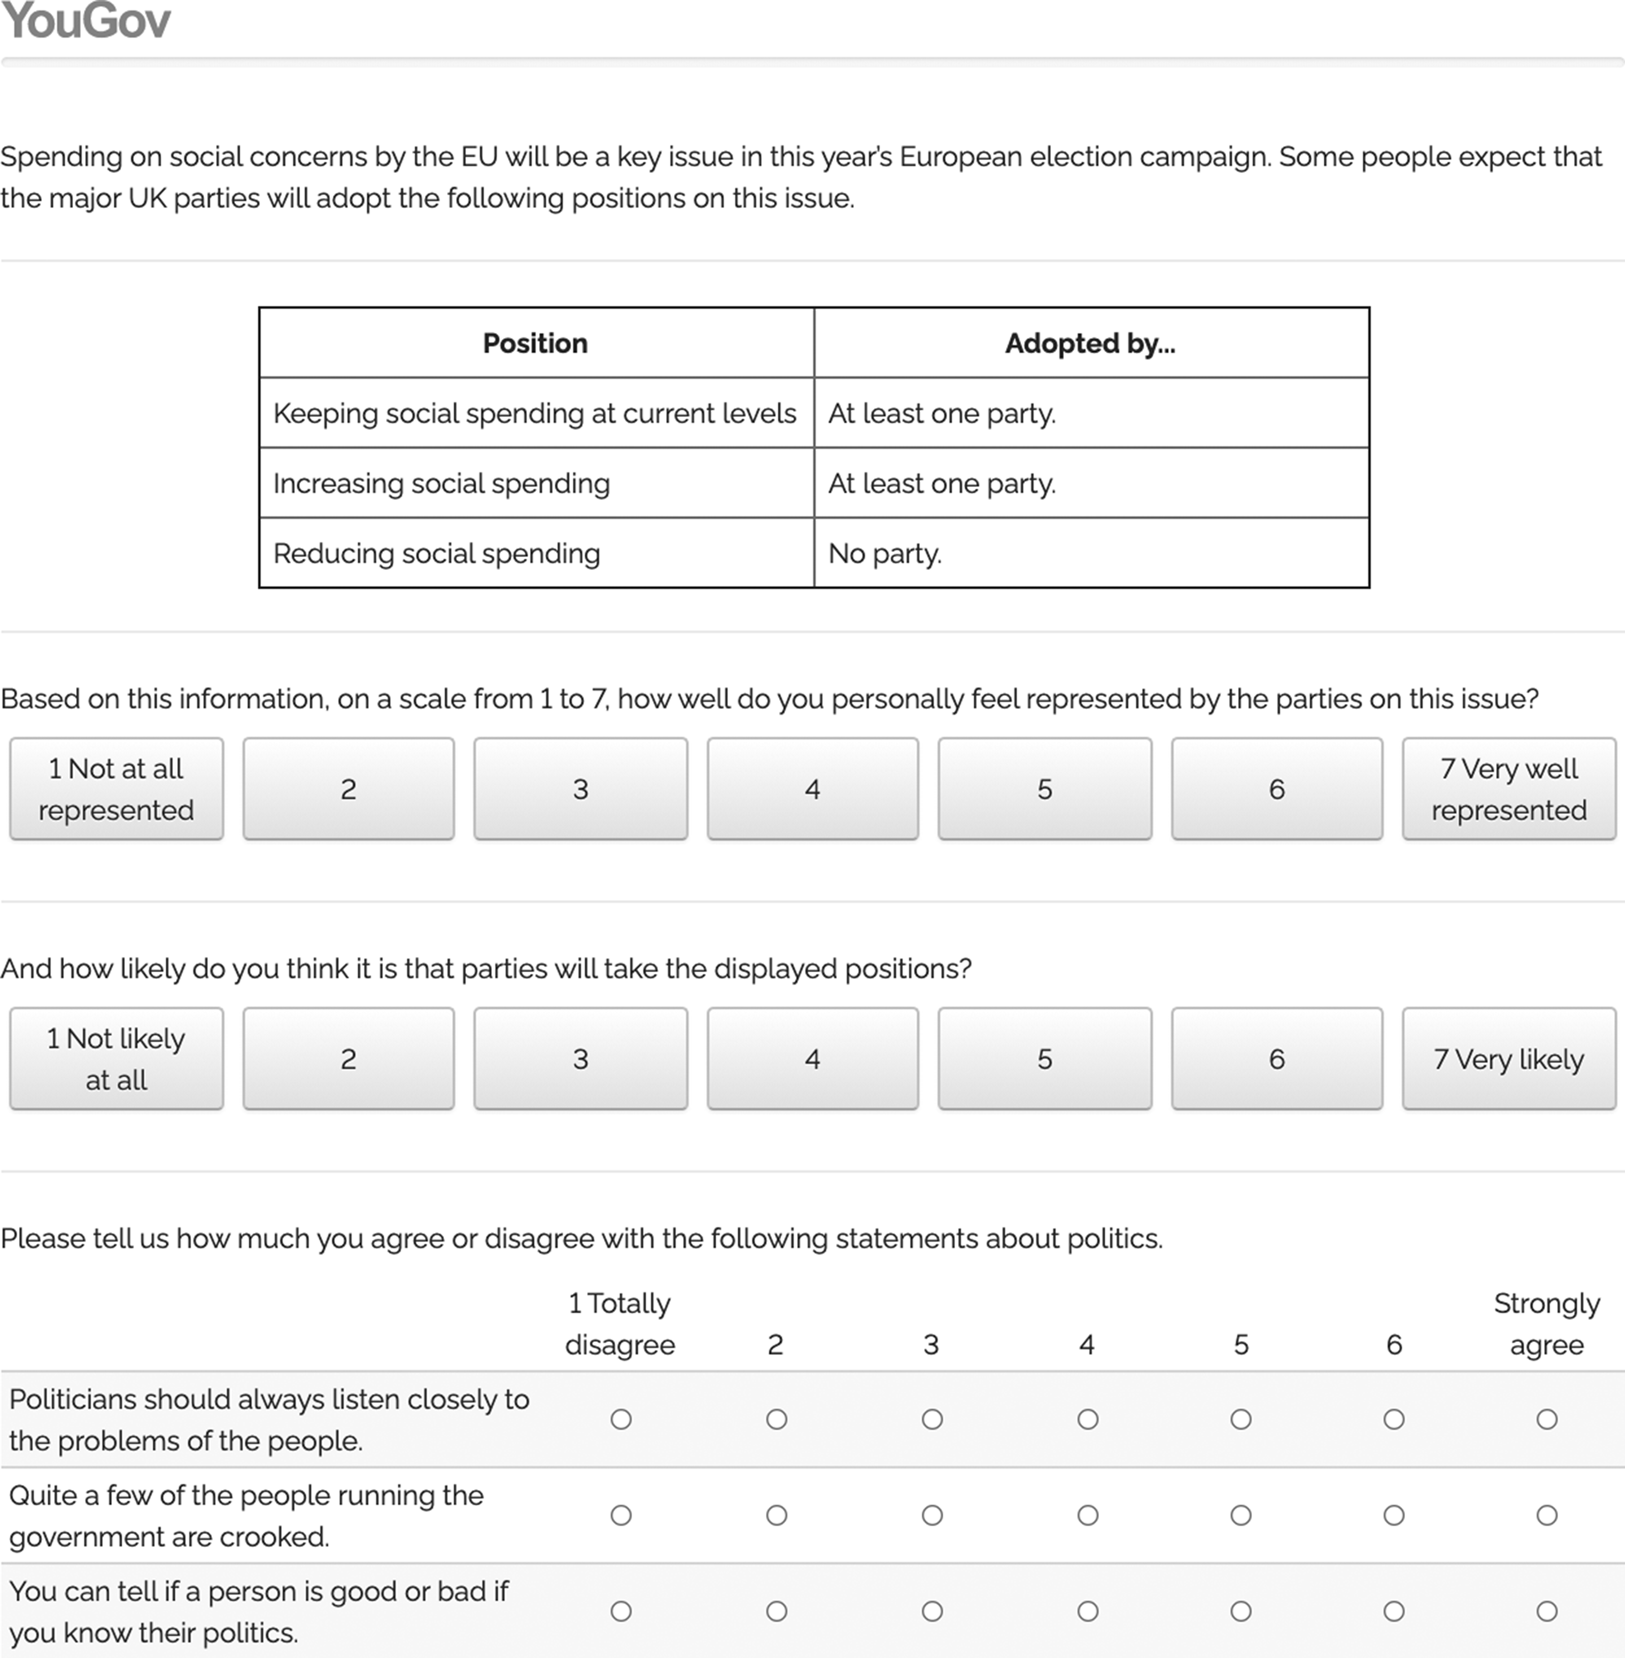
Fig. 2. Screenshot from online experiment—parties’ positions (example issue “social spending”).
This experimental design has several advantages. On the one hand, although our focus is on whether parties’ failure to represent an individual's personal policy preference increases populist attitudes, we do not blatantly tell respondents whether their personal preference is represented by parties, but respondents have to draw such conclusions from the information on parties’ positions. This minimizes the demand characteristics of our experiment (or “good-subject effects”), i.e., subjects’ perceptions that the experiment follows a specific purpose and their motivation to perform accordingly as “good subjects” (Orne, Reference Orne1962). On the other hand, our choice of three scenarios with varying levels of collective representation (i.e., either only one, two of three, or all three policy positions are taken by parties) allows us to investigate whether the effect of representation of personal preferences is potentially moderated by whether the opinions of others are also (not) represented by parties (see below and Online Appendix M).
Moreover, we deliberately do not tell respondents which specific national parties have taken which positions. Although this may allow for more heterogeneity in how respondents interpret our vignettes, it supports the credibility of our treatments as respondents are primed to think about parties’ positions in general rather than the positions of specific parties (of which they may know some). It also allows us to implement the same stimuli materials across countries. Finally, the vignettes draw no distinction between mainstream parties and populist parties, they simply allude to “major parties,” which in some countries (e.g., Austria, Denmark, and France) will include populist parties from the perspective of most respondents. This is in line with our interest in ascertaining how party-based representation affects populist attitudes, irrespective of potential mobilization activities of populist forces. These could be brought into the picture with amended designs.
4. Identification, data, and measurement
In order to estimate the causal effect of feelings of representation on populist attitudes, we use IV estimations. Specifically, we operationalize the instrument as a dummy variable indicating whether the respondent's preferred position on an issue is taken by at least one party (1) or not by any party (0) in the displayed scenario/vignette. In the first stage, this instrument is supposed to influence our independent variable, feelings of representation. In the second stage, we estimate the effect of feelings of representation on populist attitudes. Importantly, this IV setup identifies the complier average causal effect (CACE). In our case, the CACE is the causal effect of feelings of representation on populist attitudes for those respondents whose feelings of representation are influenced by our experimental vignettes.
All IV identifying assumptions are either guaranteed or plausible to hold under our design. First, the independence of the instrument from the independent variable and the potential outcomes is guaranteed through randomization of the instrument, i.e., our vignettes. Second, the exclusion restriction that the instrument does not affect the outcome through other routes than the independent variable is plausible. In particular, in the experimental context, we steer respondents to think about their feelings of representation and thereby render it relatively unlikely that other respondent-level concepts relevant to populist attitudes are triggered by our vignettes.Footnote 6 Third and relatedly, our instrument is also relevant and induces substantial variation in the independent variable, as respondents’ feeling of representation is steered by the survey context to be strongly influenced by the vignette of party positions displayed (see Online Appendix J for first-stage estimates).Footnote 7 Nevertheless, besides the CACE we below also report estimates of an intention-to-treat (ITT) effect, an estimator which captures the direct effect of the experimental vignettes on populist attitudes. The ITT is essentially a causal effect averaged over all respondents, irrespective of their level of compliance with the instrument.
4.1 Data
As we expect pretreatment information about parties’ positions to limit our experimental effects and as the CACE is identified through a two-stage estimation procedure (two-stage least squares, 2SLS), we need a relatively large sample to attain sufficient statistical power to test our argument. Specifically, we expect an effect of feelings of representation on populist attitudes in the order of magnitude of 0.05 to 0.10 standard deviations for a standard deviation change in feelings of representation. Power simulations in Figure A.1 in Online Appendix C reveal that a sample of at least n ≈ 25,000 experimental rounds is required to detect an effect of 0.05 in our IV setup, with a power of β = 0.90, assuming a very strong first stage with an effect size of 0.7 standard deviations of our treatment on feelings of representation.Footnote 8 Moreover, since we also expect heterogeneity in the CACE by pretreatment populist attitudes, we located our plausible sample size in the region of n > 40,000 experimental rounds—meaning, more than 20,000 respondents each completing two rounds of the experiment. Given our focus on European elections, we decided that a cross-national survey would be particularly useful for our purpose, distributing our sample over several countries, without an expectation that we would be able to identify effect size differences between countries.
Our experiment was included in a 12-country survey co-designed and financed by the Bertelsmann Stiftung, a German private foundation, and conducted at the start of the European elections campaign in January 2019. The countries are Austria, Denmark, France, Germany, Greece, Hungary, Italy, Netherlands, Poland, Spain, Sweden, and the UK, which were selected to reflect geographical and political diversity. One could expect that the plausibility of scenarios for respondents will vary depending on the number of parties in a system, and we investigate such expectations (see below). The surveys were administered online by the survey firm YouGov, with nationally representative samples of around 2,000 respondents per country and total N = 23,257, or n = 46,513 experimental rounds. Descriptive statistics for demographic characteristics of each country are provided in Online Appendix D. The translations of the English master questionnaire were performed by a professional translation service and checked by political scientists.Footnote 9
4.2 Measurement of populist attitudes
Our main dependent variable is populist attitudes, which we measure using the Castanho Silva et al. (Reference Castanho Silva, Andreadis, Anduiza, Blanuša, Morlet Corti, Delfino, Rico, Ruth, Spruyt, Steenbergen and Littvay2018) scale. This scale has been extensively tested and validated and is particularly suited for cross-national research (Castanho Silva et al., Reference Castanho Silva, Jungkunz, Helbling and Littvay2020). The wordings of all items, along with descriptive statistics, are provided in Table 2. In Online Appendix B, Table A.2, we show a measurement model for these items using a three-factor confirmatory factor analysis, with metric invariance (i.e., factor loadings constrained to be the same across countries). It shows that the model is invariant, and thus this measurement can be used comparatively across countries (Davidov et al., Reference Davidov, Meuleman, Cieciuch, Schmidt and Billiet2014). We use respondents’ average response to the three items they saw after an experimental round as the dependent variable. Moreover, in Online Appendix J we also present results using what Wuttke et al. (Reference Wuttke, Schimpf and Schoen2020) refer to as the “Goertzian” approach: instead of the average, this approach uses the minimum response to the three items to ensure that only respondents who score highly on all three items are considered populists. Results remain substantively the same.Footnote 10
Table 2. Descriptive statistics for the populist attitudes dependent variable
Note: Total N = 23,257. All questions asked on a 1–7 strongly disagree–strongly agree scale. Items marked with a * have been reverse-coded to calculate the mean (i.e., for them 1 = strongly agree and 7 = strongly disagree).
Before the experiment, the survey also includes another populist attitudes battery to measure pretreatment populism, which we expect to moderate the effect of feelings of representation on populist attitudes. In order to avoid anchoring bias from asking the exact same question twice and given the availability of several scales measuring the same concept, we rely on eight items that are completely different from those used posttreatment. Six of the eight pretreatment items come from the widely used (Akkerman et al., Reference Akkerman, Mudde and Zaslove2014) battery, and we include an additional two from Van Hauwaert and Van Kessel (Reference Van Hauwaert and Van Kessel2018). They are rated on a 5-point agree-disagree scale, and full item wordings with a measurement model are in Online Appendix B, Table A.1. Pretreatment populist attitudes are operationalized as the mean of the eight items.Footnote 11
5. Results
The first set of results is reported in Figure 3. The lower part of the figure contains CACE estimates from IV estimations via 2SLS, for which the experimental treatment [whether any party represents the respondent's position (1) or not (0)] is an instrument for feelings of representation, which predict populist attitudes. The CACE is the estimate in the second stage capturing the causal effect (for compliers) of feelings of representation on populist attitudes.Footnote 12 In the upper part of the figure, we report ITT estimates, which capture the direct effect of our experimental treatment on populist attitudes. These are estimated using robust OLS. All models include fixed effects for countries with dummy variables. Moreover, since each of our respondents took part in two experimental rounds (evaluating party positions on the two political issues), we also add a round fixed effect.
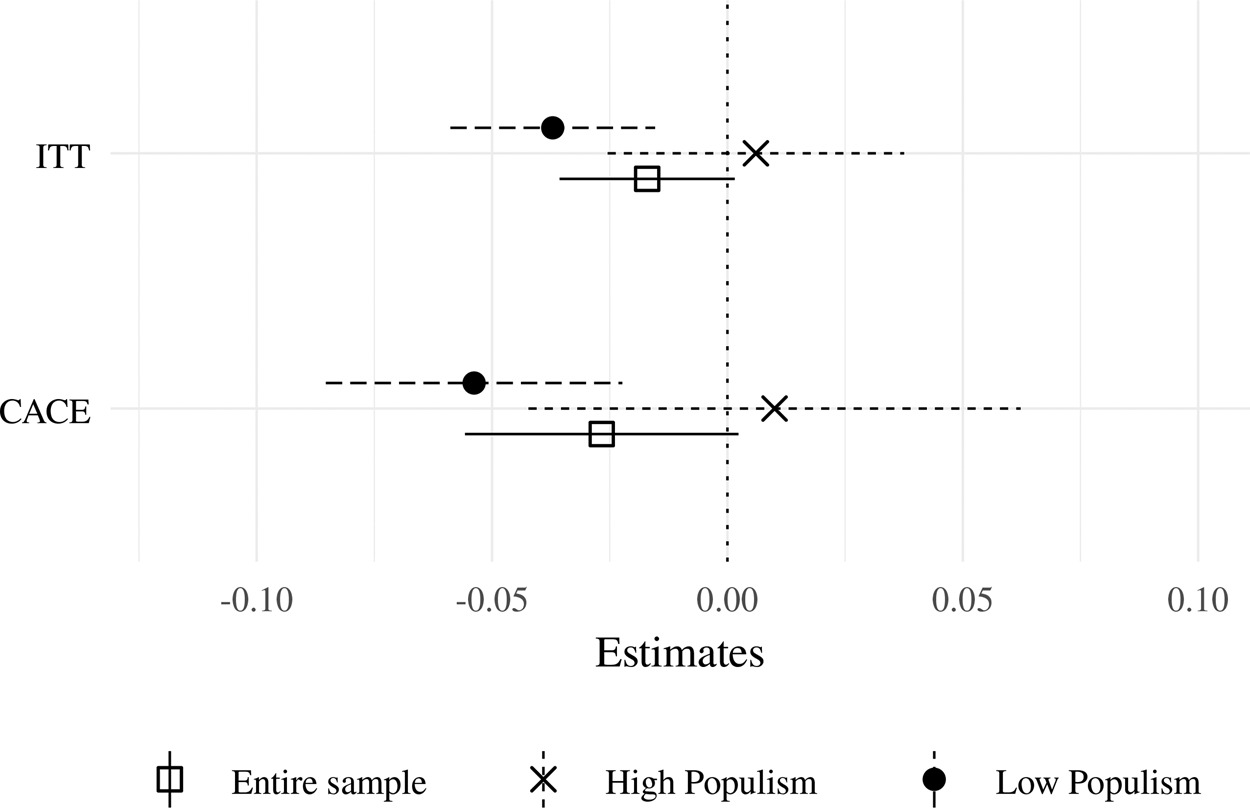
Fig. 3. Effect of party representation on populist attitudes. Note: Dependent variable: posttreatment populist attitudes (mean of three items). CACE: complier average causal effect of how well the respondent feels represented by parties on that issue; ITT: intention-to-treat Effect on whether at least one party is shown to hold the respondents’ position on an issue. Models include country and round dummy fixed effects. “High versus Low Populism” defined as above or below the 66th percentile of the pretreatment populist attitudes measure. n (entire sample): 46,513; n (high populism): 16,671; n (low populism): 28,356. Two rounds per respondent. 95 percent confidence intervals calculated using robust standard errors.
The results reveal that on average there is no statistically significant effect of party representation on populist attitudes when looking at the entire sample with all respondents pooled together. The CACE as well as the ITT effect are indistinguishable from zero using the standard ${\rm p}< {0}.05$ level (CACE: β = −0.027, SE = 0.015; ITT effect: β = −0.017, SE = 0.009). However, as we expect that pretreatment populist attitudes could influence the relationship between representation and populist attitudes, we split our sample in the next step, at the 66th percentile of pretreatment populist attitudes within each country, defining respondents above this threshold as having “High Populism” and those below “Low Populism.” This cutoff point mainly serves illustration purposes. It reveals a clear significant effect of party representation on populist attitudes for the two thirds of respondents with weaker populist attitudes in each country. In the robustness checks below, we discuss that we obtain substantively the same result with a variety of alternative cutoff points. With the 66th percentile cutoff, the CACE is estimated as −0.054, which represents a decrease of 0.057 standard deviations in populist attitudes for every unit increase in feelings of good representation due to being represented by a party in the experimental vignettes. The ITT effect is a bit smaller at −0.037. In contrast, the representation effects are statistically indistinguishable from zero for respondents with relatively strong pretreatment populist attitudes.Footnote 13 This is in line with the findings by Busby et al. (Reference Busby, Hawkins and Gubler2019), who argue for a ceiling effect in populist attitudes, whereby treatments only work for individuals with low or moderate levels of pretreatment populism.
Since the populist attitudes scale we use is multidimensional, it allows us to investigate whether party representation affects all dimensions of populist attitudes equally. Recall that in each round of the experiment, respondents rate one item from each dimension. Hence, to estimate the effect of representation on each dimension of populism we simply amend our dependent variable and model the response to the populist attitude item representing people-centrism, anti-elitism, or a Manichaean outlook on politics, respectively (instead of the mean value across dimensions used above). Results in Figure 4 show that, for the entire sample, the lack of effects of representation on populist attitudes are not hiding significant heterogeneity across the dimensions. Although the coefficients are larger for anti-elitism than for people-centrism, they are close to but not significant at the conventional 5 percent level. When looking separately at respondents with high versus low pretreatment populist attitudes, we see that the effect of feelings of representation in the group with low pretreatment populist attitudes primarily runs through anti-elite sentiment (CACE = −0.088, ITT = −0.061), and to some extent through the Manichaean outlook (CACE = −0.056, ITT = −0.039). Substantively, these results indicate that, when individuals with low pretreatment populism feel poorly represented because of the party vignettes we show to them, they become more anti-elitist and have more of a perception that politics is a struggle between good and evil. In contrast, for respondents with high levels of pretreatment populism, the CACEs on all dimensions of populist attitudes are indistinguishable from zero. Importantly, feelings of representation do not seem to affect people-centrism at all—neither for the full sample nor for any of the split samples.
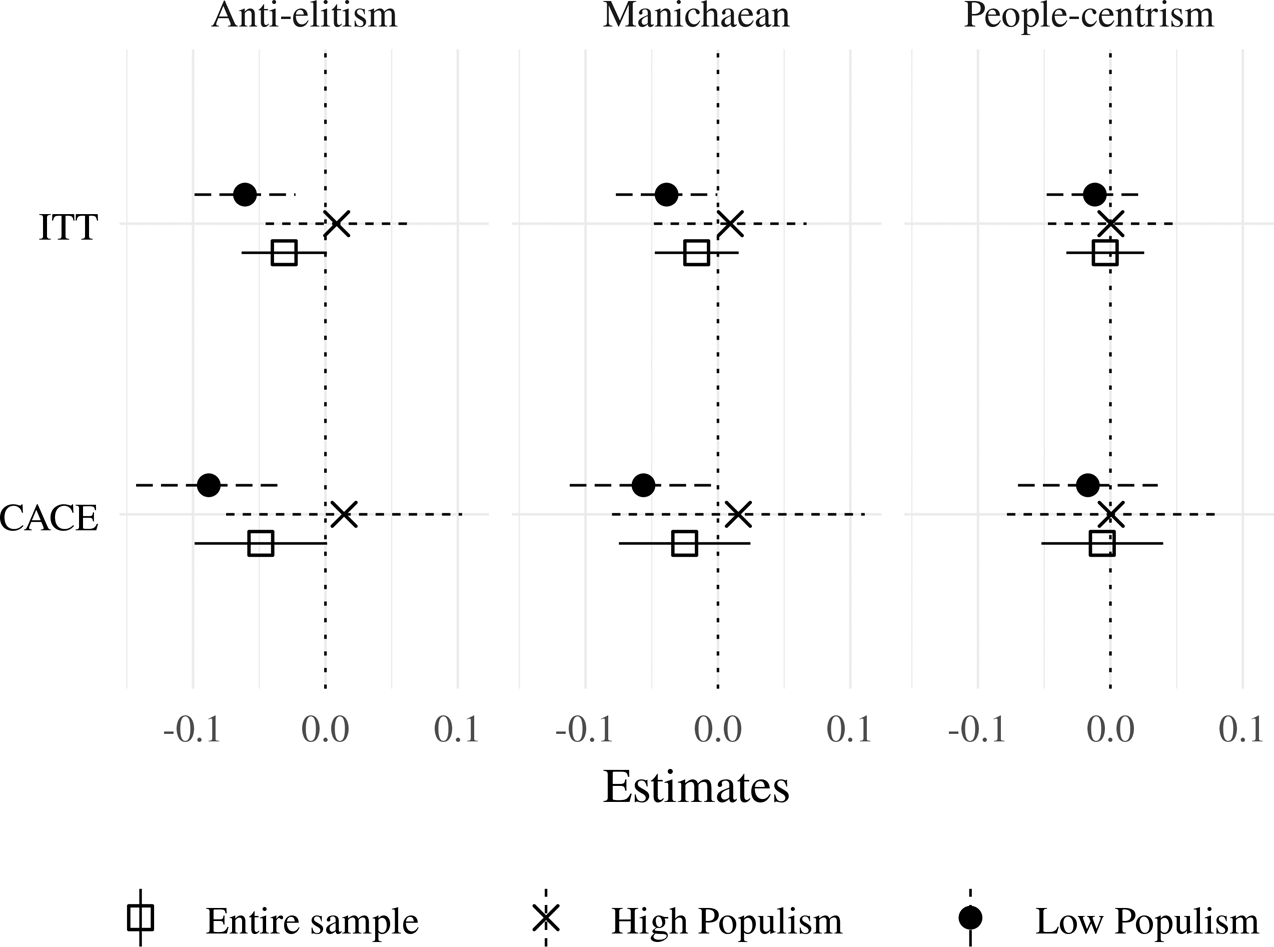
Fig. 4. Effect of party representation on each dimension of populist attitudes. Note: Dependent variables: answer to the relevant item for each dimension of populism. CACE: complier average causal effect of how well the respondent feels represented by parties on that issue; ITT: intention-to-treat effect on whether at least one party is shown to hold the respondents’ position on an issue. Models include country and round dummy fixed effects. “High versus Low Populism” defined as above or below the 66th percentile of the pretreatment populist attitudes measure. n (entire sample): 46,513; n (high populism): 16,671; n (low populism): 28,356. Two rounds per respondent. 95 percent confidence intervals calculated using robust standard errors.
5.1 Robustness and manipulation checks
We perform several robustness and manipulation checks to ascertain the validity of our findings. First, we test the sensitivity of results to the definition of the cutoff point between high versus low pretreatment populism (at the 66th percentile in our baseline models above). For this purpose, we vary the cutoff in percentile steps from the 15th, which only defines the 15 percent of respondents with the weakest populist attitudes as having “Low Populism,” to the 85th percentile, putting 85 percent in the “Low Populism” sample. Estimates for the CACE depending on the cutoff definition are plotted in Figure A.6 in Online Appendix H. For the “Low Populism” sample the CACE is negative and significant from the 45th percentile onward, when only the bottom 45 percent on the populist attitudes scale are counted as having low populism, and remains so all the way until the 85th percentile. Although due to power issues the CACE is arguably less likely to be significant if the low-populism sample is very small, the fact that we find the effect even when defining 85 percent as having low pretreatment populism shows that only respondents with very high levels of pretreatment populism do not react to our experimental trigger. In turn, in the “High Populism” sample we never find a statistically significant CACE, irrespective of how large this sample is.
Second, we check the robustness of our findings on individual representation to different configurations of collective representation. Although scenario 1 in Table 1 represents a situation in which collective representation is poor on average, because only one position is represented by parties, scenario 3 offers maximal collective representation with every position being represented. Scenario 2 is in-between the two others. To analyze whether our results are dependent on the level of collective representation, we re-estimate the CACE and the ITT effect splitting the sample by vignette scenario as well as by pretreatment populism. The results are provided in Online Appendix M. Although none of the effects is statistically significant, given smaller sample sizes, the effect sizes are generally larger for the scenario 2 sample, in which parties take two of the three positions instead of colluding on a single position. In this scenario, respondents who are not represented see that their position was the only one not represented, whereas in scenario 1 two positions are not represented. Our experimental effects appear largely dependent on rather high levels of collective representation. Hence, the effects of representation we measure here cannot be explained by respondents being concerned about poor collective representation (e.g., parties not offering any choices). Instead, they appear genuinely caused by concerns about personal representation.
Third, as a manipulation check, respondents were also asked after each round how likely they think it is that parties will take the displayed positions. In Figure A.3 in Online Appendix F, we plot the average belief in the treatment per country for each scenario. Notwithstanding potentially idiosyncratic country effects, we would expect that scenario 3 in which all positions are represented by at least one party should become more plausible for respondents compared to the other scenarios in multiparty rather than two-party or two-bloc systems. We find some evidence for this expectation, as the scenario with all positions taken by parties is comparatively more believed by Austrian, Danish, Dutch, German, and Greek respondents, whereas it is less plausible to Hungarian, Spanish, Swedish, or UK respondents. Some other countries (such as Italy or Poland) fit the picture less. This is suggestive evidence that respondents pay attention to our treatments in meaningful ways.Footnote 14
6 Discussion and conclusion
Although most explanations for the rise of populism in Western democracies focus on economic or cultural factors (Mudde and Rovira Kaltwasser, Reference Mudde and Rovira Kaltwasser2018), parties’ deficient representative performance has been widely theorized as a key cause of populist sentiment. However, providing compelling evidence for this link is extremely hard given the likely endogeneity of representation perceptions to populist sentiment. To our knowledge, we have presented here the first causally identified evidence for an effect of feelings of representation on populist attitudes, at least in individuals with low pre-existing levels of populism. This effect primarily runs through anti-elite sentiment, and secondarily through the Manichaean outlook—the two dimensions of populism focused on elites’ behavior. In turn, people-centrism is unaffected by feelings of party representation.Footnote 15
Our findings have important implications. First, they suggest that failures of party-based representation could be a prime cause of the current wave of populism in Western democracies (e.g., Mair, Reference Mair2002; Caramani, Reference Caramani2017; Urbinati, Reference Urbinati2019). Hence, we provide an important piece of evidence suggesting that the alleged “cartelization” of Western European political parties (Katz and Mair, Reference Katz and Mair1995), who are said to restrict programmatic competition among themselves, is animating populist sentiment. Second, conceiving of populist attitudes as an indicator of diffuse systems support, our findings speak to a growing experimental literature on the effects of representation on political system support. Although most of this literature has paid attention to outputs (i.e., how well citizens’ preferences are reflected in political decisions, e.g., Arnesen and Peters, Reference Arnesen and Peters2017; Esaiasson et al., Reference Esaiasson, Gilljam and Persson2017), we provide important evidence that the input side (i.e., how well citizens’ preferences are fed into the party system) can also have consequences for system-related attitudes.
Third, our findings provide insights for political parties and practitioners. The existing experimental literature on populism focuses primarily on how different communication frames can increase/decrease respondents’ populist attitudes (e.g., Hameleers et al., Reference Hameleers, Bos and de Vreese2018; Busby et al., Reference Busby, Hawkins and Gubler2019; Bos et al., Reference Bos, Schemer, Corbu, Hameleers, Andreadis, Schulz, Schmuck, Reinemann and Fawzi2020). To our knowledge, we present the first experimental test on how the actual substance of parties’ preferences affects citizens’ populist attitudes. Specifically, our results emphasize the necessity for parties to (1) listen to their voters and represent their positions, and (2) not to embrace a “There Is No Alternative” discourse. If mainstream parties want to contain populist attitudes, it is imperative that they present real alternatives to citizens. A vibrant exchange of opposing ideas is essential to democratic life and, as it appears, can help prevent the diffusion of populist sentiment. In turn, our null findings for individuals with high pre-existing populism also highlight that once populist attitudes are heightened, it is quite hard to “put the genie back in the bottle.” At least, we do not find any evidence that parties’ representative performance can do this trick.
Supplementary material
The supplementary material for this article can be found at https://doi.org/10.1017/psrm.2021.63.
Acknowledgments
The authors thank Robert Vehrkamp and Lars Bischoff from the Bertelsmann Stiftung for the excellent collaboration on this project. The data collection for this project was financed by the foundation. We acknowledge the help from all those who have read and commented on earlier versions of this paper, including Lucy Barnes and other participants of workshops at University College London and Aarhus University; Kirk A. Hawkins and participants of the 2019 APSA Annual Meeting; Kurt Weyland, Masaru Nishikawa, Takeshi Hieda, and participants of the Slavic-Eurasian Research Center Summer Symposium at Hokkaido University (July 2019); Steven Majstorovic and participants of the 2019 MPSA Annual Meeting; Vittorio Merola and participants of the 2019 EPSA Annual Meeting; Sven Oliver Proksch, Franziska Pradel, and Jens Wäckerle. We also thank Cristóbal Rovira Kaltwasser with whom we developed the survey in which this experiment was fielded. The authors acknowledge financial support from the Center for Social and Economic Behavior (C-SEB) from the University of Cologne.


 Open access