

Abstract
Riverine exports of organic and inorganic carbon (OC, IC) to oceans are intricately linked to processes occurring on land. Across high latitudes, thawing permafrost, alteration of hydrologic flow paths, and changes in vegetation may all affect this flux, with subsequent implications for regional and global carbon (C) budgets. Using a unique, multi-decadal dataset of continuous discharge coupled with water chemistry measurements for the Mackenzie River, we show major increases in dissolved OC (DOC) and IC (as alkalinity) fluxes since the early 1970s, for a watershed that covers 1.8 M km2 of northwestern Canada, and provides substantial inputs of freshwater and biogeochemical constituents to the Arctic Ocean. Over a 39-year period of record, DOC flux at the Mackenzie mouth increased by 39.3% (44.5 ± 22.6 Gmol), while alkalinity flux increased by 12.5% (61.5 ± 60.1 Gmol). Isotopic analyses and substantial increases in sulfate flux indicate that increases in alkalinity are driven by accelerating sulfide oxidation, a process that liberates IC from rock and soils in the absence of CO2 consumption. Seasonal and sub-catchment trends suggest that permafrost thaw plays an important role in the observed increases in DOC and alkalinity: sub-catchment increases for all constituents are confined to northern, permafrost-affected regions, while observed increases in autumn to winter are consistent with documented landscape-scale changes that have resulted from changing thaw dynamics. This increase in DOC and sulfide-derived alkalinity represents a substantial intensification of land-to-ocean C mobilization, at a level that is significant within the regional C budget. The change we observe, for example, is similar to current and projected future rates of CO2 consumption by weathering in the Mackenzie basin.
Export citation and abstract BibTeX RIS
1. Introduction
Aquatic environments integrate the biogeochemical characteristics of the landscapes that surround them, and are therefore important indicators of change occurring across broad spatial scales. Along the land-to freshwater-to ocean continuum, aquatic systems are also reactive environments, where biological and geochemical processes are enhanced by the presence of water. In the circumpolar north, warming and permafrost thaw have the potential to alter the land–freshwater–ocean transfer of biogeochemical constituents, and thus affect ecosystem function and broad-scale biogeochemical cycling (Frey and McClelland 2009). Although there is a clear expectation that mobilization, and processing, of organic and inorganic carbon (OC, IC) will change in northern regions with changing climate (Beaulieu et al 2012, Tank et al 2012a, Schuur et al 2015), our understanding of the magnitude of land-to-ocean change over recent decades is considerably hampered by a dearth of long-term data.
Permafrost thaw is projected to expose vast amounts of OC to mineralization (Schuur et al 2015). While thaw-associated processes are commonly expected to increase land-to-water OC mobilization (Guo et al 2007, Feng et al 2013, Vonk et al 2013), they can also decrease concentrations and delivery of terrigenous OC to aquatic environments (Walvoord and Striegl 2007, Kokelj et al 2009), depending on the thickness of soil organic layers, the mineral content of thawing soils, and the alteration of subsurface flow paths as permafrost degrades. Direct temperature effects on primary production and soil respiration can also affect OC transfer to aquatic systems (Laudon et al 2012). Once terrigenous OC reaches the aquatic continuum, reactions within the dissolved (DOC) component of the OC pool cause large fractions of DOC to be mineralized to CO2, rather than transported passively as a continued C sink (Cole et al 2007, Battin et al 2008, Alling et al 2010). The magnitude of the resulting CO2 release is large enough to affect the C-cycle at regional and global scales (Cole et al 2007), with permafrost-derived DOC appearing to be particularly susceptible to mineralization (Vonk et al 2013, Spencer et al 2015).
While DOC mineralization ultimately releases CO2 to the atmosphere, dissolved IC (DIC), mostly as bicarbonate  typically represents a CO2 sink, following chemical weathering of silicates (e.g., idealized equation (1)) and carbonates (e.g., equation (2), dolomite) by carbonic acid (H2CO3; 'dissolved CO2'):


In northern regions, increasing CO2 concentrations, greater mineral–water interactions following permafrost thaw, and climate-induced changes in plant distribution and physiological function could all increase chemical weathering, and thus the strength of the geological CO2 sink (Berner 1998, Frey and McClelland 2009, Beaulieu et al 2012, Tank et al 2012a). At the timescale of  residence in the ocean (∼104 years; Berner and Berner 2012), reverse weathering (equation (2), reversed) causes half of weathering-produced
  to be returned to the atmosphere as CO2. Thus, carbonate weathering by H2CO3 is CO2 neutral beyond this timespan, but a CO2 sink at contemporary timescales. Recent, regionally-documented increases in chemical weathering indicate that these reactions can respond to climate, and affect regional C budgets, at decadal timescales (Gislason et al 2009).
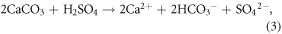
Although it is often overlooked in weathering budgets (e.g., Beaulieu et al 2011), H2SO4 can also donate protons to weathering reactions. In aquatic systems, H2SO4 is primarily derived from anthropogenic disturbance and sulfide (e.g., pyrite) oxidation. Its presence allows silicate weathering to proceed in the absence of  production, and carbonate weathering to produce
  solely via the dissolution of carbonate minerals (equation (3)). Thus, on the timescale of reverse weathering in the ocean (∼104 years), H2SO4-enabled dissolution of
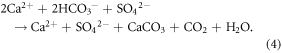
  represents an atmospheric CO2 source (equation (4)). At the timescale of the oceanic SO4 cycle (107 years; Berner and Berner 2012), this process is CO2 neutral (e.g., Calmels et al 2007). In the Mackenzie basin, where we undertake our analyses, prevalent sulfide oxidation causes carbonate dissolution to provide 62%–65% of present-day
  flux (Calmels et al 2007, Beaulieu et al 2011).
In this study, we examine a multi-decadal (1973–2012) dataset for the Mackenzie River mainstem immediately upstream of the Arctic Red River, and the mouths of four major tributaries (figure 1). The Mackenzie is the largest contributor of freshwater and DIC, and second-largest contributor of DOC, from the North American continent to the Arctic Ocean, providing, for example, an estimated 55% of the Arctic Ocean's North American freshwater flux (McGuire et al 2009, Holmes et al 2012, Tank et al 2012b). It experiences minimal human disturbance, particularly north of Great Slave Lake. The Mackenzie exhibits varied lithology and soil OC content, and is 70% north of the southern boundary of sporadic permafrost, with distribution increasing northwards (figure 1, table S1). The majority of the basin is covered with glacial tills of varying thickness.

Figure 1. Characteristics of Mackenzie basin and related sub-catchments. Shown are permafrost extent (Brown et al 1998), lithology (Dürr et al 2005) and soil organic carbon content (SOCC; Tarnocai et al 2007). Abbreviations in the lithology map are as follows: Wb: waterbody; Pa: acid Plutonic; Vb: basic and intermediate volcanic; Pr: Precambrian basement; Mt: metamorphic; Cl: complex lithology; Ss: siliciclastic; Sm: mixed sedimentary; Sc: carbonate; Su: semi-consolidated to consolidated sedimentary; Ad: Alluvial deposits. The inset shows the location of the Mackenzie basin within North America. Circles indicate the mainstem (red) and subcatchment (yellow) study sites. Table S1 gives a numerical breakdown of major categories within each characteristic type.
Download figure:
Standard image High-resolution imageData were collected by Environment Canada, and consist of point water chemistry measurements and continuous discharge records. We examine changes in concentrations and total fluxes of DOC, alkalinity, and selected major ions, with fluxes modeled from paired daily discharge and point concentration measurements using USGS LoadEstimator (LOADEST) software (Runkel et al 2004). Given the high alkalinity, and low organic acid concentrations in this basin, we use measured alkalinity as a proxy for bicarbonate in our analyses (see section 2). This dataset provides a length, and resolution, of real-time measurements that does not exist for any other major Arctic watershed. We use these data to assess the integrated signal of broad-scale changes in C-cycling over a basin area that spans 1.8 M km2 of northwestern Canada, with sub-catchment data enabling us to further explore the mechanistic underpinnings of the changes that we observe.
2. Methods
2.1. Data acquisition
Daily discharge data for the Mackenzie River upstream of the Arctic Red River, and several major sub-catchment sites (table S1, figure 1) were obtained from the Water Survey of Canada historical data record (https://www.ec.gc.ca/rhc-wsc/). Corresponding water chemistry data for DOC, alkalinity, and selected major ions (Ca, Mg, SO4) were obtained from Environment Canada long-term records. Waters of the mainstem and major tributary sites that we survey are bicarbonate-rich and highly buffered. Therefore, we use alkalinity as a proxy for bicarbonate in our analyses, which is well supported for waters within the Mackenzie system (Tank et al 2012b). A supplemental analysis following the technique described in Tank et al (2012b) confirms that changes in organic acid anions do not affect our alkalinity results. Before detailed data analyses, constituent data were plotted against discharge to identify constituent data points that were likely to be erroneous. These values, which were removed from our analyses, represent less than 3% of the total individual data points for these data sets. Because of this quality-control approach to our analyses, we limit our presentation of concentration-specific data to periods for which discharge data exist.
2.2. Load analyses
We modeled monthly and annual constituent fluxes using the LoadRunner software package (Booth et al 2007) to automate runs of the USGS LOADEST program. LOADEST uses a time series of paired streamflow and constituent concentration data to construct a calibration regression, which is then applied to a daily discharge record to obtain daily constituent fluxes (load; mass d−1). The program uses a series of models which are nested within the following:
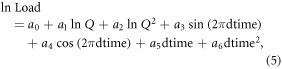
where ln Load = the natural log of Load, ln Q = [ln(streamflow)—center of ln(streamflow)], and dtime = [decimal time—center of decimal time]. We used the AIC criteria to select the model of best fit from among the nested series of potential models, following common practice when there is no a priori reason for model preference (Burnham and Anderson 2002). The Adjusted Maximum Likelihood Estimator was used to fit the calibration equation. Because this nested model series includes a linear time function (variables a5 and a6 in equation (5)) we additionally compared our full time-series LOADEST models to running series of 5-year models, to ensure that our LOADEST output did not incorrectly include a linear time function. We did this for each constituent analyzed that showed a significant trend with time, at each of the mainstem and sub-catchment sites. We further compared the monthly outputs from these two approaches for the Mackenzie mainstem DOC and alkalinity models. Both approaches gave similar results, with full time-series models often displaying a more conservative trend with time. Thus, we present our full time-series outputs for ease of analysis. Model results are presented in the appendix (table S2 and text).
At the Mackenzie mainstem site, total annual discharge increased significantly during the 1978–2012 period for which DOC data exist, but showed no trend over the full period of record (figure 2). Therefore, we back-calculated DOC flux to the full period of discharge record using LOADEST model parameters to account for this potential confounding effect.

Figure 2. LOADEST-modeled fluxes of dissolved organic carbon (DOC) and alkalinity, and measured discharge, for the Mackenzie River upstream of the Mackenzie Delta. Top panels show annual fluxes and discharge; middle panels show monthly trends in flux or discharge normalized as percent change per decade, bottom panel shows absolute change per decade. Error bars are 95% confidence intervals. For DOC, flux estimates were back-cast to the full period for which there is discharge data (see section 2), as indicated by the hollow circles, and monthly trends are calculated over this full period of record. Annual DOC trends are shown for the full period of record (gray line) and for the period over which DOC concentration data are available (black line). Dotted points in the discharge panel indicate years without DOC concentration data.
Download figure:
Standard image High-resolution image2.3. Trend analyses
We used a Mann–Kendall test to analyze the significance of trends in monthly and annual fluxes over time, following the pre-whitening approach outlined in Yue et al (2002) to correct for potential serial autocorrelation. Within this analysis, trend slopes were calculated using the Theil–Sen approach. Confidence limits on trend slopes (95%) were also calculated following Yue et al (2002). Pre-whitened trend analyses, and the calculation of slopes and their confidence limits were conducted using the 'zyp' package in the R statistical platform (R Development Core Team 2008, Bronaugh and Werner 2013). In our trend analyses for the Slave sub-basin, we exclude data from 1997 and 1998, which show anomalously high flows following a large water release from the WAC Bennet Dam during the fall of 1997, followed by the recharge of Lake Athabasca (Rawlins et al 2009). Statistical details of our Mann–Kendall outputs are presented in the appendix (table S3).
For the analyses of concentration trends, individual data points were split seasonally, to avoid the confounding effect of regular seasonal variations in concentration. Seasonal splits were determined from the Mackenzie hydrograph (figure S1), and defined as spring (May–June; rising limb and high flow period), summer (July–August; early falling limb), autumn (September–November; late falling limb and transition to sub-zero temperatures) and winter (December–April; baseflow). Trends in point measurements of concentration and ion ratios (see section 4) were fit as generalized least squares linear models using the 'nlme' package in R (Pinheiro et al 2015), and corrected for autocorrelation where appropriate, following Zuur et al (2009). Statistical details for trends in point measurements are presented in table S4.
2.4. Collection and analysis of sulfate isotopes
Samples for the analysis of δ32SO4 and δS18O4 were collected from the Mackenzie River at the Arctic Red River, at a site that was proximate to the Water Survey of Canada/Environment Canada sampling location. Samples were collected during spring high flow (9 June 2013) mid-summer (22 July 2013) and in the winter (16 April 2014). All samples were immediately filtered using either a Whatman GF/F (0.7 μm nominal pore size; spring and summer); or AquaPrep capsule (0.45 μm pore size; winter) filter. Samples were kept chilled until analyses, and analyzed at the University of Waterloo Environmental Isotope Laboratory using IRMS. We used a Bayesian mixing-model approach (MixSIR; Moore and Semmens 2008) to estimate the relative contributions of gypsum and pyrite to SO4. Three distinct end-member isotopic values as described by Calmels et al (2007) were input to the model, which was configured with uninformed (i.e., bounded uniform distribution) priors. Within simulations, the number of iterations was set to ensure a minimum of 1000 posterior draws.
3. Results
We observe significant increases in both DOC and alkalinity flux at the Mackenzie mainstem site over the period of record (figure 2). Examined seasonally (see section 2), the percentage change in DOC flux was greatest in the winter (December–April), when both concentration (figure 3) and discharge (figure 2; see also St Jacques and Sauchyn 2009) increase over time. However, because total discharge is low during winter months, the absolute increase in wintertime DOC flux is a relatively small component of the annual budget. In spring, proportional increases in May were similar to those in the winter, and—as a result of high discharge—absolute increases during this month were considerable. June increases were not significant, as indicated by 95% confidence limits that overlap zero (p = 0.122). In summer (July–August), DOC concentrations increase, but this does not translate to significant increases in DOC flux because of large inter-annual variation in discharge during these months (figures 2 and 3). Proportional and absolute DOC flux increases are again significant during the autumn (September–November), when increasing concentrations couple with neutral discharge trends (figures 2 and 3). Total annual discharge showed no trend over the 39-year period of record (figure 2).

Figure 3. Seasonal trends in measured concentrations of dissolved organic carbon (DOC) and alkalinity in the Mackenzie River, upstream of the Mackenzie Delta. DOC concentrations range from years 1978 to 2012; alkalinity ranges from years 1972 to 2012.
Download figure:
Standard image High-resolution imageWithin sub-catchments, annual DOC fluxes showed no trend in southerly regions (Hay, Slave, figure 4; note the Slave catchment is influenced by a dam). Of the northern sub-catchments, the Liard trends are very similar to those for the Mackenzie mainstem, with annual DOC fluxes, but not discharge, increasing significantly (figure 4). Yearly DOC flux from the Great Bear River also increased significantly, driven by increasing DOC concentrations during summer, autumn, and winter (data not shown), accompanied by a modest increase in annual discharge (figure 4).

Figure 4. LOADEST-modeled yearly fluxes of dissolved organic carbon (DOC), alkalinity, and sulfate, and measured yearly discharge, for major sub-catchments within the Mackenzie basin. Points excluded from the Slave River analysis, as described in the text, are shown as hollow circles.
Download figure:
Standard image High-resolution imageMean annual alkalinity flux also increased significantly at the Mackenzie mainstem site, but more modestly than for DOC (figure 2). Proportional alkalinity flux increases were strongest in the winter, with a trend driven primarily by increasing discharge and secondarily by concentration (figure 2). During other months, increasing alkalinity concentrations (consistent, significant, increases in flow-weighted concentrations from the LOADEST output, and figure 3, summer) are overwhelmed by year-to-year variability in discharge, and flux increases are not significant with time. Sub-catchment trends for alkalinity are similar to those for DOC, with alkalinity fluxes increasing significantly with time in the Liard and Great Bear, but not in the more southerly Hay and Slave basins (figure 4).
To better understand increases in alkalinity at the Mackenzie mouth, we further examined trends for major weathering ions (Ca, Mg, SO4). All showed clear increases in flux over time, with SO4 increasing most substantially (16.3 ± 3.6 percent per decade; 95% confidence interval). Ionic trends show a similar seasonal distribution to alkalinity, with greatest percentage increases occurring mostly during autumn and winter (figure 5). Additionally, and consistent with previous studies (Calmels et al 2007), isotopic analyses indicate that the majority of sulfate at the Mackenzie mainstem is derived from sulfide oxidation, rather than gypsum dissolution (figure 5). This was true during spring (90.0%, 77.6%–98.3%; mean, 5th–95th percentile of mixing model output), late summer (90.6%, 79.4%–99.0%), and winter (65.4%, 49.8%–79.1%) months. Sub-catchment trends in SO4 mimic the alkalinity trends (figure 4), with increases occurring in northern sub-catchments (Liard, Great Bear), but not further south. Notably, the Liard and Great Bear watersheds are also known to be sulfide-rich (Beaulieu et al 2011).

Figure 5. Top: LOADEST-modeled fluxes of sulfate, calcium, and magnesium for the Mackenzie mainstem site. Top row shows yearly fluxes; second row shows monthly trends in flux normalized as percent change per decade, third row shows absolute change per decade. Error bars are 95% confidence intervals. Bottom row: left panel: isotopic composition of riverwater SO4 at the Mackenzie mainstem site relative to (1–2) pyrite and (3) gypsum endmembers for western Canada (Calmels et al 2007). Samples are from (4) spring high flow, (5) mid-summer, and (6) winter. Middle and right panels: changes in equivalent ratios of major weathering ions over time at the Mackenzie mainstem site. Hollow black circles indicate measurements that do not have corresponding discharge data for quality control analyses. Trend results for the full period of record (black line and text) and period of record for which discharge data exist (gray line and text) are shown.
Download figure:
Standard image High-resolution image
4. Discussion
The high proportion of sulfide-derived SO4 in our samples, coupled with the clear rise in SO4 flux, indicates that increasing sulfide oxidation is an important driver of increasing alkalinity flux in the Mackenzie basin. Increasing H2SO4-driven weathering is further supported by changing ionic ratios of point concentration measurements over time at the Mackenzie mainstem site. On an equivalent basis, [alkalinity : (Ca + Mg)] declines significantly with time (figure 5). This is consistent with increasing H2SO4-driven dissolution of carbonates (equivalent ratio of HCO3:(Ca + Mg) production of 1:2; see equation (3)) relative to weathering by H2CO3 (equivalent ratio of 1:1; equation (2)). In contrast, the equivalent ratio [(alkalinity + SO4): (Ca + Mg)] remains relatively constant (overall 1% change 1978–2012), and near 1.0 (mean = 1.03), consistent with H2CO3 and H2SO4 acting as the main weathering agents in the basin (see equations (2) and (3)), and the dominance of carbonate weathering in this region (e.g., Calmels et al 2007). Finally, the increased alkalinity flux (15.8 ± 15.4 Geq decade−1; 95% confidence interval) is nearly equivalent to the combined increase in Ca + Mg (17.5 ± 10.9 Gmol decade−1), which is again consistent with increasing H2SO4-driven weathering of carbonate earth materials (equation (3)). While the flux of SO4 increased more modestly (12.4 ± 2.8 Gmol decade−1), this amount is consistent with the alkalinity trends (see equation (3)) when SO4 increases are scaled by our isotopic and monthly trend results.
Our results indicate that thawing of permafrost-protected glacial till is actively increasing sulfide oxidation and alkalinity generation in the Mackenzie basin, with subsequent implications for IC mobilization, and the broader C cycle. Glacial tills of varying thicknesses cover most of this region, similar to previously glaciated regions across northern North America (Fulton 1995, Manley and Kaufman 2002). Where these deposits host permafrost, they have not been subjected to leaching by surface and subsurface flow (Kokelj and Burn 2005), and have thus been protected from weathering. Permafrost thaw thus enables novel weathering action, following changes in soil thermal conditions, deepening of flow paths, and mechanical erosion (Keller et al 2010, Kokelj et al 2013, Malone et al 2013). Notably, the sub-basins of the Mackenzie catchment rich in sulfide-containing bedrock and tills (the Liard and Great Bear, in addition to the Peel sub-basin; Beaulieu et al 2011) are underlain by warming permafrost, which is causing degradation locally, and increasing active layer thicknesses (Romanovsky et al 2010, Smith et al 2010, Connon et al 2014). As just one example of the effects of this change, documented, thaw-driven increases in geomorphic activity within the lower Mackenzie basin (Lacelle et al 2010) are substantially increasing stream sediment and solute loads in a region where thawing glaciogenic deposits are emerging as a major sediment source (Carson et al 1998, Kokelj et al 2013, Malone et al 2013). Greater geomorphic activity is likely to be an important driver of increasing sulfide oxidation, because of the need for continued generation of weatherable substrate for this relatively rapid oxidation reaction (Calmels et al 2007). Increases in sulfide oxidation may be particularly prevalent in the Mackenzie basin because of this region's lithology. However the exposure of permafrost protected materials via permafrost thaw, and the subsequent mobilization or generation of bicarbonate, may be common wherever thermokarst processes are actively degrading thick layers of frozen tills, which are widespread across much of the previously-glaciated circumpolar North.
In contrast to the alkalinity results, several mechanisms provide a reasonable explanation for the increases in DOC flux that we observe. In part, this diversity speaks to the varied landscapes, and broad scales, across which our observations occur. In the Great Bear River, for example, increasing DOC fluxes seem likely to be caused by changing limnological conditions, and thus productivity, in Great Bear Lake (area = 31 × 103 km2; residence time ≈ 124 years). Outside of the Great Bear basin, which accounts for a small fraction of the Mackenzie's total discharge (∼6%, table S1), processes related to permafrost degradation and changing active layer dynamics appear to be good candidates to explain increasing DOC flux. This mechanism for change is consistent with observed increases in northern, but not southern (Hay, Slave) regions of the catchment, and landscape changes that have been documented throughout the northern reaches of the Mackenzie basin. For example, lowland portions of the Liard catchment are experiencing substantial permafrost peatland degradation, which has led to wetland expansion and increases in hydrological connectivity (Connon et al 2014) that should increase contact between water and surface soils, and the export of dissolved organics. Elsewhere in the central Mackenzie basin, the postponement of active layer freezeback into late winter months, and resultant increase in length of the winter hydrological season, appears to have augmented late-season DOC (Spence et al 2015). These landscape-scale, permafrost thaw-driven changes are consistent with the autumn to winter DOC increases that we observe. At the same time, increasing DOC brought about by these types of changes in near-surface processes is also compatible with the modern radiocarbon age observed for DOC at the Mackenzie mouth (Raymond et al 2007), while the lack of a DOC trend across all sub-catchments suggests that direct temperature effects on primary production and respiration are not the main drivers of increasing DOC. Overall, these results serve as an important reminder that relatively modern carbon, which might otherwise remain sequestered on land, can also be mobilized as a result of changing permafrost and active layer conditions, an effect that could occur in addition to the more commonly-examined exposure, and mineralization, of old (i.e., millennial-scale) OC (Schuur et al 2015).
When considered in concert, both DOC mobilization and sulfide oxidation appear to be acting to increase the rate of land-to-ocean transfer of dissolved C in this region. This increase in carbon mobilization is striking: over the 39-year period of record, DOC flux increased by 39.3% at the Mackenzie mainstem site, or 44.5 ± 22.6 Gmol (95% confidence interval). While the proportional increase for alkalinity was more modest (12.5%), its absolute increase was greater than that for DOC (61.5 ± 60.1 Geq). Most pronounced, however, is the 63.8% (48.4 ± 10.7 Gmol) change in sulfate flux that appears to largely be caused by increases in sulfide oxidation, and thus be driving the alkalinity trends.
The changes in carbon mobilization that we observe can be expected to further drive changes in land-to-atmosphere C flux. For example, increasing river mouth DOC is almost certainly accompanied by substantial enhancements in mineralization within the river network (Striegl et al 2012, Spencer et al 2015), while a conservative 60% of DOC flux to the Arctic Ocean is mineralized to CO2 within the 10-year residence time of that basin (Alling et al 2010). Although it acts on a very different timescale, sulfide-induced increases in alkalinity flux also represent a transfer of C from land to atmosphere (equation (4)). In fact, the increases in DOC mobilization and estimated sulfide oxidation that we observe are of the same magnitude as combined current estimates of CO2 consumption by silicate and carbonate weathering in the Mackenzie catchment (92–94 Gmol yr−1) (Beaulieu et al 2011, Beaulieu et al 2012). The increase in sulfate flux is also almost identical to regional predictions for climate change-induced increases in CO2 consumption by H2CO3-driven weathering, following the effects of temperature and increasing CO2 concentrations as atmospheric CO2 is increased from a reference state of 355 ppm, to a pre-industrial 2xCO2 scenario of 560 ppm (48 Gmol; Beaulieu et al 2012). Thus, it appears that this intensification of carbon mobilization is of a magnitude to counter-balance current, and predicted future, CO2 fixation by weathering in this region.
Beyond their importance for the regional C cycle, these results have clear implications for changes in nearshore ocean processes, including food web structure, bacterial metabolism, and aragonite saturation (e.g., Tank et al 2012b), at the mouth of a river that is a major contributor of freshwater and biogeochemical constituents from the North American continent to the Arctic Ocean. They also indicate a clear need to quantify whether long-term increases in DOC mobilization are occurring in other Arctic regions, where riverine DOC fluxes tend to be much greater than in the Mackenzie (Holmes et al 2012), and to better understand how thaw-induced changes in weathering may play out across Arctic regions that vary in glacial history and nature of surficial deposits. While sulfide oxidation may be common in other Arctic regions, such as the Yukon drainage (Marsh et al 2003, Verplanck et al 2008), its prevalence is particularly poorly understood (Beaulieu et al 2011). Above all, however, this detection of striking change in C mobilization was only possible because of the existence of a coupled, multi-decade dataset, which is unique for large river hydrology and biogeochemistry. Continuing to build similar datasets for other Arctic regions (e.g., McClelland et al 2008) is thus a clear priority in our efforts to understand high latitude change.
Acknowledgments
This analysis was only possible as a result of a decades-long data collection effort by numerous individuals within Environment Canada's Water Quality Monitoring and Surveillance Division and Water Survey of Canada branch. We specifically thank Minzhen Su and Kerry Pippy for their help to identify relevant datasets, and provide data access. SET acknowledges support from NSERC (Discovery Grant and Northern Research Supplement) and Campus Alberta Innovates Program Chair support. Les Kutny assisted with the collection of the winter SO4 isotope sample (funding via NSF 1107774). Charlene Neilson (University of Alberta) provided GIS support, and generated the map in figure 1. Helpful comments from Ted Stets (USGS) greatly improved the manuscript. Any use of trade, firm, or product names is for descriptive purposes only and does not imply endorsement by the U.S. government.