Transcriptome Analysis Reveals Candidate Genes Related to Anthocyanin Biosynthesis in Different Carrot Genotypes and Tissues


Department of Plant and Environmental Sciences, University of Copenhagen, Thorvaldsensvej 40, 1871 Frederiksberg C, Denmark
*
Author to whom correspondence should be addressed.
Plants 2020, 9(3), 344; https://doi.org/10.3390/plants9030344
Submission received: 9 February 2020 / Revised: 5 March 2020 / Accepted: 6 March 2020 / Published: 9 March 2020
Abstract
:
Black carrots are characterized by a significant amount of anthocyanins, which are not only a good source of natural food colorant, but can also provide many health benefits to humans. In the present work, taproots of different carrot genotypes were used to identify the candidate genes related to anthocyanin synthesis, with particular a focus on R2R3MYB, bHLH transcription factors, and glutathione S-transferase gene (GST). The RNA-sequencing analysis (RNA-Seq) showed that DcMYB6 and DcMYB7 had a genotypic dependent expression and they are likely involved in the regulation of anthocyanin biosynthesis. They were specifically upregulated in solid black taproots, including both black phloem and xylem. DcbHLH3 (LOC108204485) was upregulated in all black samples compared with the orange ones. We also found that GST1 (LOC108205254) might be an important anthocyanin transporter, and its upregulated expression resulted in the increasing of vacuolar anthocyanin accumulation in black samples. Moreover, high performance liquid chromatographic (HPLC) analysis and liquid chromatography coupled to mass spectrometry (LC-MS) were used to identify the individual anthocyanin in the purple tissues of two carrot cultivars. The results showed that five main anthocyanin compounds and the most abundant anthocyanin were the same in different tissues, while the second-highest anthocyanin between three tissues was different, even in the same cultivar. In conclusion, this study combined anthocyanin profiles and comparative transcriptomic analysis to identify candidate genes involved in anthocyanin biosynthesis in carrots, thus providing a better foundation for improving anthocyanin accumulation in carrots as a source of colorants.
1. Introduction
Anthocyanins, one of the phenolic compounds, are derived from the flavonoids biosynthesis pathway. Anthocyanins are ubiquitous in plants, a wide variety of colors result from the anthocyanin synthesis. Apart from their colorant properties, anthocyanins also play an important role in preventing UV radiation, responding to cold and drought stress, promoting pollination, and defending against bacterial and fungal pathogens [1,2].
Wild carrots (Daucus carota) are indigenous to Europe, Northern Africa, and parts of western Asia [3] and have whitish or pale yellow roots, while the original carrots domesticated in Persia and Arabia with purple and yellow roots [4,5]. The domesticated carrots are divided into Western and Eastern groups [6], black or purple carrots (Daucus carota L. ssp. sativus var. atrorubens Alef.) the latter are characterized by a relatively high amount of anthocyanins. In recent decades, black carrots have attracted more and more attention, as they are not only a good source of natural food colorant [7,8], but also comprise a variety of antioxidant components that provide health benefits to humans [9,10]. There are many different purple carrots cultivars, which can be differentiated by their xylem color, such as ‘Antonina’ with white/yellow xylem, ‘Purple Haze’ and ‘Beta Sweet’ with orange xylem [11]. In purple carrots, the anthocyanin composition has been well studied and reported by several researchers, cyanidin-3-xylosyl (feruloylglucosyl)-galactoside is the major one [12,13,14]. The acylated anthocyanins were shown to account for more than half of the total anthocyanin content in many black carrot cultivars [14]. In addition, purple carrots are considered as desirable material for food colorant production, since these acylated cyanidin derivatives are more stable than nonacylated ones with the increasing of storage time [15,16].
Anthocyanin biosynthesis is one of the branches of the flavonoid biosynthesis pathway. Most of the structural genes involved in this pathway have been intensively studied in many plant species [17]. Firstly, phenylalanine ammonia-lyase (PAL) transforms phenylalanine to trans-cinnamic acid. Cinnamate 4-hydroxylase (C4H) and 4-coumarate-CoA ligase (4CL) sequentially convert trans-cinnamic acid into 4-coumaroyl-CoA. After that, chalcone synthases (CHS), chalcone isomerase (CHI) and flavonoid 3 hydroxylase (F3H) participate in the early steps of this pathway. The downstream genes in the pathway were dihydroflavonol 4-reductase (DFR), leucoanthocyanidin dioxygenase (LDOX) and UDP-glucose: flavonoid 3-glucosyltransferase (UFGT) [1]. Previous reports showed that these genes (except for UFGT) participated in anthocyanin biosynthesis in the taproots of black carrots [18,19]. Acyltransferases, such as SCPL (Serine Carboxypeptidase-Like) in carrots, catalyze the formation of acylated anthocyanins [20,21]. Moreover, anthocyanins were transported and accumulated into vacuoles by transporters [1], including the glutathione S-transferase (GST) family, the ATP-binding cassette (ABC) and multidrug and toxic compound extrusion (MATE) families [20,21,22]. The first GST in relation to anthocyanin was reported in maize [23], anthocyanin accumulation was reduced due to the loss-of-function of Bronze2 (Bz2). Subsequently, homologs of the Bz2 gene, including Arabidopsis TT19 [24], petunia AN9 [22], and grape VvGST1 and VvGST4 [25], were found to transport anthocyanins into vacuoles. Nevertheless, to date, no direct evidence has been found for the role played by GSTs in conjugating anthocyanin in carrot.
Expression of anthocyanin biosynthesis pathway genes is controlled by the MYB-bHLH-WD40 ‘MBW’ complex, MYB transcription factors (TFs) are the major contributors to the regulation of this pathway [26]. In maize, the C1 gene regulated the anthocyanin contents through the interaction with structural genes [27]. Subsequently, MdMYB10 and MdMYB1 in apples [28,29], VvMYBA1 and VvMYBA2 in grapevines [30], and PyMYB10 in pears [31] were found to be the transcriptional activators of anthocyanin biosynthesis. bHLH proteins of the MBW complex also play an important role in the anthocyanin biosynthesis in many plants. In lotus, NnMYB5, interacting with NnbHLH1, acted as a transcription activator of anthocyanin synthesis [32]. In apples, MdbHLH3 was identified as an activator of anthocyanin accumulation in fruit [33]. In strawberries, FabHLH3 was responsible for the modification of proanthocyanin contents [34]. GtbHLH1 in gentian flowers interacted with GtMYB3 to improve the promoter activity of structural genes in tobacco [35]. In potatoes, StbHLH1 has been reported to be involved in anthocyanin biosynthesis [36].
Despite a comprehensive study of anthocyanin-related MYB, bHLH TFs and GST on other species, there is still limited information about these genes in carrot taproots. According to previous reports, five MYB transcription factors, named DcMYB1 to DcMYB5, have been shown to be involved in the transcriptional regulation of DcPAL1 to DcPAL4 in carrot cell suspension cultures. Among them, DcMYB1 could stimulate the expression of DcPAL1 to defend against UV-B irradiation [37], and DcMYB3 and DcMYB5 play important roles in the 2,4-D regulated expression of DcPAL3 in anthocyanin accumulation [38]. It is worth noting, however, that in vitro protoplasts were used as the resource of materials in the above studies. It may not be applicable when it comes to in planta conditions. The expression pattern of DcMYB6 and DcMYB7 were recently reported to be positively correlated with anthocyanin accumulation in carrot taproots [39,40]. It should also be noted that the black carrot genetic background and developmental stages used in that study were completely different from the materials used here. More important, in our study, the mechanism of coloration was also studied with a particular focus on the xylem and phloem of different carrot cultivars. There are various differences of expressed genes under different genetic backgrounds and growth stage, which will provide a new perspective on the study of carrot pigmentation in terms of the tissue, genotype, and stage specificity.
In this study, three carrot cultivars with different pigmentation patterns in the phloem and xylem of their taproots were selected in order to investigate the anthocyanin biosynthesis mechanism in a tissue-specific manner. HPLC analysis combined with LC-MS was used to identify and relatively quantify individual anthocyanins in different black tissues. Although the anthocyanin profile has been well studied by several researchers, there are no reports so far in terms of tissue-specific study. A comprehensive analysis integrating RNA-Seq, gene expression analyses, and orthologous and phylogenetic analysis strongly suggested that DcMYB6 and DcMYB7, one bHLH gene, and one GST gene were involved in anthocyanin pigmentation in carrot taproots in this study.
2. Results
2.1. Total Anthocyanin Accumulation during Four Growth Stages
To understand the changes that take place in the anthocyanin content of carrots during development and ripening, we categorized developing carrot taproots into four growth stages: S1, S2, S3, and S4, representing 60, 80, 100 and 120 days after sowing, respectively (Figure 1a). The total anthocyanin content (TAC) was determined (Figure 1b) using the pH differential method [41]. As shown in Figure 1a, three cultivars displayed distinct coloration, the purple-pigmented area of phloem in ‘Purple 68′ and ‘Purple Haze’ grew from S1 to S4. The purple color of the xylem in ‘Purple 68′ increased, while the xylem of ‘Purple Haze’ stayed orange across all the stages.
‘Purple 68′ showed the highest TAC followed by ‘Purple Haze’ across all the stages. No anthocyanin was detected in the orange carrot cultivar ‘H13.360IND’. The TAC of ‘Purple 68′ increased sharply from stage S1 to S2 and then reached a plateau at S3 and S4. TAC of ‘Purple Haze’ had slightly increasing from S1 to S4 (Figure 1b). The TAC of ‘Purple 68′ and ‘Purple Haze’ in S4 were highest compared to the other stages, and there was no significant increase from S3 to S4. The carrot taproots from S4 (120 days after sowing) were chosen for RNA isolation and sequencing.
2.2. Characterization of Anthocyanins in the Carrot Phloem and Xylem
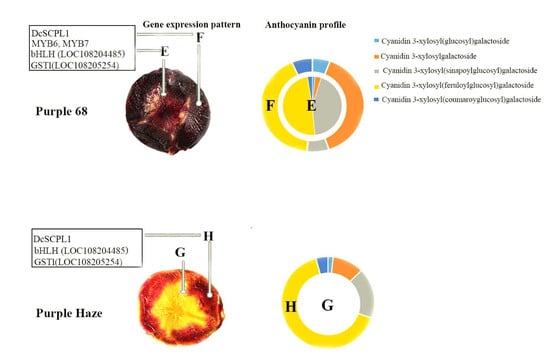
In our study, the purple samples are the phloem of ‘Purple 68′ and ‘Purple Haze’, and the xylem of ‘Purple 68′ at S4. LC-MS was carried out to identify and relatively quantify individual anthocyanins of purple samples based on retention time, mass, and spectra, and comparisons with reported data from black carrot [8,42]. By calculating the percentage peak area from HPLC measurements, a typical anthocyanin profile of a black carrot root extract was identified in Supplementary File S1. The five major compounds were cyanidin 3-xylosylgalactoside, cyanidin 3-xylosyl (glucosyl) galactoside, cyanidin 3-xylosyl (feruloylglucosyl/coumaroylglucosyl/sinapoylglucosyl) (Supplementary File S1). The feruloyl derivative of cyanidin xylosylglucosylgalactoside was the predominant pigment in all the samples, cyanidin 3-xylosylgalactoside was the second-highest anthocyanin in the phloem of ‘Purple 68′, while cyanidin 3-xylosyl (sinapoylglucosyl) galactoside was the second-highest in the xylem of ‘Purple 68′ and phloem of ‘Purple Haze’.
2.3. An Overview of Transcriptome Sequencing Datasets
To further identify the molecular mechanism of anthocyanin biosynthesis in carrots, RNA-Seq was used to investigate changes in comprehensive gene expression in carrot taproots at S4 displaying different pigmentation patterns. Approximately 41.74–46.30 million paired-end clean reads were generated (Table 1). The clean Q30 base rates, a key parameter that represents the quality of sequenced bases, were around 93–94% in all the libraries, suggesting high-quality sequencing. Of the total clean reads, 60.06–66.61% were uniquely mapped, that is to say they were mapped to only one position in the reference transcriptome (Table 1). These results indicated that the RNA-Seq data obtained could be used for this study.
2.4. Identification of Differentially Expressed Genes between the Phloem and Xylem of ‘Purple 68′ and ‘Purple Haze’
In the present study, the differentially expressed genes (DEGs) between the phloem and xylem of ‘Purple 68′ and ‘Purple Haze’ were investigated to find genes that were expressed through a tissue-specific way. KEGG pathway analysis of these DEGs were performed, which provides a foundation for underlying pigmentation mechanism through systematically analyzing the biological processes (Supplementary File S2). Firstly, the aim was to understand the mechanism that made ‘Purple 68′ and ‘Purple Haze’ display differential coloration between phloem and xylem. There were 264 genes identified as DEGs when comparing the xylem to the phloem (E vs. F) in ‘Purple 68′, and 472 DEGs in ‘Purple Haze’, respectively (Figure 2a). Of these DEGs, 60 genes were shared by both comparisons (Figure 2a). There were 61 and 70 pathways detected from the phloem and xylem comparisons in ‘Purple 68′ and ‘Purple Haze’, respectively (Supplementary File S2). The top twenty significantly enriched pathways are shown in the KEGG scatter plot (Figure 2). In the comparison of xylem and phloem in ‘Purple 68′, the top three enriched pathways were ‘monoterpenoid biosynthesis, Rich Factor = 0.57′, ‘glucosinolate biosynthesis, Rich Factor = 0.21′ and ‘flavonoid biosynthesis, Rich Factor = 0.19′ (Figure 2c). In ‘Purple Haze’, the most significantly enriched pathway was ‘flavonoid biosynthesis, Rich Factor = 0.38′, followed by ‘brassinosteroid biosynthesis, Rich Factor = 0.37′ and ‘degradation of aromatic compounds, Rich Factor = 0.33′ (Figure 2d). Therefore, various KEGG pathways were found, the flavonoid biosynthesis pathway was significantly enriched in both comparisons, while other plant secondary metabolite pathways were differentially involved in regulating the pigmentation between two cultivars.
Secondly, to investigate the candidate genes that made the deep purple and purple phloem, and also the purple and orange xylem in ‘Purple 68′ and ‘Purple Haze’, respectively, 857 DEGs were found by comparing the xylem (E vs. G), and 205 DEGs when comparing the phloem (F vs. H) between two cultivars. Among these DEGs, 180 genes were commonly expressed in both comparisons (Figure 2b). In the comparison of xylems (E vs. G), a total of 101 pathways were enriched (Supplementary File S2), of which the top five enriched pathways were ‘flavonoid biosynthesis’, ‘monoterpenoid biosynthesis’, ‘degradation of aromatic compounds’, ‘diterpenoid biosynthesis’ and ‘lipoic acid metabolism’ (Figure 2e). In the comparison of phloems (F vs. H), 83 pathways were enriched, the top five being ‘monoterpenoid biosynthesis’, ‘flavonoid biosynthesis’, ‘lipoic acid metabolism’, ‘zeatin biosynthesis’ and ‘indole alkaloid biosynthesis’ (Figure 2f). KEGG analysis revealed that the main activated genes resulting in different purple colored phloem or different colored xylem (purple and orange) in ‘Purple 68′ and ‘Purple Haze’, which might be involved in tissue-specific coloration, were predominately involved in the biosynthesis of secondary metabolite pathways, hormone signal transduction and other cellular components and molecular function-related terms.
2.5. Differentially Expressed Structural Genes in Anthocyanin Biosynthesis Pathway
According to the analysis above, the different coloration in these cultivars was regulated by the biosynthesis of secondary metabolites, especially the flavonoid. Anthocyanin, belonging to the class of flavonoid compounds, is responsible for the formation of the purple color-specific carrot. In the present study, 20 putative structural genes were identified. Of these, 10 genes were highly upregulated in all the purple color-specific tissues; the others had very low expression levels among all the samples (Figure 3a; Supplementary File S3). These 10 genes were PAL4, C4H1, 4CL3-1, CHS1, CHI1, CHI2, F3H1, F3′H1, DFR1 and LDOX1 (Figure 3a). Therefore, the expression levels of most structural genes related to flavonoid metabolic pathways were higher in purple tissues than in orange ones, leading to higher anthocyanin accumulation. Based on the reported data, of the three CHS genes, LOC108200622 was annotated as DcCHS1 (GenBank ID: AJ006779.1), and LOC108192262 and LOC108212629 corresponded to DcCHS2 (GenBank ID: D16255.1) and DcCHS9 (GenBank ID: D16256.1), respectively [43,44]. It is noticeable that DcCHS1 was the most significantly expressed gene in all purple tissues. In addition, one SCPL gene, named DcSCPL1 [20], which catalyze anthocyanin acylation in carrot, was highly expressed in all the purple tissues (Supplementary File S3).
2.6. Candidate R2R3MYB and bHLH TFs Involved in Anthocyanin Biosynthesis
Regulation of the anthocyanin pathway is achieved through the interaction of MYB, bHLH and WD40-repeat proteins [45,46]. WD40s and bHLHs stimulate a large number of genes responding to changing environmental conditions, while MYBs determine the specific genes to be regulated, which means MYBs are indeed the main regulator of anthocyanin biosynthesis in plants. Here, the focus was on the individual MYB and bHLH TFs that are involved in anthocyanin biosynthesis.
Eighteen MYB genes were identified as DEGs during the tissue-specific comparisons (Figure 3c; Supplementary File S3). Specifically, two MYB113-like genes (namely LOC108192278 and LOC108213488), also known as DcMYB6 (DCAR_000385) and DcMYB7 (DCAR_010745), were highly and solely expressed in ‘Purple 68′, while their expressions were almost undetected in ‘Purple Haze’ (Figure 3b, Supplementary File S3). The results indicated that both of these genes were related to anthocyanin accumulation in a genotype-specific manner. In addition, the expression level of LOC108208100 was higher in purple samples (E, F, and H), than in orange section of ‘Purple Haze’. On the contrary, the expressions of two MYB genes, including LOC108196925 and LOC108193779 were much higher in ‘Purple Haze’ than in ‘Purple 68′. Both of them were predicted as MYB1R1-like transcription factors and may negatively regulate anthocyanin content in these two carrot genotypes.
In the present study, 20 bHLHs were identified as DEGs across all the comparisons (Figure 3c; Supplementary File S3). The transcripts of one bHLH gene, LOC108204485, were detected at high levels in all the purple tissues but at much lower levels in the orange samples (Figure 3c). In addition, three bHLH genes, including LOC108193499, LOC108209686 and LOC108220953 were highly expressed in the xylem of ‘Purple Haze’ and ‘Purple 68′ as compared with phloem in ‘Purple Haze’. They might be related to anthocyanin accumulation in a tissue-specific manner.
2.7. GST Involved in Anthocyanin Transport in Carrots
The GST transporters (GSTs) which are responsible for transporting anthocyanins into the vacuole have been studied previously. In our study, eight GST genes were identified as DEGs across all the comparisons (Figure 4a; Supplementary File S3). Among them, one GST gene (LOC108205254) was significantly upregulated in all the purple tissues as compared with the orange one (Figure 4a; Supplementary File S3). Here, this GST gene was named DcGST1. Multiple alignments with other functional GSTs showed that this DcGST protein contained the conserved residues confirmed for anthocyanin-related GSTs (Figure 4b).
2.8. Validation of RNA-Seq Results with Quantitative Real-Time PCR (qRT-PCR)
RNA samples isolated for the RNA sequencing were also used to perform the qRT-PCR analysis to validate the results of RNA-Seq. Five DEGs were randomly selected for the analysis of qRT-PCR. FPKM value was calculated for all samples, and the Log2 ratio of FPKM was used to reflect the fold changes compared with CT. These results are shown in Figure 5, these genes in RNA-seq and qRT-PCR shared the similar expression patterns. Taken together, RNA-Seq results were confirmed by the qRT-PCR analysis.
3. Discussion
The genetic background of plants is a crucial factor in determining anthocyanin biosynthesis and here the three carrot genotypes used in our study were characterized with distinct colors in their phloems and xylems. HPLC analysis was performed in order to determine the individual anthocyanin of purple samples, namely the xylem and phloem tissue of ‘Purple 68′ and the phloem tissue of ‘Purple Haze’. Five main anthocyanins were found to match those reported in other studies [11,13,48]. Cyanidin 3-xylosyl (feruloylglucosyl) galactoside was identified as the most abundant anthocyanin of carrots, while the second-highest anthocyanin between the three tissues was different. Therefore, our results are the first demonstration that the anthocyanin profiles were not the same in different tissues of the same cultivar taproot.
A series of structural genes control the anthocyanin biosynthesis directly, most of them have been studied in carrot [18,19,37,43,44,49]. In the present study, 10 genes including PAL4, C4H1, 4CL3-1, CHS1, CHI1, CHI2, F3H1, F3′H1, DFR1 and LDOX1 may be involved in the anthocyanin biosynthesis in purple carrots, as these genes showed higher expression levels in purple tissues than in orange tissues. In agreement with our results, by comparing the gene expression levels of 13 structural genes in purple carrots and one non-purple carrot [18], we identified nine of them—including CHS1, CHI1, F3H1, F3′H1, DFR1, LDOX1/LDOX2, PAL3, CA4H1, and 4CL1—as being associated with purple root coloration, and all of them as coinciding with the genes found by RNAseq in our study. They did not, however, analyze CHI2 (also upregulated in the present study). It was reported that four of the five genes (CHS1, F3H1, DFR1, LDOX, and PAL3) [19] coincided with the purple root-upregulated genes found in the present work, PAL3 being the exception. Furthermore, in a more recent study, it was reported that six genes (CHS1, CHI1, F3H1, F3′H1, DFR1, LDOX1 and some UDGP genes) were found to be upregulated in purple carrot roots [50]. Six of them coincide with our study, except for UDGP genes. Three UFGT-like genes were not differentially expressed in any of the comparisons, which is in agreement with a previous report [19], the expression level of UFGT was always relatively constant, regardless of the color and developmental stage of the carrots.
In our study, PAL4 was upregulated in all the purple tissues, while in two studies [18,19], but not in [50], PAL3 was the upregulated one. Altogether, this data suggests that PAL and UFGT genes seem to be upregulated in specific purple-rooted genetic backgrounds.
In Arabidopsis, the deficiency of CHS protein in mutants resulted in a decrease in the anthocyanin contents in the cotyledons and hypocotyls, while the seedlings of wild-type were rich in anthocyanins [51]. In our study, only DcCHS1 was highly expressed in purple tissues compared with orange tissues, while DcCHS2 and DcCHS9 had very low expression in all the samples. This indicated that DcCHS1, but not DcCHS2 and DcCHS9, was involved in anthocyanin biosynthesis in carrots. This is consistent with the data presented in [18,43], showing that DcCHS1 expression was highly correlated with the formation of anthocyanin. Therefore, DcCHS1 is believed to play a crucial role in carrot pigmentation. Purple carrots accumulate large quantities of acylated anthocyanins in their roots, however, there are no carrot genes annotated as anthocyanin acyltransferases previously. Recently, it was found that DcSAT1 could be activate by DcMYB7 to regulate the glycosylation and acylation of anthocyanins [52]. In our study, one SCPL gene (LOC108214129) expression was much higher in all the purple samples than in the orange one. Very recently, it was reported that DcSCPL1 (namely LOC108214129), was always expressed in association with anthocyanin pigmentation in the root, which is in agreement with our results [53]. They found that DcSAT1 and DcSCPL1 protein sequences are identical, therefore from here we use DcSCPL1 instead of DcSAT1 and LOC108214129. The expression level of DcSCPL1 was higher in the phloem than in the xylem of ‘Purple 68′, which may explain the difference of anthocyanin profiles in different tissues of the same cultivar.
R2R3MYB TFs were reported as major regulators that promote anthocyanin biosynthesis [28,54,55]. Recently, a cluster of MYB genes were in two regions on chromosome 3, namely P1 and P3, controlling pigmentation in carrots [50]. To be specific, eight MYB genes (MYB6, MYB7, MYB8, MYB9, MYB10, MYB11, MYB14, and MYB15), and two MYB genes (MYB12 and MYB13) were located in the P3 and P1 regions, respectively. In agreement with results in [40], it was found that MYB11 co-localized with the mapped trait for petiole pigmentation making this gene responsible for anthocyanin pigmentation only in petiole [50]. Other genes except for MYB6 and MYB7, were not differently expressed in our study. In the present study, DcMYB7 and DcMYB6 had the same expression pattern, which were highly upregulated in ‘Purple 68′, while almost undetected in ‘Purple Haze’ (Figure 3b, Supplementary File S3). DcMYB7 had higher expression than DcMYB6, and it may play a more important role in anthocyanin accumulation. It was reported [52] that the loss of purple pigmentation in carrot taproots resulted from the knocking out of DcMYB7. In another study [40], it was reported that DcMYB7 was an important gene for anthocyanin synthesis, independent of the genotype of carrot in their study, which is the opposite of our results. We found that DcMYB7 was a genotype-dependent expressed gene and was only expressed in solid purple genotypes (in both purple phloem and xylem). The present results support the findings [56] that DcMYB7 was differentially expressed in solid purple cultivar.
DcMYB6 was reported [39] to regulated anthocyanin synthesis in the carrot taproot. Increased anthocyanin contents were found due to the overexpression of this gene in Arabidopsis. However, later it was reported [40] that DcMYB6 was not the essential gene regulating anthocyanin accumulation in carrots used in their study because DcMYB6 is downregulated in the purple roots of one carrot cultivar. In our study, DcMYB6 was highly expressed in the purple phloem and xylem of ‘Purple 68′. Its expression was positively correlated to the anthocyanin accumulation, which is consist with the results in [39]. Another study show that DcMYB6 may regulate root anthocyanin pigmentation in specific genetic backgrounds [50]. It is noteworthy that the purple carrot cultivars used in our study and in [39] were purple in the phloem and xylem, while the carrot cultivars used in the later study [40] had purple phloem, but orange xylem. These facts, taken together, indicate that it is possible that DcMYB6 and DcMYB7 are involved in genotype-dependent regulation of anthocyanin biosynthesis in carrots. They were specifically upregulated in solid purple carrots, i.e., both phloem and xylem were purple.
In addition, it was reported that the MYB3-like gene (LOC108208100) continued to be upregulated [56] in all purple callus or tissue samples, except for solid purple cultivar ‘Superblack’ (purple phloem and xylem). However, LOC108208100 was upregulated in the solid purple cultivar ‘Purple 68′ in our study, it may therefore be related to anthocyanin accumulation in a purple color-specific way.
In our study, we found one bHLH gene, namely LOC108204485, was upregulated in all purple samples, but almost undetected in the orange sample. It was reported [52] that the bHLH gene (LOC108204485), named as DcbHLH3 (QEA09235.1) in their study, interacted with DcMYB7 using yeast two-hybrid assays. Therefore, we hypothesize that the bHLH gene (LOC108204485) might regulate anthocyanin accumulation through the interaction between MYB TFs in purple samples.
GST1 (LOC108205254) was highly expressed in all the purple-pigmented tissues compared with the orange tissue. It shares 69.81% amino acid sequence identity with GST for anthocyanin accumulation in Cyclamen persicum×Cyclamen purpurascens (Genebank id: BAM14584.1) [47]. In addition, it shares 72.64% amino acid sequence identity with GST in Actinidia chinensis var. chinensis (Genebank id: PSS21435.1) [57]. Moreover, it possesses the typical anthocyanin-related amino acid residues found in dicotyledons [47]. Therefore, the GST1 may play a positive role in transporting anthocyanin into vacuoles in purple tissues to increasing the anthocyanin concentration. To the authors’ knowledge, the GST gene family has not been studied in relation to carrot anthocyanin biosynthesis.
4. Materials and Methods
4.1. Plant Materials
Three different types of cultivars were used in this study: ‘H13.360IND’, ‘Purple 68′, and ‘Purple Haze’. The seeds were sown and grown in greenhouses at the University of Copenhagen, Frederiksberg, Denmark. Characteristics of the cultivars: ‘Purple Haze’ is purple colored with an orange core, ‘Purple 68′ is purple colored, and ‘H13.360IND’ is yellow colored. The seeds of black carrot cultivars ‘Purple Haze’ and ‘Purple 68′ were purchased from Bejo Zaden (bj) in The Netherlands, and orange cultivar ‘H13.360IND’ was provided by Nunhems in The Netherlands. Taproots were harvested at 60, 80, 100, and 120 days after sowing, and then sliced into 0.2 cm discs along the horizontal axis, approximately 1 cm from the taproot’s top. Ten taproots per cultivar were mixed respectively, with three biological replicates used for each sample in HPLC and LC-MS analysis, and two biological replicates in RNA-Seq. All the materials were frozen in liquid nitrogen, powdered individually and then stored at −80 °C for further study.
4.2. Determination of Total Anthocyanin Content and Individual Anthocyanin
The total anthocyanin content (TAC) was determined using the pH-differential method [41]. Briefly, about 0.1 g frozen powder of samples were extracted overnight with 8 mL of 80% methanol at 4 °C. After centrifugation at 10,000× g for 20 min, transfer 1 mL extracted solution was transferred to a new tube and the volume was adjusted to 10 mL with potassium chloride buffer, pH 1.0; another 1 mL extracted solution was transferred into a new tube and the volume adjusted to 10 mL with sodium acetate buffer, pH 4.5. For each pH, absorbance was measured using a spectrophotometer Evolution™ 220 (Thermo Scientific, Waltham, MA, USA) at 510 and 700 nm, respectively. The following formula was applied to determine the anthocyanin contents:
where A is the absorbance of the diluted sample, A = (A510 − A700 nm) pH 1.0 − (A510 − A700 nm) pH 4.5,
C = A × V × n × MW × 100/(ε × m)
C is anthocyanin content (mg 100 g−1 FW), V is extraction solution volume, n is dilution factor, MW is the molecular weight of cyanidin-3-glucoside: 449.2, Ɛ for molar absorptivity: 30,200, m is the weight of fresh sample used.
In terms of HPLC analysis, the carrot taproot sample (500 mg) was mixed with 70% methanol containing 2% formic acid at 4 °C. A 0.45 μm syringe filter was used for filtering the supernatant. Then the filtered supernatant was used for the HPLC analysis. Phenolic compounds were analysed using HP1200 (Agilent Technology, Palo Alto, CA, USA). The details of the analysis were described in [58]. To complement the HPLC analyses, LC-MS analysis was performed following the method described in [59]. Chromatography was performed on a Dionex UltiMate® 3000 Quaternary Rapid Separation UHPLC focused system (Thermo Fisher Scientific, Germering, Germany).
4.3. RNA Extraction and cDNA Synthesis
Total RNA was harvested from the frozen carrot samples with TRIzol reagent (Sigma-Aldrich, Inc., St. Louis, MO, USA) following the manufacturer’s protocol. The RNA quality was identified by a Spectrophotometer NanoDrop 2000C, Thermo Scientific, Waltham, MA, USA), and 4 µL of RNA was loaded on 1% agarose gels to check the degradation and contamination. First-strand cDNA was obtained using M-MuLV Reverse Transcriptase (NEB, Ipswich, MA, USA), according to the manufacturer’s protocol, and stored at −20 °C for qRT-PCR assays.
4.4. Library Construction and Transcriptome Sequencing
For the RNA-Seq analysis, 120-day-old carrot taproots of three cultivars were chosen. For ‘H31.360IND’, the whole slice was used; for ‘Purple 68′ and ‘Purple Haze’ the carrot discs were dissected into the xylem and phloem tissue samples. Following this, five RNA-Seq libraries were constructed and labeled as follows: CT (whole slice of ‘H31.360IND’), E (xylem of ‘Purple 68′), F (phloem of ‘Purple 68′), G (xylem of ‘Purple Haze’) and H (phloem of ‘Purple Haze’). Two biological replicates were used for each sample. Therefore, ten libraries were obtained in this study in all. The sequencing of libraries was conducted by Novagene Corporation using Illumina® (NEB, Ipswich, MA, USA) according to the manufacturer’s instruction. Subsequently, the mRNA was purified, and first-strand cDNA was synthesized with M-MuLV reverse transcriptase. Then the following steps were converting the overhangs into blunt ends, preparing for hybridization, and purifying the cDNA fragments. Before PCR, adaptor-ligated cDNA libraries were treated with USER Enzyme (NEB, Ipswich, MA, USA). Then PCR was performed with Phusion High-Fidelity DNA polymerase. Lastly, PCR products were purified, and library quality was assessed on the Agilent Bioanalyzer 2100 system (Agilent Technologies, Santa Clara, CA, USA). The data have been deposited in NCBI’s Gene Expression Omnibus; GEO Series accession number GSE146419 and may be accessed at https://www.ncbi.nlm.nih.gov/geo/query/acc.cgi?acc=GSE146419.
4.5. RNA-Sequencing Data Analysis
Clean reads were obtained after the filtering of raw data. Reference genome and gene annotation files of carrot were downloaded from NCBI carrot genome [60]. The index of the reference genome was built using Bowtie v2.2.3. Then paired-end clean reads were aligned to the reference genome using TopHat v2.0.12. The level of gene expression was determined according to the number of fragments per kilobase of exon per million fragments mapped (FPKM). Differential expression analysis of two samples (two biological replicates per sample) was performed using the DESeq R package (1.18.0). The resulting p-values were adjusted using the Benjamini–Hochberg approach to control the false discovery rate. Genes with an adjusted p-value < 0.05 and log2 (fold change) of 1 by DESeq were assigned as differentially expressed. Additionally, GO enrichment analysis of differentially expressed genes was implemented by the ClusterProfile R package. KOBAS software was used to test the statistical enrichment of DEGs in KEGG pathways.
4.6. RT-qPCR Validation
To verify the reliability of the RNA-Seq results, the total RNA of sequenced samples was used to perform qRT-PCR. Five DEGs were chosen and their expression quantified by qRT-PCR on the LightCycler machine using the 5×FIREPol EvaGreen qPCR mix according to the manufacturer’s instructions. The DcActin gene was used as a reference. Primer 3.0 software program was used to design the primer pairs, and the primer list is shown in Supplementary File S4. The relative gene expression levels were determined using the 2−∆∆CT approach. Each RNA sample has three biological repetitions. Each of them was quantified with three technical repeats.
5. Conclusions
We have identified candidate genes that are involved in the anthocyanin biosynthesis pathways in purple carrots. RNA-Seq analysis was used to find the DEGs contrasting the colored phloem and xylem of taproot of various cultivars. We propose that some MYB, bHLH, and GST genes are related to anthocyanin biosynthesis in a color or genotype-specific manner. In addition, the anthocyanin profiles in purple carrot taproots were identified from the tissue-specific aspect for the first time. The key impact of this work is that it provides insights into candidate genes that may regulate the anthocyanin biosynthesis in a genotype-specific way. A better understanding of the process of anthocyanin production in carrots should provide new opportunities for genetic improvement and management in the future.
Supplementary Materials
The following are available online at https://www.mdpi.com/2223-7747/9/3/344/s1, Supplementary file S1. Chromatographic properties of anthocyanins detected in black carrot tissues by HPLC and LC-MS analysis, RT represent retention time. Supplementary file S2. KEGG pathway of comparison between E vs. F, G vs. H, E vs. G and F vs. H. E and F represents xylem and phloem of ‘Purple 68′, respectively. G and H represent xylem and phloem of ‘Purple Haze’, respectively. Supplementary file S3. FPKM value of differentially expressed structural genes, MYB, bHLH TFs and GST genes in different tissues. CT represents orange cultivar ‘H13.360IND’, E and F represents xylem and phloem of ‘Purple 68′, respectively. G and H represents xylem and phloem of ‘Purple Haze’. Supplementary file S4. Primer list for the qRT-PCR.
Author Contributions
Conceptualization, G.M., S.K.C. and S.K.R.; Formal analysis, G.M.; Funding acquisition, S.K.R.; Investigation, G.M.; Methodology, S.K.R.; Project administration, S.K.R.; Resources, S.K.C. and S.K.R.; Supervision, S.K.R.; Writing—original draft, G.M.; Writing—review and editing, S.K.C. and S.K.R. All authors have read and agreed to the published version of the manuscript.
Funding
This research received no external funding.
Acknowledgments
The authors gratefully acknowledge the financial support from the China scholarship council to Geng Meng. The authors are also grateful for the HPLC technical assistance of Pengming Li and student Guojing Zhang from Northwest Agriculture and Forestry University.
Conflicts of Interest
The authors declare no conflict of interest.
References
- Koes, R.; Verweij, W.; Quattrocchio, F. Flavonoids: A colorful model for the regulation and evolution of biochemical pathways. Trends Plant Sci. 2005, 10, 236–242. [Google Scholar] [CrossRef]
- Zhai, R.; Wang, Z.; Zhang, S.; Meng, G.; Song, L.; Wang, Z.; Li, P.; Ma, F.; Xu, L. Two MYB transcription factors regulate flavonoid biosynthesis in pear fruit (Pyrus bretschneideri Rehd.) Rui. J. Exp. Bot. 2016, 67, 1275–1284. [Google Scholar] [CrossRef] [Green Version]
- Vavilov, N.; Dorofeev, V. Origin and Geography of Cultivated Plants. Available online: https://www.amazon.com/Origin-Geography-Cultivated-Plants-Vavilov/dp/0521111595 (accessed on 8 October 2019).
- Banga, O. Main Types of the Western Carotene Carrot and their Origin. Available online: https://www.amazon.com/types-western-carotene-carrot-origin/dp/B0006BY8VU (accessed on 8 October 2019).
- Simon, P.W. Domestication, Historical Development, and Modern Breeding of Carrot. Plant Breed. 2000, 19, 157–190. [Google Scholar]
- Vavilov, N. Centers of Origin of Cultivated Plants. pp. 495–496. Available online: https://www.researchgate.net/publication/313881301_On_Centers_of_Origin_of_Cultivated_Plants_Case_Study_of_Armenian_Highland (accessed on 8 October 2019).
- Giusti, M.; Wrolstad, R. Acylated anthocyanins from edible sources and their applications in food systems. Biochem. Eng. 2003, 14, 217–225. [Google Scholar] [CrossRef]
- Kammerer, D.; Carle, R.; Schieber, A. Characterization of phenolic acids in black carrots (Daucus carota ssp. sativus var. atrorubens Alef.) by high-performance liquid chromatography/electrospray ionization mass spectrometry. Rapid Commun. Mass Spectrom. 2004, 18, 1331–1340. [Google Scholar] [CrossRef] [PubMed]
- Kurilich, A.C.; Clevidence, B.A.; Britz, S.J.; Simon, P.W.; Novotny, J.A. Plasma and urine responses are lower for acylated vs nonacylated anthocyanins from raw and cooked purple carrots. J. Agric. Food Chem. 2005, 53, 6537–6542. [Google Scholar] [CrossRef] [PubMed]
- Stintzing, F.C.; Carle, R. Functional properties of anthocyanins and betalains in plants, food, and in human nutrition. Trends Food Sci. Technol. 2004, 15, 19–38. [Google Scholar] [CrossRef]
- Montilla, E.C.; Arzaba, M.R.; Hillebrand, S.; Winterhalter, P. Anthocyanin Composition of Black Carrot (Daucus carota ssp. sativus var. atrorubens Alef.) Cultivars Antonina, Beta Sweet, Deep Purple, and ‘Purple Haze’. J. Agric. Food Chem. 2011, 59, 3385–3390. [Google Scholar] [CrossRef] [PubMed]
- Gras, C.C.; Bogner, H.; Carle, R.; Schweiggert, R.M. Effect of genuine non-anthocyanin phenolics and chlorogenic acid on color and stability of black carrot (Daucus carota ssp. sativus var. atrorubens Alef.) anthocyanins. Food Res. Int. 2016, 85, 291–300. [Google Scholar] [CrossRef]
- Kamiloglu, S.; Capanoglu, E.; Bilen, F.D.; Gonzales, G.B.; Grootaert, C.; Van De Wiele, T.; Van Camp, J. Bioaccessibility of Polyphenols from Plant-Processing Byproducts of Black Carrot (Daucus carota L.). J. Agric. Food Chem. 2016, 64, 2450–2458. [Google Scholar] [CrossRef]
- Kammerer, D.; Carle, R.; Schieber, A. Quantification of anthocyanins in black carrot extracts (Daucus carota ssp. sativus var. atrorubens Alef.) and evaluation of their color properties. Eur. Food Res. Technol. 2004, 219, 479–486. [Google Scholar] [CrossRef]
- Koley, T.K.; Singh, S.; Khemariya, P.; Sarkar, A.; Kaur, C.; Chaurasia, S.N.S.; Naik, P.S. Evaluation of bioactive properties of Indian carrot (Daucus carota L.): A chemometric approach. Food Res. Int. 2014, 60, 76–85. [Google Scholar] [CrossRef]
- Stintzing, F.C.; Stintzing, A.S.; Carle, R.; Frei, B.; Wrolstad, R.E. Color and Antioxidant Properties of Cyanidin-Based Anthocyanin Pigments. J. Agric. Food Chem. 2002, 50, 6172–6181. [Google Scholar] [CrossRef] [PubMed]
- Holton, T.A.; Cornish, E.C. Genetics and Biochemistry of Anthocyanin Biosynthesis. Plant Cell 1995, 7, 1071–1083. [Google Scholar] [CrossRef] [PubMed]
- Xu, Z.S.; Huang, Y.; Wang, F.; Song, X.; Wang, G.L.; Xiong, A.S. Transcript profiling of structural genes involved in cyanidin-based anthocyanin biosynthesis between purple and non-purple carrot (Daucus carota L.) cultivars reveals distinct patterns. BMC Plant Biol. 2014, 14, 262. [Google Scholar] [CrossRef] [PubMed] [Green Version]
- Yildiz, M.; Willis, D.K.; Cavagnaro, P.F.; Iorizzo, M.; Abak, K.; Simon, P.W. Expression and mapping of anthocyanin biosynthesis genes in carrot. Theor. Appl. Genet. 2013, 126, 1689–1702. [Google Scholar] [CrossRef]
- Alfenito, M.R.; Souer, E.; Goodman, C.D.; Buell, R.; Mol, J.; Koes, R.; Walbot, V. Functional complementation of anthocyanin sequestration in the vacuole by widely divergent Glutathione S-Transferases. Plant Cell 1998, 10, 1135–1149. [Google Scholar] [CrossRef] [Green Version]
- Klein, M.; Burla, B.; Martinoia, E. The multidrug resistance-associated protein (MRP/ABCC) subfamily of ATP-binding cassette transporters in plants. J. FEBS Lett. 2006, 580, 1112–1122. [Google Scholar] [CrossRef] [Green Version]
- Mueller, L.A.; Goodman, C.D.; Silady, R.A.; Walbot, V. AN9, a petunia glutathione S-transferase required for anthocyanin sequestration, is a flavonoid-binding protein. Plant Physiol. 2000, 123, 1561–1570. [Google Scholar] [CrossRef] [Green Version]
- Marrs, K.A.; Alfenito, M.R.; Lloyd, A.M.; Walbot, V. A glutathione S-transferase involved in vacuolar transfer encoded by the maize gene Bronze-2. Nature 1995, 375, 397–400. [Google Scholar] [CrossRef]
- Kitamura, S.; Shikazono, N.; Tanaka, A. TRANSPARENT TESTA 19 is involved in the accumulation of both anthocyanins and proanthocyanidins in Arabidopsis. Plant J. 2004, 37, 104–114. [Google Scholar] [CrossRef] [PubMed]
- Conn, S.; Curtin, C.; Bézier, A.; Franco, C.; Zhang, W. Purification, molecular cloning, and characterization of glutathione S-transferases (GSTs) from pigmented Vitis vinifera L. cell suspension cultures as putative anthocyanin transport proteins. J. Exp. Bot. 2008, 59, 3621–3634. [Google Scholar] [CrossRef] [PubMed] [Green Version]
- Xu, W.; Dubos, C.; Lepiniec, L. Transcriptional control of flavonoid biosynthesis by MYB-bHLH-WDR complexes. Trends Plant Sci. 2015, 20, 176–185. [Google Scholar] [CrossRef] [PubMed]
- Cone, K.C.; Burr, F.A.; Burr, B. Molecular analysis of the maize anthocyanin regulatory locus C1. Proc. Natl. Acad. Sci. USA 1986, 83, 9631–9635. [Google Scholar] [CrossRef] [PubMed] [Green Version]
- Espley, R.V.; Hellens, R.P.; Putterill, J.; Stevenson, D.E.; Kutty-Amma, S.; Allan, A.C. Red coloration in apple fruit is due to the activity of the MYB transcription factor, MdMYB10. Plant J. 2007, 49, 414–427. [Google Scholar] [CrossRef] [PubMed] [Green Version]
- Takos, A.M.; Jaffé, F.W.; Jacob, S.R.; Bogs, J.; Robinson, S.P.; Walker, A.R. Light-induced expression of a MYB gene regulates anthocyanin biosynthesis in red apples. Plant Physiol. 2006, 142, 1216–1232. [Google Scholar] [CrossRef] [Green Version]
- Rinaldo, A.R.; Cavallini, E.; Jia, Y.; Moss, S.M.A.; McDavid, D.A.J.; Hooper, L.C.; Robinson, S.P.; Tornielli, G.B.; Zenoni, S.; Ford, C.M.; et al. A grapevine anthocyanin acyltransferase, transcriptionally regulated by VvMYBA, can produce most acylated anthocyanins present in grape skins. Plant Physiol. 2015, 169, 1897–1916. [Google Scholar] [CrossRef]
- Feng, S.; Wang, Y.; Yang, S.; Xu, Y.; Chen, X. Anthocyanin biosynthesis in pears is regulated by a R2R3-MYB transcription factor PyMYB10. Planta 2010, 232, 245–255. [Google Scholar] [CrossRef]
- Sun, S.S.; Gugger, P.F.; Wang, Q.F.; Chen, J.M. Identification of a R2R3-MYB gene regulating anthocyanin biosynthesis and relationships between its variation and flower color difference in lotus (Nelumbo Adans.). PeerJ Life Environ. 2016, 4, e2369. [Google Scholar] [CrossRef] [Green Version]
- Xie, X.B.; Li, S.; Zhang, R.F.; Zhao, J.; Chen, Y.C.; Zhao, Q.; Yao, Y.X.; You, C.X.; Zhang, X.S.; Hao, Y.J. The bHLH transcription factor MdbHLH3 promotes anthocyanin accumulation and fruit coloration in response to low temperature in apples. Plant Cell Environ. 2012, 35, 1884–1897. [Google Scholar] [CrossRef]
- Schaart, J.G.; Dubos, C.; Romero De La Fuente, I.; van Houwelingen, A.M.M.L.; de Vos, R.C.H.; Jonker, H.H.; Xu, W.; Routaboul, J.M.; Lepiniec, L.; Bovy, A.G. Identification and characterization of MYB-bHLH-WD40 regulatory complexes controlling proanthocyanidin biosynthesis in strawberry (Fragaria × ananassa) fruits. New Phytol. 2013, 197, 454–467. [Google Scholar] [CrossRef] [PubMed]
- Nakatsuka, T.; Haruta, K.S.; Pitaksutheepong, C.; Abe, Y.; Kakizaki, Y.; Yamamoto, K.; Shimada, N.; Yamamura, S.; Nishihara, M. Identification and characterization of R2R3-MYB and bHLH transcription factors regulating anthocyanin biosynthesis in gentian flowers. Plant Cell Physiol. 2008, 49, 1818–1829. [Google Scholar] [CrossRef] [PubMed] [Green Version]
- Liu, Y.; Lin-Wang, K.; Espley, R.V.; Wang, L.; Yang, H.; Yu, B.; Dare, A.; Varkonyi-Gasic, E.; Wang, J.; Zhang, J.; et al. Functional diversification of the potato R2R3 MYB anthocyanin activators AN1, MYBA1, and MYB113 and their interaction with basic helix-loop-helix cofactors. J. Exp. Bot. 2016, 67, 2159–2176. [Google Scholar] [CrossRef] [PubMed]
- Maeda, K.; Kimura, S.; Demura, T.; Takeda, J.; Ozeki, Y. DcMYB1 acts as a transcriptional activator of the carrot phenylalanine ammonia-lyase gene (DcPAL1) in response to elicitor treatment, UV-B irradiation and the dilution effect. Plant Mol. Biol. 2005, 59, 739–752. [Google Scholar] [CrossRef]
- Wako, T.; Kimura, S.; Chikagawa, Y.; Ozeki, Y. Characterization of MYB proteins acting as transcriptional regulatory factors for carrot phenylalanine ammonia-lyase gene (DcPAL3). Plant Biotechnol. 2010, 27, 131–139. [Google Scholar] [CrossRef] [Green Version]
- Xu, Z.; Feng, K.; Que, F.; Wang, F.; Xiong, A. A MYB transcription factor, DcMYB6, is involved in regulating anthocyanin biosynthesis in purple carrot taproots. Sci. Rep. 2017, 7, 1–9. [Google Scholar] [CrossRef] [Green Version]
- Iorizzo, M.; Cavagnaro, P.F.; Bostan, H.; Zhao, Y.; Zhang, J.; Simon, P.W. A cluster of MYB transcription factors regulates anthocyanin biosynthesis in carrot (Daucus carota L.) root and petiole. Front. Plant Sci. 2018, 9, 1927. [Google Scholar] [CrossRef] [Green Version]
- Giusti, M.; Wrolstad, R.E. Characterization and Measurement of Anthocyanins by UV-visible Spectroscopy. In Handbook of Food Analytical Chemistry; Wiley: Hoboken, NJ, USA, 2001; pp. 19–31. [Google Scholar]
- Smeriglio, A.; Denaro, M.; Barreca, D.; D’Angelo, V.; Germanò, M.P.; Trombetta, D. Polyphenolic profile and biological activities of black carrot crude extract (Daucus carota L. ssp. sativus var. atrorubens Alef.). Fitoterapia 2018, 124, 49–57. [Google Scholar] [CrossRef]
- Hirner, A.A.; Seitz, H.U. Isoforms of chalcone synthase in Daucus carota L. and their differential expression in organs from the European wild carrot and in ultraviolet-A-irradiated cell cultures. Planta 2000, 210, 993–998. [Google Scholar] [CrossRef]
- Ozeki, Y.; Davies, E. Takeda Structure and expression of chalcone synthase gene in carrot suspension cultured cells regulated by 2, 4-D. Plant Cell Physiol. 1993, 34, 1029–1037. [Google Scholar]
- Allan, A.C.; Hellens, R.P.; Laing, W.A. MYB transcription factors that color our fruit. Trends Plant Sci. 2008, 13, 99–102. [Google Scholar] [CrossRef] [PubMed]
- Jaakola, L. New insights into the regulation of anthocyanin biosynthesis in fruits. Trends Plant Sci. 2013, 18, 477–483. [Google Scholar] [CrossRef] [PubMed] [Green Version]
- Kitamura, S.; Akita, Y.; Ishizaka, H.; Narumi, I.; Tanaka, A. Molecular characterization of an anthocyanin-related glutathione S-transferase gene in cyclamen. J. Plant Physiol. 2012, 169, 636–642. [Google Scholar] [CrossRef] [PubMed]
- Algarra, M.; Fernandes, A.; Mateus, N.; de Freitas, V.; Esteves da Silva, J.C.G.; Casado, J. Anthocyanin profile and antioxidant capacity of black carrots (Daucus carota L. ssp. sativus var. atrorubens Alef.) from Cuevas Bajas, Spain. Food Compos. Anal. 2014, 33, 71–76. [Google Scholar] [CrossRef]
- Gläßgen, W.E.; Rose, A.; Madlung, J.; Koch, W.; Gleitz, J.; Seitz, H.U. Regulation of enzymes involved in anthocyanin biosynthesis in carrot cell cultures in response to treatment with ultraviolet light and fungal elicitors. Planta 1998, 204, 490–498. [Google Scholar] [CrossRef] [PubMed]
- Bannoud, F.; Ellison, S.; Paolinelli, M.; Horejsi, T.; Senalik, D.; Fanzone, M.; Iorizzo, M.; Simon, P.W.; Cavagnaro, P.F. Dissecting the genetic control of root and leaf tissue-specific anthocyanin pigmentation in carrot (Daucus carota L.). Theor. Appl. Genet. 2019, 132, 2485–2507. [Google Scholar] [CrossRef]
- Shirley, B.W.; Kubasek, W.L.; Storz, G.; Bruggemann, E.; Koornneef, M.; Ausubel, F.M.; Goodman, H.M. Analysis of Arabidopsis mutants deficient in flavonoid biosynthesis. Plant J. 1995, 8, 659–671. [Google Scholar] [CrossRef]
- Xu, Z.; Yang, Q.; Feng, K.; Xiong, A. Changing Carrot Color: Insertions in DcMYB7 Alter the Regulation of Anthocyanin Biosynthesis and Modification. Plant Physiol. 2019, 181, 195–207. [Google Scholar] [CrossRef]
- Curaba, J.; Bostan, H.; Cavagnaro, P.F.; Senalik, D.; Mengist, M.F.; Zhao, Y.; Simon, P.W.; Iorizzo, M. Identification of an SCPL Gene Controlling Anthocyanin Acylation in Carrot (Daucus carota L.) Root. Front. Plant Sci. 2020, 10, 1770. [Google Scholar] [CrossRef]
- Chezem, W.R.; Clay, N.K. Regulation of plant secondary metabolism and associated specialized cell development by MYBs and bHLHs. Phytochemistry 2016, 131, 26–43. [Google Scholar] [CrossRef] [Green Version]
- Stracke, R.; Werber, M.; Weisshaar, B. The R2R3-MYB gene family in Arabidopsis thaliana. Curr. Opin. Plant Biol. 2001, 4, 447–456. [Google Scholar] [CrossRef]
- Kodama, M.; Brinch-Pedersen, H.; Sharma, S.; Holme, I.B.; Joernsgaard, B.; Dzhanfezova, T.; Amby, D.B.; Vieira, F.G.; Liu, S.; Gilbert, M.T.P. Identification of transcription factor genes involved in anthocyanin biosynthesis in carrot (Daucus carota L.) using RNA-Seq. BMC Genom. 2018, 19, 811. [Google Scholar] [CrossRef] [PubMed]
- Liu, Y.; Qi, Y.; Zhang, A.; Wu, H.; Liu, Z.; Ren, X. Molecular cloning and functional characterization of AcGST1, an anthocyanin-related glutathione S-transferase gene in kiwifruit (Actinidia chinensis). Plant Mol. Biol. 2019, 100, 451–465. [Google Scholar] [CrossRef] [PubMed]
- Zhang, Y.; Li, P.; Cheng, L. Developmental changes of carbohydrates, organic acids, amino acids, and phenolic compounds in ‘Honeycrisp’apple flesh. Food Chem. 2010, 123, 1013–1018. [Google Scholar] [CrossRef]
- Barba-Espín, G.; Glied, S.; Crocoll, C.; Dzhanfezova, T.; Joernsgaard, B.; Okkels, F.; Lütken, H.; Müller, R. Foliar-applied ethephon enhances the content of anthocyanin of black carrot roots (Daucus carota ssp. sativus var. atrorubens Alef.). BMC Plant Biol. 2017, 17, 70. [Google Scholar] [CrossRef] [PubMed] [Green Version]
- Iorizzo, M.; Ellison, S.; Senalik, D.; Zeng, P.; Satapoomin, P.; Huang, J.; Bowman, M.; Iovene, M.; Sanseverino, W.; Cavagnaro, P.; et al. A high-quality carrot genome assembly provides new insights into carotenoid accumulation and asterid genome evolution. Nat. Genet. 2016, 48, 657–666. [Google Scholar] [CrossRef]
Figure 1. Differential pigment accumulation analysis in three carrot cultivars (‘Purple 68′, ‘Purple Haze’ and ‘H13.360IND’). (a) Four growth stages of three carrot cultivars. S1, S2, S3, and S4 represent 4 growth stages of harvested carrots at 60, 80, 100 and 120 days after sowing, respectively. Xy and Ph represent xylem and phloem, respectively. (b) Total anthocyanin content in four growth stages. The data were expressed as mg of cyanin equivalents per g fresh weight.
Figure 1. Differential pigment accumulation analysis in three carrot cultivars (‘Purple 68′, ‘Purple Haze’ and ‘H13.360IND’). (a) Four growth stages of three carrot cultivars. S1, S2, S3, and S4 represent 4 growth stages of harvested carrots at 60, 80, 100 and 120 days after sowing, respectively. Xy and Ph represent xylem and phloem, respectively. (b) Total anthocyanin content in four growth stages. The data were expressed as mg of cyanin equivalents per g fresh weight.

Figure 2. KEGG pathway analysis of different of carrots tissues (a) Phloem and xylem tissue in ‘Purple 68′ and ‘Purple Haze’. (b) Venn diagram of DEGs in the comparison of E vs. F and G vs. H. (c) Venn diagram of DEGs in the comparison of E vs. G and F vs. H. (d–g) Scatterplot of the top 20 enriched KEGG pathways of E vs. F, G vs. H, E vs. G and F vs. H, respectively. Rich factor is the ratio of DEGs counts to this pathway in the annotated genes counts. q ≤ 0.05 indicates significant enrichment. E (xylem of ‘Purple 68′), F (phloem of ‘Purple 68′), G (xylem of ‘Purple Haze’), and H (phloem of ‘Purple Haze’).
Figure 2. KEGG pathway analysis of different of carrots tissues (a) Phloem and xylem tissue in ‘Purple 68′ and ‘Purple Haze’. (b) Venn diagram of DEGs in the comparison of E vs. F and G vs. H. (c) Venn diagram of DEGs in the comparison of E vs. G and F vs. H. (d–g) Scatterplot of the top 20 enriched KEGG pathways of E vs. F, G vs. H, E vs. G and F vs. H, respectively. Rich factor is the ratio of DEGs counts to this pathway in the annotated genes counts. q ≤ 0.05 indicates significant enrichment. E (xylem of ‘Purple 68′), F (phloem of ‘Purple 68′), G (xylem of ‘Purple Haze’), and H (phloem of ‘Purple Haze’).

Figure 3. Expression pattern of differently expressed genes (DEGs) involved in anthocyanin synthesis. (a) Expression pattern of structural genes involved in anthocyanin synthesis. (b) Expression pattern of MYB involved in the different tissues. (c) Expression pattern of bHLH involved in the different tissues. The value of log10 (FPKM + 1) is represented by the depth of color, with red representing upregulation and blue representing downregulation. PAL, phenylalanine ammonia-lyase; C4H, cinnamate 4-hydroxylase; 4CL, 4-coumarate-CoA ligase; CHS, chalcone synthase; CHI, chalcone isomerase; F3H, flavonoid 3 hydroxylase; F3′H, flavonol 3′ hydroxylase; DFR, dihydroflavonol 4-reductase; LAR, leucoanthocyanidin reductase; UFGT, UDP glucose: flavonoid-O-glucosyltransferase. E (xylem of ‘Purple 68′), F (phloem of ‘Purple 68′), G (xylem of ‘Purple Haze’) and H (phloem of ‘Purple Haze’).
Figure 3. Expression pattern of differently expressed genes (DEGs) involved in anthocyanin synthesis. (a) Expression pattern of structural genes involved in anthocyanin synthesis. (b) Expression pattern of MYB involved in the different tissues. (c) Expression pattern of bHLH involved in the different tissues. The value of log10 (FPKM + 1) is represented by the depth of color, with red representing upregulation and blue representing downregulation. PAL, phenylalanine ammonia-lyase; C4H, cinnamate 4-hydroxylase; 4CL, 4-coumarate-CoA ligase; CHS, chalcone synthase; CHI, chalcone isomerase; F3H, flavonoid 3 hydroxylase; F3′H, flavonol 3′ hydroxylase; DFR, dihydroflavonol 4-reductase; LAR, leucoanthocyanidin reductase; UFGT, UDP glucose: flavonoid-O-glucosyltransferase. E (xylem of ‘Purple 68′), F (phloem of ‘Purple 68′), G (xylem of ‘Purple Haze’) and H (phloem of ‘Purple Haze’).

Figure 4. Expression patterns of DcGSTs and deduced amino acid sequences analysis. (a) Heatmap of DEGs of GST across four comparisons in different tissues. Expression values of four libraries are presented as normalized log10 (RPKM + 1). Red and blue colors indicate upregulated and downregulated transcripts, respectively. E (xylem of ‘Purple 68′), F (phloem of ‘Purple 68′), G (xylem of ‘Purple Haze’) and H (phloem of ‘Purple Haze’). (b) Multiple alignments of deduced amino acid sequences of DcGST1 (LOC108205254) with other functionally anthocyanin-related GSTs. Black boxes represent amino acid residues of GST involved in anthocyanin transporting [47]. The GenBank accession numbers are PhAN9 (CAA68993), CkmGST3 (BAM14584), VvGST4 (AAX81329), and LcGST4 (ALY05893).
Figure 4. Expression patterns of DcGSTs and deduced amino acid sequences analysis. (a) Heatmap of DEGs of GST across four comparisons in different tissues. Expression values of four libraries are presented as normalized log10 (RPKM + 1). Red and blue colors indicate upregulated and downregulated transcripts, respectively. E (xylem of ‘Purple 68′), F (phloem of ‘Purple 68′), G (xylem of ‘Purple Haze’) and H (phloem of ‘Purple Haze’). (b) Multiple alignments of deduced amino acid sequences of DcGST1 (LOC108205254) with other functionally anthocyanin-related GSTs. Black boxes represent amino acid residues of GST involved in anthocyanin transporting [47]. The GenBank accession numbers are PhAN9 (CAA68993), CkmGST3 (BAM14584), VvGST4 (AAX81329), and LcGST4 (ALY05893).

Figure 5. Validation of the RNA-seq results by qRT-PCR. Bars show means of Log2 FPKM data and Log2 qRT-PCR data of two and three biological replicates, respectively. FPKM means the expected number of fragments per kilobase of transcript sequence per Millions base pairs sequenced. E (xylem of ‘Purple 68′), F (phloem of ‘Purple 68′), G (xylem of ‘Purple Haze’) and H (phloem of ‘Purple Haze’).
Figure 5. Validation of the RNA-seq results by qRT-PCR. Bars show means of Log2 FPKM data and Log2 qRT-PCR data of two and three biological replicates, respectively. FPKM means the expected number of fragments per kilobase of transcript sequence per Millions base pairs sequenced. E (xylem of ‘Purple 68′), F (phloem of ‘Purple 68′), G (xylem of ‘Purple Haze’) and H (phloem of ‘Purple Haze’).


Table 1. Summary of RNA-Seq data and reads mapping.
| Sample Name | CT | E | F | G | H |
|---|---|---|---|---|---|
| Raw reads | 45,469,730 | 47,158,771 | 47,299,178 | 42,815,288 | 45,142,919 |
| Clean reads | 44,276,147 | 46,187,029 | 46,303,908 | 41,744,653 | 43,245,500 |
| Clean bases | 6.64 | 6.93 | 6.945 | 6.26 | 6.49 |
| Q20 (%) | 97.595 | 97.545 | 97.575 | 97.615 | 97.7 |
| Q30 (%) | 93.625 | 93.48 | 93.56 | 93.64 | 93.675 |
| GC content | 43.9% | 44.855% | 44.86% | 44.69% | 44.715% |
| Total mapped | 28,571,418 (64.37%) |
29,128,798 (63.06%) |
28,684,092 (61.99%) |
28,468,352.5 (68.19%) |
28,480,330 (66.06%) |
| Uniquely mapped | 27,830,779.5 (62.70%) | 28,343,267 (61.36%) | 27,809,975.5 (60.09%) | 27,807,121.5 (66.61%) | 27,840,397.5 (64.58%) |
The different samples for RNA isolation represent CT (whole slice of ‘H13.360IND’), E (xylem of ‘Purple 68′), F (phloem of ‘Purple 68′), G (xylem of ‘Purple Haze’) and H (phloem of ‘Purple Haze’). Q20 (%) and Q30 (%) are the percentages of reads with quality scores of >20 and >30, respectively.
© 2020 by the authors. Licensee MDPI, Basel, Switzerland. This article is an open access article distributed under the terms and conditions of the Creative Commons Attribution (CC BY) license (http://creativecommons.org/licenses/by/4.0/).
Share and Cite
MDPI and ACS Style
Meng, G.; Clausen, S.K.; Rasmussen, S.K. Transcriptome Analysis Reveals Candidate Genes Related to Anthocyanin Biosynthesis in Different Carrot Genotypes and Tissues. Plants 2020, 9, 344. https://doi.org/10.3390/plants9030344
AMA Style
Meng G, Clausen SK, Rasmussen SK. Transcriptome Analysis Reveals Candidate Genes Related to Anthocyanin Biosynthesis in Different Carrot Genotypes and Tissues. Plants. 2020; 9(3):344. https://doi.org/10.3390/plants9030344
Chicago/Turabian StyleMeng, Geng, Sabine K. Clausen, and Søren K. Rasmussen. 2020. "Transcriptome Analysis Reveals Candidate Genes Related to Anthocyanin Biosynthesis in Different Carrot Genotypes and Tissues" Plants 9, no. 3: 344. https://doi.org/10.3390/plants9030344
Note that from the first issue of 2016, this journal uses article numbers instead of page numbers. See further details here.