


Abstract
Pitted impact deposits (PIDs) on Vesta have been shown to exhibit distinct spectral characteristics with respect to their surrounding host deposits and other typical Vestan areas regarding the first major pyroxene absorption near 0.9 μm. The PIDs, especially those in the ejecta blanket of the large crater Marcia, show higher reflectance and pyroxene band strength with respect to their impact deposit surroundings. This study complements the spectral characterization of the PIDs on Vesta with Visible and Infrared Spectrometer observations obtained by NASA's Dawn mission. In particular, we focus on the second major pyroxene absorption near 1.9 μm. We analyze nine PIDs in the ejecta blanket of the crater Marcia, as well as PIDs within the crater-fill deposits of the craters Marcia, Cornelia, and Licinia. We find that the second pyroxene absorption behaves in similar ways as the first major pyroxene absorption. The PIDs in Marcia's ejecta blanket show higher reflectance and pyroxene band strength with respect to their immediate impact deposit surroundings. The PIDs present in the crater-fill deposits of Marcia, Cornelia, and Licinia, however, do not show such spectral characteristics. This is also consistent with previous observations of the first pyroxene absorption band. Based on the experimental results of other studies, we speculate that the observed spectral distinctness arises from an oxidation process in the interior of impact deposits, where Fe cations migrate within their host pyroxene grains. Thus, the surfaces of (melt-bearing) impact deposits might be different from their interiors, apart from space-weathering effects.
Export citation and abstract BibTeX RIS

Original content from this work may be used under the terms of the Creative Commons Attribution 4.0 licence. Any further distribution of this work must maintain attribution to the author(s) and the title of the work, journal citation and DOI.
1. Introduction
The pitted impact deposits (PIDs) on Vesta were geomorphologically and spectrally described in detail by Denevi et al. (2012) and Michalik et al. (2021). Most of their implications are based on more extensive observations and calculations regarding similar geomorphological features on Mars by Boyce et al. (2012 and Tornabene et al. (2012). The PIDs likely represent remnants of rapid volatile loss, forming densely clustered cone-shaped pits. These pits lack raised rims, as would be typical for impact craters, and often overlap and coalesce (Denevi et al. 2012). Vesta's youngest, large crater Marcia (age of about 40–390 Ma, Williams et al. 2014; diameter of roughly 60 km, e.g., Denevi et al. 2012) and its vicinity possess over 96% of the PIDs on the whole of Vesta, although some of those might be associated with the nearby crater Calpurnia (Michalik et al. 2021).
Michalik et al. (2021) found that the formation of the Marcia-related PIDs appears to be dependent on deposit thickness and therefore on the preexisting topography where ejecta accumulated posterior to the impact. Furthermore, they observed distinct spectral properties for the PIDs that are different from the surrounding host deposit. Where the surface is pitted, the material shows higher reflectance and pyroxene band strength, which cannot be attributed to variations in grain size, roughness, shock state, or glass content (Michalik et al. 2021). Vesta's surface spectra are dominated by pyroxene (e.g., McCord et al. 1970; De Sanctis et al. 2012), which is characterized by two major absorptions near 0.9 and 1.9 μm due to spin-allowed crystal field transitions of Fe2+ in the M2 crystallographic site (e.g., Burns 1993). The pyroxene band strength in Michalik et al. (2021) was inferred from Dawn Framing Camera (FC) data that cover the first major pyroxene absorption near 0.9 μm with four color filters (e.g., Sierks et al. 2011; Reddy et al. 2012b; Thangjam et al. 2013; Michalik et al. 2021). As the surrounding host deposits were deposited at the same time as the PIDs, an age difference as the cause for the spectral differences can also be excluded (Michalik et al. 2021). In order to complement and deepen/verify the findings of Michalik et al. (2021), we study the spectrally higher resolved Dawn VIR-IR data of 12 Vestan PID areas in this work. We infer implications for the PID formation on Vesta and the processes leading to their distinct spectral characteristics. We focus on the second pyroxene absorption band near 1.9 μm and investigate whether its spectral behavior follows the variations in the spectral properties seen by the FC. Michalik et al. (2021) also showed 2.8 μm absorption band depth data generated by Combe et al. (2015), which indicate the OH distribution and imply OH depletion associated with the PIDs. This has confirmed that the PIDs are associated with the loss of OH, which was already suspected by Denevi et al. (2012).
2. Data and Methods
The VIR experiment (De Sanctis et al. 2011) was the Italian contribution to the Dawn mission and was built by the Instituto Nationale di Astrofisica (INAF) and SELEX Galileo. It is a hyperspectral mapping spectrometer that covers wavelength ranges from the ultraviolet (UV) at 0.25 μm to the infrared (IR) at 5 μm. The instrument is composed of two channels (VIS and IR) with 432 bands, one covering the range from 0.25 to 1.05 μm and the other from 1.0 to 5.0 μm with a spectral sampling of 1.8 and 9.8 nm band–1, respectively (De Sanctis et al. 2011). It thus has a significantly higher spectral resolution than the FC and covers a wider wavelength range. Therefore, it can identify minerals and molecules on the basis of more subtle spectral features and those that show distinct spectral features outside the range of FC filters. Although the spatial resolution of the VIR data is significantly lower than that of the FC data (250 μrad pixel−1, which is about 170 m pixel−1 for the selected cubes, whereas the color FC data have spatial resolutions of around 60 m pixel−1), several PIDs are still sufficiently identifiable, also due to their spectral distinctness. Here we present a total of six VIR-IR cubes, four of which display PIDs related to Marcia and two of which display PIDs within the crater-fill deposits of Licinia and Cornelia, the latter being two smaller craters (with diameters of about 15–25 km) that do not feature any PIDs in their ejecta, in contrast to the larger crater Marcia. We display data for a total of nine PIDs that could be identified in VIR data due to their spectral signature and large enough size. Most PIDs have lower spatial extents and fewer spectral variations and cannot be accurately identified in VIR data, which is why this study is limited to nine PIDs in the ejecta blanket of Marcia and the crater-fill PIDs of Marcia, Cornelia, and Licinia craters.
We use the recently recalibrated VIR-IR data with a method established by Rousseau et al. (2019). This improved calibration was first done for Ceres VIR-VIS data but was applied to Vestan data as well (e.g., Rousseau et al. 2020). The VIS data were recalibrated differently than the IR data due to temperature effects affecting the CCD. Raponi et al. (2021) introduced newly calibrated IR data for Ceres, applying the procedure presented in Rousseau et al. (2020). Vesta IR data was recalibrated according to these presented methods. A photometric correction was applied following the Hapke function, including the photometric properties of Vesta described in Li et al. (2013). For the sake of readability, the resulting I/F values are referred to by the term "reflectance" throughout this paper.
The recalibration includes the use of a multiplicative correction factor for every single VIR spectrum that was derived by generating a ratio between a smoothed ground-based spectrum and an averaged VIR-IR spectrum after artifact correction. Artifact correction is presented in Carrozzo et al. (2016) and comprises the correction for the "odd–even band effect," where the spectra show a sawtooth pattern associated with an even or odd band number; "spectral spikes," which are random anomalies caused by random events on the detector pixels (e.g., cosmic rays); and "vertical stripes" in images caused by different relative responses of the sample detectors. Moreover, the nonhomogeneous instrumental response of the detector can cause artifacts at a smaller spectral scale (Carrozzo et al. 2016).
The used VIR cubes were recalibrated at INAF and have latitude and longitude values slightly offset from those of the German Aerospace Center (DLR) FC Low Altitude Mapping Orbit (LAMO) mosaic (Roatsch et al. 2013) used here for spatial context. The difference is due to varying spice kernels that were updated at a later stage of the Dawn mission but not implemented in the older FC mosaics. Therefore, we manually georeferenced the VIR images in order to show them with higher-resolution spatial and topographic context over the FC LAMO mosaics. Small latitude/longitude offsets and distortions of approximately <5 pixels are therefore present but do not downgrade the results.
We will show both the whole cubes at different wavelengths and a "band strength ratio," as well as the mean spectra of multiple pixels extracted from these cubes. The pixel numbers and standard deviations of these mean spectra are displayed in Table A1 in the Appendix. The minimum and maximum standard deviations are reported over all of the mean spectra, while minimum values typically occur at shorter wavelengths and higher values occur at longer wavelengths. Pixel numbers vary according to the available size of the locations of interest. We calculate the band strength ratio of the second pyroxene absorption according to the method presented in Michalik et al. (2021) for a more suitable comparison of the two major pyroxene absorptions. This ratio is therefore composed of the near-highest reflectance on the left shoulder of the second pyroxene absorption and at the approximate absorption center, i.e., 1.446/1.967 [μm]. The band centers in Table 1 were derived after continuum removal and visually confirmed. We use VIR spectra without interpolating or smoothening the data in between the sampling wavelengths; thus, the "real" band center values can be slightly offset, which does not appear to influence the results. We show both the absolute reflectance spectra and after continuum removal to visualize the band depth differences. The continuum was derived by applying a tangent at the two maximum reflectance values on the left and right shoulders of the pyroxene absorption. We also report on the peak reflectance wavelength position of the spectrum near 1.4 μm, which indicates the abundance of Fe2+ in the M1 crystallographic site of pyroxene. Occasionally, missing data occur, which we left blank and did not interpolate.
Table 1. Spectral Parameters of the Displayed Locations of Interest
| Location | I/F at 1.446 μm | 1.446/1.910 (μm) | Bc a (μm) | Pp a (μm) |
|---|---|---|---|---|
| PID 1 | 0.248 | 1.492 | 1.976 | 1.446 |
| Surrounding 1 | 0.214 | 1.345 | 1.967 | 1.484 |
| PID 2 | 0.253 | 1.452 | 1.967 | 1.484 |
| Surrounding 2 | 0.212 | 1.352 | 1.967 | 1.484 |
| PID 3 | 0.248 | 1.529 | 1.967 | 1.446 |
| Surrounding 3 | 0.200 | 1.351 | 1.938 | 1.475 |
| PID 4 | 0.235 | 1.453 | 1.957 | 1.446 |
| Surrounding 4 | 0.203 | 1.344 | 1.938 | 1.484 |
| PID 5 | 0.240 | 1.646 | 1.967 | 1.390 |
| Surrounding 5 | 0.208 | 1.414 | 1.967 | 1.475 |
| PID 6 | 0.235 | 1.467 | 1.967 | 1.446 |
| Surrounding 6 | 0.213 | 1.368 | 1.967 | 1.456 |
| PID 7 | 0.215 | 1.391 | 1.967 | 1.446 |
| Surrounding 7 | 0.191 | 1.316 | 1.967 | 1.465 |
| PID 8 | 0.206 | 1.374 | 1.967 | 1.446 |
| Surrounding 8 | 0.192 | 1.315 | 1.976 | 1.475 |
| PID 9 | 0.193 | 1.408 | 1.967 | 1.409 |
| Surrounding 9 | 0.188 | 1.326 | 1.967 | 1.465 |
| Halo | 0.239 | 1.582 | 1.967 | 1.446 |
| Crater-fill PID | 0.218 | 1.388 | 1.967 | 1.484 |
| Marcia crater wall | 0.233 | 1.506 | 1.957 | 1.484 |
Note.
a "Bc" stands for band center (after continuum removal), and "Pp" presents the peak positions of the maximum I/F values near the left pyroxene absorption shoulder.Download table as: ASCIITypeset image
The FC mosaics were calibrated at DLR using the methods described in Schröder et al. (2013, 2014). The LAMO images have spatial resolutions of up to 16 m pixel−1. We also display the PIDs and other regions of interest on the FC data, with the PIDs' locations and extent taken from Michalik et al. (2021). The Digital Terrain Model in Figure 1 is derived from Preusker et al. (2014, 2016) with a lateral resolution of about 70 m pixel−1 and a vertical resolution of about 6 m (no vertical exaggeration applied).

Figure 1. Outline of VIR cubes depicted and described in this section on the FC clear filter LAMO data (left) and topographic context (right). The digital terrain model of the right panel is derived from Preusker et al. (2014, 2016). Numbers in left panel: 1, cube 394858895; 2, cube 395166968; 3, cube 394992761; 4, cube 395301549.
Download figure:
Standard image High-resolution image3. Results
3.1. Marcia and Its Vicinity
What was observed for the first pyroxene absorption band of the PIDs in the Marcia region appears to be valid for the second pyroxene absorption band as well. The reflectance at around 1.45 μm is elevated for PIDs with respect to their impact deposit surroundings, and the band ratio characterizing the band strength, 1.446/1.967 [μm], is considerably higher with respect to other locations in the vicinity. Here we display three VIR-IR cubes that display PIDs in the ejecta of Marcia and one cube that covers the interior parts of the crater. We furthermore display the mean spectra extracted from the cubes and give the spatial context at the end of this section. Figure 1 illustrates the spatial and topographic context of the cubes over the Dawn FC LAMO data.
Figure 2 shows an area west of Marcia (cube 1) with several of the most prominent PIDs (mostly in the lower part of the image; see Figure 3). This cube and its PIDs are situated within a brighter ejecta unit (Michalik et al. 2021). While the PIDs can (for most occurrences) already be distinguished from their surroundings by higher reflectance at 1.446 μm (but not at 1.967 μm near the band center), they clearly differ distinctly from the surroundings by their higher 1.446/1.967 [μm] ratio values. This can be observed in detail in Figure 3, where the spatial context and exact PID location are given. Some locations unrelated to PIDs also show higher reflectance and pyroxene band strength, yet most of them appear to represent impacts into those impact deposits, which could reveal similar material as seen at the PIDs.

Figure 2. The VIR-IR cube 394858895 at (a) 1.446 μm, (b) 1.967 μm, and (c) 1.446/1.967 [μm].
Download figure:
Standard image High-resolution image
Figure 3. The VIR cube 394858895 on the Dawn FC mosaic with locations of PIDs 1–4. (a) Spatial context image in FC clear filter data. The Marcia western rim can be seen on the right. (b) Reflectance ratio 1.446/1.967 [μm] (50% transparency on FC mosaic). (c) Superposed PID map (on 85% transparent 1.446/1.967 [μm] ratio and FC mosaic) with different color code than in Michalik et al. (2021) for easier perception.
Download figure:
Standard image High-resolution imageThe observation of PIDs standing out in their 1.446/1.967 [μm] ratio values clearly shows that both pyroxene band I and pyroxene band II absorptions are similarly affected by a mechanism altering the spectra of the impact deposits. However, as mentioned in Michalik et al. (2021), this alteration appears to occur only in the subsurface, as only those parts of the impact deposits show this effect when brought to the surface (due to volatile and particle release through either PIDs or post-Marcia impacts).
Figure 4 shows the mean spectra of the PID locations numbered in Figure 3(c) and their host surrounding impact deposit (SID). The insets show the continuum-removed spectra. All of the PID spectra shown exhibit higher overall reflectance and pyroxene band strength with respect to their SID. This mirrors the results for the first pyroxene absorption at around 0.9 μm shown in Michalik et al. (2021).

Figure 4. Mean absolute I/F vs. wavelength of PIDs 1–4 and their SID taken from VIR cube 394858895. Insets include continuum-removed spectra. Spatial context and locations are given in Figure 14. For all four PIDs, the SID shows lower overall reflectance and pyroxene absorption strength.
Download figure:
Standard image High-resolution imageFigure 5 shows the data of VIR cube 395166968 (labeled "2" in Figure 1), which is located just north of Marcia and covers areas of brighter and slightly darker ejecta units (Michalik et al. 2021). In this cube, it is remarkable to observe how strongly the ratio 1.446/1.967 [μm] deviates from the perception gained by reflectance only. The most prominent PID in this image (lower left) is PID 5, which corresponds to the PID depicted in Figure 11(f) of Michalik et al. (2021). It does not show a particularly elevated reflectance at 1.446 and 1.967 μm with respect to other materials in its vicinity and can hardly be made out. However, as seen in Figure 5(c), the pyroxene band strength ratio (1.446/1.967 [μm]) clearly points out the location of this PID (black arrow). Spatial context and PID locations are given in Figure 6. We show two mean spectra of two different PIDs extracted from VIR cube 395166968 in Figure 7, likewise showing higher overall reflectance and pyroxene band strength than their SID.

Figure 5. The VIR-IR cube 395166968 at (a) 1.446 μm, (b) 1.967 μm, and (c) 1.446/1.967 [μm]. The black arrow in panel (c) denotes PID 5.
Download figure:
Standard image High-resolution image
Figure 6. The VIR cube 395166968 on the Dawn FC mosaic with the locations of PIDs 5 and 6. (a) Spatial context image in FC clear filter data. (b) Reflectance ratio 1.446/1.967 [μm] (50% transparency on the FC mosaic). (c) Superposed PID map (on 85% transparent 1.446/1.967 [μm] ratio and FC mosaic) with different color code than in Michalik et al. (2021) for easier perception.
Download figure:
Standard image High-resolution image
Figure 7. Mean absolute I/F vs. wavelength of PIDs 5 and 6 and their SID taken from VIR cube 395166968. Insets include continuum-removed spectra. Spatial context and locations are given in Figure 14. For both PIDs, the SID shows lower overall reflectance and pyroxene absorption strength.
Download figure:
Standard image High-resolution imageFigure 8 shows VIR cube 394992761, covering an area just south of Marcia (labeled "3" in Figure 1). The three PIDs shown are situated within a thicker ejecta unit, where pyroxene band strengths generally exhibit lower values than in the brighter areas in which PIDs 1–5 are situated (Michalik et al. 2021). This can similarly be observed in VIR data. However, the reflectance values resemble each other for all three cubes displaying areas external to Marcia (compare Figures 2, 5, and 8), mostly due to the two prominent craters exposing bright material in the lower part of VIR cube 394992761 (Figure 8). These are situated at elevated altitudes (Figure 1, right), where Marcia ejecta might not be present anymore. Figure 9(a) additionally displays lobate flow lines (dashed black) that appear to represent the boundary of Marcia's continuous ejecta blanket. This appears to coincide with the onset of increasing altitudes as seen in Figure 1. Beyond this boundary, no PIDs were identified (within the resolution limits).

Figure 8. The VIR-IR cube 394992761 at (a) 1.446 μm, (b) 1.967 μm, and (c) 1.446/1.967 [μm].
Download figure:
Standard image High-resolution image
Figure 9. The VIR cube 394992761 on the Dawn FC mosaic with locations of PIDs 7–9 (panel (c)). (a) Spatial context image in FC clear filter data. (b) Reflectance ratio 1.446/1.967 [μm] (50% transparency on the FC mosaic). (c) Superposed PID map (on 85% transparent 1.446/1.967 ratio and FC mosaic) with different color code than in Michalik et al. (2021) for easier perception.
Download figure:
Standard image High-resolution imageThe PIDs in this cube do not prominently stand out like in the other VIR cubes presented. Their location can be made out in Figures 9 and 14. The spectra of these three PIDs (7–9) are presented in Figure 10. The PID 9 does not exhibit an overall brighter reflectance than its surroundings, but while showing mostly similar reflectance values (even slightly elevated at 1.446 μm), it clearly features a stronger pyroxene absorption.

Figure 10. Mean absolute I/F vs. wavelength of PIDs 7–9 and their SID taken from VIR cube 394858895. Insets include continuum-removed spectra. Spatial context and locations are given in Figure 14. For PIDs 7 and 8, the SID shows lower overall reflectance and pyroxene absorption strength. However, PID 9 shows very similar overall reflectance but higher pyroxene band strength than its SID.
Download figure:
Standard image High-resolution imageFollowing the analysis of the Marcia-surrounding PIDs, we present VIR cube 395301549, which depicts a part of the Marcia crater itself. Visible are portions of the crater-fill deposits that feature PIDs. The FC data of the crater-fill deposits within Marcia show a spectral "halo" around the central PID/crater-fill material (Michalik et al. 2021). While the central PID shows lower reflectance and band strength with respect to its crater-wall surrounding, the halo—which also features small pits; see Michalik et al. (2021)—exhibits higher reflectance and pyroxene band strength just like the other PIDs in the ejecta of Marcia. The same can be observed in the VIR-IR data, which are shown in the upper right portion of Figure 11(c). Spatial context and locations can be viewed in Figure 12.

Figure 11. The VIR-IR cube 395301549 at (a) 1.446 μm, (b) 1.967 μm, and (c) 1.446/1.967 [μm].
Download figure:
Standard image High-resolution image
Figure 12. The VIR cube 395301549 on the Dawn FC mosaic with the locations of Marcia's crater-fill PIDs and some external ones (lower part of image). (a) Spatial context image in FC clear filter data. (b) Superposed reflectance ratio 1.446/1.967 [μm] (50% transparency on the FC mosaic). (c) Superposed PID map (on 85% transparent 1.446/1.967 [μm] ratio and FC mosaic) with different color code than in Michalik et al. (2021) for easier perception.
Download figure:
Standard image High-resolution imageFigure 13 displays the mean spectra of the halo, the crater-fill PID, and a selected crater-wall segment. Reflectance and band strength are highest for the halo, which again mirrors the results from Michalik et al. (2021). Figure 14 shows the locations of the derived spectra that are depicted on 1.446/1.967 [μm] images, as PIDs are identified more easily in those images.

Figure 13. Mean I/F vs. wavelength of the halo, the nearby crater wall, and the crater-fill PID of Marcia. Left panel: absolute I/F. Right panel: spectra after continuum removal. Note that the halo shows the highest overall reflectance and strongest pyroxene absorption. Spatial context is given in Figure 14.
Download figure:
Standard image High-resolution image
Figure 14. The VIR locations of the depicted PIDs (black plus signs), their SIDs (white plus signs), as well as the crater-fill halo (black plus signs in panel (d)), crater-fill PID (white plus sign in panel (d)), and Marcia crater wall (green plus sign in panel (d)). (a) Cube 394858895, (b) cube 395166968, (c) cube 394992761, (d) cube 395301549. All locations are depicted on 1.446/1.967 [μm] ratios for easier identification.
Download figure:
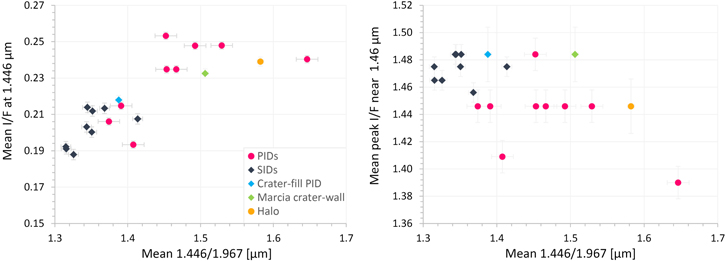
Standard image High-resolution imageTable 1 reports the wavelength positions of the pyroxene band centers (after continuum removal), the mean reflectance values at 1.446 μm, the values of the band strength ratio 1.446/1.967 [μm], and the peak position of the maximum reflectance values of the left pyroxene absorption shoulder. The PIDs have generally higher reflectance values at 1.446 μm, with an average increase of 0.028 (±0.012). They also have generally higher 1.446/1.967 [μm] values, with an average increase of 0.120 (±0.053). These generally higher values are visualized in Figure 15 (left).

Figure 15. Left panel: mean 1.446/1.967 [μm] (pyroxene band strength indicator) vs. mean I/F at 1.446 μm. Right panel: mean 1.446/1.967 [μm] vs. mean peak I/F near 1.446 μm. Error bars indicate the average standard deviations of each group of locations of interest (PIDs, SIDs, and locations associated with the crater-fill of Marcia).
Download figure:
Standard image High-resolution imageThe band centers of the second pyroxene absorption of PIDs and their adjacent surroundings (impact deposits) do not show a significant difference between PIDs and their SIDs. In five out of nine comparisons (PIDs versus their surroundings), the band centers are the same. For three out of nine comparisons, the band centers are at shorter wavelengths for surroundings versus PIDs, and in one out of nine comparisons, they are at longer wavelengths. For two locations, the difference is only one sampling size and thus might not be real. For the other two locations with different band centers, the difference is about 0.029 μm, which represents three bands of the VIR instrument. The band center of the Marcia crater wall is at slightly shorter wavelengths (one sampling size) than the band centers of the halo and crater-fill PID.
In nine out of 10 comparisons (including halo versus crater wall here), the PIDs and halo have left shoulder peak reflectance values at shorter wavelengths than their surroundings (average of −0.038 μm). For one PID and its surroundings, the peak positions are at the same wavelengths. This is displayed in Figure 15 (right).
Figure 15 illustrates reflectance at 1.446 μm and peak reflectance near 1.446 μm versus the band strength ratio. The PIDs and halo generally have significantly higher reflectance values at 1.446 μm and 1.446/1.967 [μm] values with respect to their SIDs, as well as the Marcia crater wall and crater-fill PID. Likewise, their peak reflectance values tend to be located at shorter wavelengths than those of their SIDs, although the error bars are quite large for the peak reflectance values, possibly due to the remaining artifacts in the data (e.g., the sawtooth pattern).
These observations have very similar results to the FC data analysis (Michalik et al. 2021), where the spectral characteristics of PIDs regarding their first pyroxene band absorptions are distinct from their SIDs and also from more typical Vestan values. The higher resolution of the FC data and the larger data set enabled a more robust conclusion.
3.2. Craters Cornelia and Licinia
The craters Cornelia and Licinia also feature PIDs, but solely in their crater-fill deposits. The FC data do not show higher reflectance and/or pyroxene band strength with respect to their surroundings (stated in Michalik et al. 2021). Instead, and similar to the central crater-fill PID of Marcia, the PIDs within Licinia and Cornelia appear lower in reflectance and pyroxene band strength.
Figure 16 displays the reflectance at 1.446 and 1.967 μm and the ratio 1.446/1.967 [μm] for parts of the Cornelia crater. For the Cornelia crater-fill PID, no elevated reflectance or pyroxene band strength can be observed (see Figure 17 for spatial context). Likewise, no elevated reflectance or pyroxene band strength can be made out for the PIDs within Licinia, which is shown in Figures 18 and 19.

Figure 16. The VIR-IR cube 373313780 depicting Cornelia crater at (a) 1.446 μm, (b) 1.967 μm, and (c) 1.446/1.967 [μm].
Download figure:
Standard image High-resolution image
Figure 17. The VIR cube 373313780 on the Dawn FC mosaic with the locations of Cornelia's crater-fill PIDs. (a) Spatial context image in FC clear filter data. (b) Superposed reflectance ratio 1.446/1.967 [μm] (50% transparency on the FC mosaic). (c) Superposed PID map (on 85% transparent 1.446/1.967 [μm] ratio and FC mosaic) with different color code than in Michalik et al. (2021) for easier perception.
Download figure:
Standard image High-resolution image
Figure 18. The VIR-IR cube 395387692 depicting Licinia crater at (a) 1.446 μm, (b) 1.967 μm, and (c) 1.446/1.967 [μm].
Download figure:
Standard image High-resolution image
Figure 19. The VIR cube 395387692 on the Dawn FC mosaic with the locations of Cornelia's crater-fill PIDs. (a) Spatial context image in FC clear filter data. (b) Superposed reflectance ratio 1.446/1.967 [μm] (50% transparency on the FC mosaic). (c) Superposed PID map (on 85% transparent 1.446/1.967 [μm] ratio and FC mosaic) with different color code than in Michalik et al. (2021) for easier perception.
Download figure:
Standard image High-resolution image4. Discussion
In this follow-up work to Michalik et al. (2021), we report on the spectral characteristics of the PIDs on Vesta regarding their second pyroxene absorption and overall reflectance in the wavelength range from 1.0 to 3.0 μm as seen by the Dawn VIR instrument. The findings here are very similar to what was observed with the Dawn FC data for the first major pyroxene absorption band near 0.9 μm in Michalik et al. (2021). The PIDs in the ejecta blanket of Marcia exhibit higher reflectance than their SIDs and especially higher pyroxene band strength, not only in the VIS region but also in the NIR region, which gives implications toward possible mechanisms and processes causing the observed spectral characteristics, as discussed in the following.
Moreover, the prominent spectral characteristics of the halo on the margins of the crater-fill PID within the Marcia crater are as apparent as in the FC data. The PIDs in the crater-fill deposits of the smaller craters Cornelia and Licinia show lower reflectance and pyroxene band strength, likewise resembling the results from the FC data. This indicates that either the observed process did not occur for Cornelia's and Licinia's crater-fill PIDs or that the "real" spectral characteristics of these PIDs are obscured, possibly by mass wasting and inflow of material, as Michalik et al. (2021) speculated for parts of the Marcia crater-fill PIDs as well. However, secondary processes might also play a role; i.e., the halo and its PIDs might have formed at a later stage due to the release of deep-buried volatiles along the deposit margins (Michalik et al. 2021), and therefore the ejected materials seen at the halo might have experienced heating for a longer duration.
A unique process is changing these likely melt-bearing impact deposits in their interiors, brought up to the surface by the devolatilization process. These changes occur after deposition, likely initiated by impact heat. Michalik et al. (2021) showed that the distinct spectral characteristics of PIDs are inconsistent with variations in grain size, roughness, shock state, or glass content. With increasing grain size, reflectance increases while band strength decreases (and vice versa for decreasing grain size; e.g., Clark 1999). This contradicts our observations. Similarly, different states of roughness can be excluded, as Harloff & Arnold (2001) showed that roughness tends to behave similarly to grain size. The results of Tompkins & Pieters (2010) indicate that variations in glass content are also not likely to be responsible for higher reflectance and pyroxene band strength, as they found that higher glass contents shift the mafic absorptions to longer wavelengths, which we do not observe. Furthermore, they observed a reddening for glass-rich samples that we likewise do not observe for PIDs or their surroundings. The spectral differences of PIDs versus their SIDs follow similar systematics as do HED samples (differentiated pyroxene-rich meteorites from the howardite, eucrite, and diogenite suite) mixed with CM2 material (undifferentiated carbonaceous chondrite). Cloutis et al. (2013) showed that less CM2 material mixed with HED material results in higher reflectance and pyroxene band strength with respect to mixtures with higher abundances of CM2 material. They showed that this behavior is inconsistent with variations in shock state, number of opaque phases, and plagioclase content.
The spectral characteristics of PIDs, however, also appear distinct from a mere removal of darkening agents (see Michalik et al. 2021). They speculated that the degassing process itself is somehow responsible for the distinct spectral characteristics due to prolonged heating of the impact deposit. However, the exact mechanism remained unexplained. Here we show that the distinct spectral characteristics persist for the second pyroxene absorption, suggesting changes to the cation occupation of the M2 crystallographic site in the pyroxenes.
Changes to the oxidation state (intervalence charge transfer) of iron only affect absorptions in the UV to near-VIS wavelength range (e.g., Burns 1993; Klima et al. 2007); thus, this effect can be excluded as a possible cause. Likewise, changes of electronic transitions between oxygen ligands and the central transition metal would affect UV absorptions (i.e., oxygen metal charger transfer transitions; Burns 1993).
Some authors of this study are currently undertaking laboratory experiments in order to evaluate and assess this process (preliminary results in Michalik et al. 2022). In their laboratory experiments, meteoritic and terrestrial material was heated under vacuum for different durations and at different temperatures. The preliminary results suggest that heating mixtures of HED meteorites and the CM2 carbonaceous chondrite Murchison can result in an oxidation process, forming hematite and resulting in an increase in reflectance and pyroxene band strength for both major pyroxene absorptions. Hematite forms then as thin coatings around various grains that might also be quickly affected by mechanical erosion. Pieters et al. (2012) showed that mechanical brecciation is the dominant space-weathering process on Vesta, and during the devolatilization process at the PID sites, where grains were transported from the interior to the surface, hematite coatings might have been partly removed quickly. This is hardly provable without sample return missions, and these PIDs would certainly be fascinating landing sites for future rover and/or sample return missions.
In accordance with the observed results from the laboratory study and the results from Michalik et al. (2021) and this paper, we suggest that the most likely explanation regarding the increase of both reflectance and pyroxene band strength is a change in cation occupation of the M2 crystallographic site. Recently, Cutler et al. (2020) executed oxidation experiments with pyroxenes to simulate weathering conditions and their products on Venus. After days and weeks of heating, their heated pyroxenes show elevated reflectance and pyroxene band strengths. They speculated that this could have two different reasons. (1) Due to reheating, a previous, relative disorder of Fe2+ cations within pyroxene crystals could have migrated more Fe2+ into the M2 site, effectively increasing the iron content in those sites and thus strengthening the absorption band. (2) During the process of oxidation, Fe2+ cations could migrate to the grain edges (in order to form hematite), which would imitate a higher iron content of the grain when light enters the medium. McCanta & Dyar (2020) also exposed pyroxenes to oxidation but did not observe an increase in reflectance or pyroxene band strength. However, they did not heat the pyroxenes simultaneously; thus, heating appears to play a key role in this process. We note that increasing Fe2+ on the grains can result in lower reflectance; the additional formation of hematite counteracts this process, which results in higher reflectance and pyroxene band strength altogether.
Although only a few studies exist on the heating of HED meteorites (e.g., Hinrichs & Lucey 2002; Miyamoto & Mikouchi 2002), it appears not to result in the increase of reflectance and pyroxene band strength. Therefore, we favor the second hypothesis, where the oxidation process itself is responsible for the pyroxene M2 site's occupational change.
The experiments of Cutler et al. (2020) could indicate that the pyroxenes in the impact deposits of Vesta were oxidized. This is reasonable to assume, as there is abundant CM2 material in the regolith (up to 50 vol% locally, Reddy et al. 2012a; up to 30 vol% in the Marcia region, Michalik et al. 2021), and OH depletion was already reported for PIDs. The OH-bearing phyllosilicates in carbonaceous chondrites could release OH and serve as an oxidizing species. Cutler et al. (2020) also observed the formation of hematite, which has not been observed (yet) on Vesta. However, this can have several reasons. (1) Hematite might not be the iron oxide species to form preferably on Vesta due to different physical and chemical preconditions. (2) Volatiles that were lost on Mars at similar PIDs were shown to be depleted after weeks or months. As the Martian subsurface holds significantly more volatiles than the Vestan regolith, this value would decrease. If the volatiles on Vesta became exhausted after hours to days, hematite might not have had the time to fully form/crystallize and be detected. (3) Larger hematite phases might have been removed during the process of particle release from the interior deposit to the surface, leaving small phases that could generate higher reflectance but not display the typical hematite absorptions. Typical hematite absorptions were also not observed in Cutler et al. (2020). The band centers of the second pyroxene absorption between the PIDs and their surroundings do not show significant variations. Two of the 10 observed PID locations show band centers at longer wavelengths (the other eight basically none). A shift of the band centers to longer wavelengths could indicate an increase in Fe2+ in the M2 site (e.g., Burns 1993; Klima et al. 2007) through the mechanisms described above. For an oxidation process without heating, McCanta & Dyar (2020) observed a shift of the pyroxene absorptions to shorter wavelengths with ongoing oxidation. Thus, these processes might counterbalance each other, which could lead to the observed insignificant variations of the band centers. In some impact deposits, another of these two processes might be favored, depending on the extent of oxidation, temperature, abundance of chondritic material, and deposit thickness/volume. As such properties of ejecta can be quite heterogeneously distributed, it might also explain why PID 9 does not exhibit higher reflectance than its surrounding. Furthermore, PID 9 is located next to the topographic highs, enabling the possibility of contamination with other material due to mass wasting.
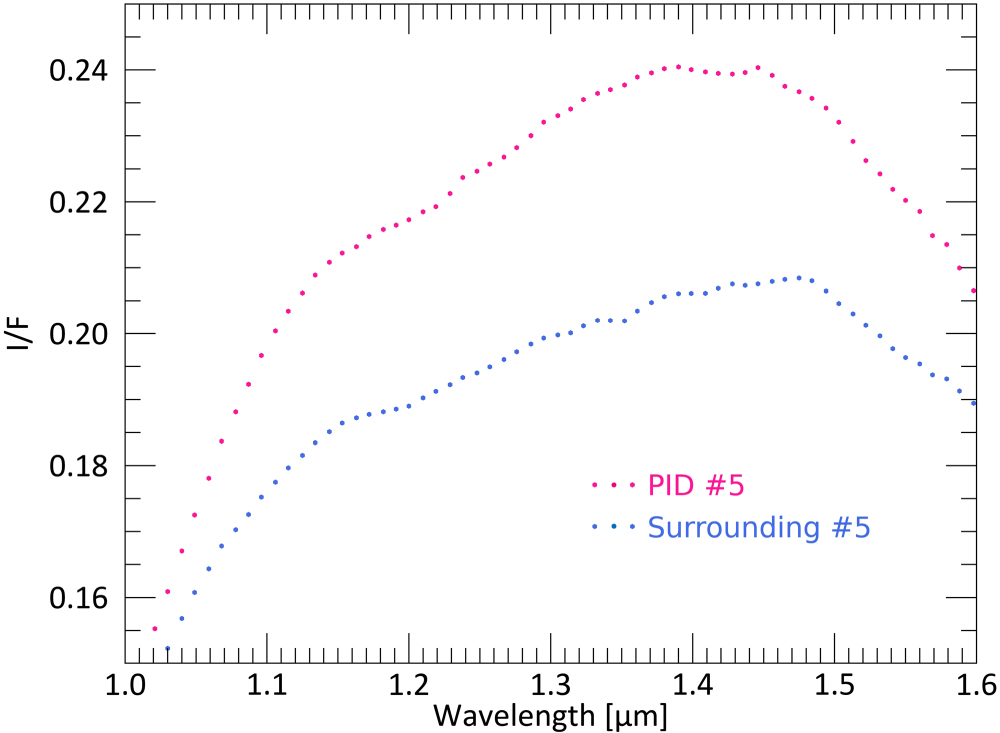
The peak reflectance positions of the left shoulder of pyroxene absorption, however, show a consistent pattern throughout all PIDs, except for one. The peak reflectance positions of PIDs tend to occur at shorter wavelengths than those of their SIDs. If iron migrates into the M2 crystallographic site, there might be less Fe2+ within the M1 site, weakening the M1 absorption near 1.2 μm (e.g., Burns 1993; Klima et al. 2007). The spectral shoulder near 1.446 μm of the PIDs might then have a more rounded shape (upward) than the spectra of their surroundings. This might result in a shift of the peak wavelength position to shorter wavelengths, which is why we report on these values. An example of this is shown in Figure 20 for PID 5. Although the data set is very limited and the error bars are quite high (see Figure 15), this might actually point to a depletion of Fe2+ in the M1 crystallographic site, supporting the theory of migrating Fe2+.

Figure 20. Wavelength vs. I/F of PID 5 (pink) and its surroundings (blue), focusing on the wavelength region of the left pyroxene absorption shoulder. Whole spectra can be seen in Figure 4.
Download figure:
Standard image High-resolution image
Besancon et al. (1991) reported on the spectra of heated pyroxenes and the partitioning of iron into M1 and M2 sites. They observed an increase of Fe2+ cations into the M1 site while heating, both weakening the major crystal field absorptions near 0.9 and 1.9 μm and strengthening the M1-associated absorption near 1.2 μm. Their spectra show a shift of the reflectance peak near 1.4 μm toward longer wavelengths, although the band centers do not significantly shift. This, in turn, indicates that a loss of Fe2+ from the M1 site could move the peak reflectance position to shorter wavelengths and contribute to strengthening the major crystal field bands. Their setup included heating of orthopyroxenes in a CO2/H2 atmosphere with oxygen fugacities close to the iron-wüstite buffer. Other specimens were heated in the presence of metallic iron. Thus, while their setup does show a contradicting behavior of Fe2+ cations upon heating, it is also far from our setup and the conditions on Vesta. Nevertheless, their study importantly points out that removing Fe2+ cations from the M1 site is in accordance with our observations of the peak reflectance positions and band strengths of the PIDs and the hypothesis of migrating iron cations and oxidation.
If our speculations are correct, the PIDs represent a window into the interior of (melt-bearing) impact deposits and thus reveal that the interior of such deposits can have experienced postimpact alteration processes that the immediate surface has not. Possibly, the volatiles needed for this alteration are lost too quickly near the surface, in contrast to a longer residence of volatile species in the interior deposit. Hence, the interior and surface material of (melt-bearing) impact deposits might differ significantly in their mineralogical and spectral properties, apart from space-weathering processes.
5. Summary and Conclusions
In this work, we expand and deepen previous observations of pitted impact deposits (PIDs) on Vesta and thus build upon the works of Denevi et al. (2012) and Michalik et al. (2021). While those observations were largely based on Dawn Framing Camera (FC) data, we use spectrally high-resolution VIR-IR data in this study and characterize the second pyroxene absorption near 1.9 μm, where we find similar patterns regarding the pyroxene absorptions as Michalik et al. (2021) did for the pyroxene absorption near 0.9 μm.
The PIDs in Marcia's ejecta blanket exhibit higher reflectance and pyroxene band strength than their immediate SID. Likewise, the so-called "halo" around Marcia's crater-fill PID, which also features small pits, exhibits similarly elevated reflectance and pyroxene band strength values. This is consistent with FC observations of the same areas. The crater-fill PIDs in the Marcia, Cornelia, and Licinia craters exhibit lower reflectance and pyroxene band strength with respect to their immediate surroundings, again consistent with FC data.
The fact that these spectral characteristics also affect the second pyroxene absorption indicates changes to the occupation of the M2 crystallographic site of the pyroxenes. Michalik et al. (2021) already excluded variations in grain size, roughness, shock state, or glass content. Moreover, they showed that the mere removal of dark compounds cannot be fully responsible for the observed spectral characteristics, although this process might also have occurred and contributed to the now-seen spectral characteristics.
We suggest that the pyroxene-rich material might have experienced a relative increase of Fe cations in the M2 site or a migration of Fe cations toward the grain surfaces due to oxidation enabled by the impact heat and liberated volatiles within chondritic regolith material. This would strengthen pyroxene absorptions, and, in addition, reflectance would likewise increase due to the possible formation of hematite and/or the removal of dark compounds. This hypothesis is based on observations by Cutler et al. (2020), McCanta & Dyar (2020), and Besancon et al. (1991) and preliminary results from Michalik et al. (2022).
The spectral properties of PIDs likely represent the possibility for us to look into the interior of impact deposits and thus show that mineralogical and spectral properties might differ significantly from what can be inferred from the surface.
This work is part of the research project "The Physics of Volatile-Related Morphologies on Asteroids and Comets." We would like to gratefully acknowledge the financial support and endorsement from the DLR Management Board Junior Research Group Leader Program and the Executive Board Member for Space Research and Technology. We thank two anonymous reviewers for their constructive feedback, which helped to improve this manuscript and emphasize the main focus of this work. T.M. furthermore thanks the VIR team for providing the VIR cubes used in this study.
Appendix: Supplementary Information
This Appendix provides the pixel numbers of the selected PIDs and SIDs, the cube number they were obtained from, as well as the minimum and maximum standard deviations derived from their collective spectra (Table A1).
Table A1. Standard Deviations (Minima and Maxima over All of the Spectrum's Wavelength Range), Location of Interest, Size (Pixels), and Cube Number for All PIDs, Their Surroundings, and the Marcia Crater-fill Locations of Interest
| Cube | Location | n (Pixel Number) | Std. Dev. Min. (μm) | Std. Dev. Max. (μm) |
|---|---|---|---|---|
| 394858895 | PID 1 | 12 | 0.0003 | 0.0048 |
| 394858895 | PID 2 | 9 | 0.0017 | 0.0054 |
| 394858895 | PID 3 | 14 | 0.0017 | 0.0048 |
| 394858895 | PID 4 | 9 | 0.0001 | 0.0035 |
| 394858895 | SID 1 | 12 | 0.0006 | 0.0036 |
| 394858895 | SID 2 | 14 | 0.0009 | 0.0038 |
| 394858895 | SID 3 | 24 | 0.0005 | 0.0034 |
| 394858895 | SID 4 | 20 | 0.0002 | 0.0051 |
| 395166968 | PID 5 | 14 | 0.0003 | 0.0040 |
| 395166968 | PID 6 | 9 | 0.0003 | 0.0050 |
| 395166968 | SID 5 | 20 | 0.0019 | 0.0056 |
| 395166968 | SID 6 | 18 | 0.0008 | 0.0033 |
| 394992761 | PID 7 | 13 | 0.0004 | 0.0040 |
| 394992761 | PID 8 | 7 | 0.0007 | 0.0031 |
| 394992761 | PID 9 | 14 | 0.0007 | 0.0031 |
| 394992761 | SID 7 | 14 | 0.0006 | 0.0024 |
| 394992761 | SID 8 | 12 | 0.0006 | 0.0033 |
| 394992761 | SID 9 | 14 | 0.0007 | 0.0025 |
| 395301549 | Halo | 46 | 0.0013 | 0.0055 |
| 395301549 | Crater-fill PID | 10 | 0.0005 | 0.0056 |
| 395301549 | Marcia crater wall | 21 | 0.0002 | 0.0033 |