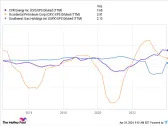
Day Return
YTD Return
1-Year Return
3-Year Return
5-Year Return
Note: Sector performance is calculated based on the previous closing price of all sector constituents
Industries in This Sector
Select an Industry for a Visual Breakdown
| Industry | Market Weight | Day Return | YTD Return |
|---|---|---|---|
| All Industries | 100% | 0.10% | 7.04% |
| Utilities - Regulated Electric | 68.58% | 0.10% | 2.64% |
| Utilities - Renewable | 11.46% | -0.41% | 58.94% |
| Utilities - Diversified | 7.10% | 0.58% | -10.09% |
| Utilities - Regulated Gas | 5.84% | 0.28% | 8.56% |
| Utilities - Independent Power Producers | 3.51% | 0.24% | 51.06% |
| Utilities - Regulated Water | 3.51% | 0.33% | -7.50% |
Note: Percentage % data on heatmap indicates Day Return
All Industries
-
Largest Companies in This Sector
|
Name
|
Last Price
|
1Y Target Est.
|
Market Weight
|
Market Cap
|
Day Change %
|
YTD Return
|
Avg. Analyst Rating
|
|---|---|---|---|---|---|---|---|
| 65.99 | 72.75 | 11.43% |
|
|
|
Buy
|
|
| 73.21 | 75.12 | 6.75% |
|
|
|
Buy
|
|
| 97.71 | 103.90 | 6.35% |
|
|
|
Buy
|
|
| 188.37 | 183.09 | 5.00% |
|
|
|
Buy
|
|
| 71.32 | 82.90 | 3.80% |
|
|
|
Buy
|
|
| 85.26 | 86.11 | 3.78% |
|
|
|
Hold
|
|
| 17.03 | 19.91 | 3.75% |
|
|
|
Buy
|
|
| 50.45 | 49.51 | 3.56% |
|
|
|
Hold
|
|
| 153.07 | 161.29 | 3.51% |
|
|
- |
Buy
|
|
| 37.32 | 38.77 | 3.14% |
|
|
|
Hold
|
Investing in the Utilities Sector
Start Investing in the Utilities Sector Through These ETFs and Mutual Funds
ETF Opportunities
|
Name
|
Last Price
|
Net Assets
|
Expense Ratio
|
YTD Return
|
|---|---|---|---|---|
| 66.19 | 12.357B | 0.09% |
|
|
| 143.53 | 6.614B | 0.10% |
|
|
| 42.69 | 1.148B | 0.08% |
|
|
| 85.03 | 884.063M | 0.40% |
|
|
| 56.67 | 247.846M | 0.40% |
|
Mutual Fund Opportunities
|
Name
|
Last Price
|
Net Assets
|
Expense Ratio
|
YTD Return
|
|---|---|---|---|---|
| 72.02 | 6.614B | 0.10% |
|
|
| 20.06 | 5.666B | 0.56% |
|
|
| 20.09 | 5.666B | 0.56% |
|
|
| 20.20 | 5.666B | 0.56% |
|
|
| 19.98 | 5.666B | 0.49% |
|
Utilities Research
Discover the Latest Analyst and Technical Research for This Sector
-
Analyst Report: CMS Energy Corporation
CMS Energy is an energy holding company with three principal businesses. Its regulated utility, Consumers Energy, provides regulated natural gas service to 1.8 million customers and electric service to 1.9 million customers in Michigan. CMS Enterprises is engaged in wholesale power generation, including contracted renewable energy. CMS sold EnerBank in October 2021.
RatingPrice Target -
Analyst Report: PG&E Corporation
PG&E is a holding company whose main subsidiary is Pacific Gas and Electric, a regulated utility operating in Central and Northern California that serves 5.3 million electricity customers and 4.6 million gas customers in 47 of the state's 58 counties. PG&E operated under bankruptcy court supervision between January 2019 and June 2020. In 2004, PG&E sold its unregulated assets as part of an earlier postbankruptcy reorganization.
RatingPrice Target -
Analyst Report: CMS Energy Corporation
CMS Energy is an energy holding company with three principal businesses. Its regulated utility, Consumers Energy, provides regulated natural gas service to 1.8 million customers and electric service to 1.9 million customers in Michigan. CMS Enterprises is engaged in wholesale power generation, including contracted renewable energy. CMS sold EnerBank in October 2021.
RatingPrice Target -
Analyst Report: Xcel Energy Inc.
Xcel Energy manages utilities serving 3.8 million electric customers and 2.1 million natural gas customers in eight states. Its utilities are Northern States Power, which serves customers in Minnesota, North Dakota, South Dakota, Wisconsin, and Michigan; Public Service Company of Colorado; and Southwestern Public Service Company, which serves customers in Texas and New Mexico. It is one of the largest renewable energy owners and suppliers in the US with more than half of its electricity sales coming from carbon-free energy.
RatingPrice Target