

Abstract
Model-based estimations of historical fluxes and pools of the terrestrial biosphere differ substantially. These differences arise not only from differences between models but also from differences in the environmental and climatic data used as input to the models. Here we investigate the role of uncertainties in historical climate data by performing simulations of terrestrial gross primary productivity (GPP) using a process-based dynamic vegetation model (LPJ-GUESS) forced by six different climate datasets. We find that the climate induced uncertainty, defined as the range among historical simulations in GPP when forcing the model with the different climate datasets, can be as high as 11 Pg C yr−1 globally (9% of mean GPP). We also assessed a hypothetical maximum climate data induced uncertainty by combining climate variables from different datasets, which resulted in significantly larger uncertainties of 41 Pg C yr−1 globally or 32% of mean GPP. The uncertainty is partitioned into components associated to the three main climatic drivers, temperature, precipitation, and shortwave radiation. Additionally, we illustrate how the uncertainty due to a given climate driver depends both on the magnitude of the forcing data uncertainty (climate data range) and the apparent sensitivity of the modeled GPP to the driver (apparent model sensitivity). We find that LPJ-GUESS overestimates GPP compared to empirically based GPP data product in all land cover classes except for tropical forests. Tropical forests emerge as a disproportionate source of uncertainty in GPP estimation both in the simulations and empirical data products. The tropical forest uncertainty is most strongly associated with shortwave radiation and precipitation forcing, of which climate data range contributes higher to overall uncertainty than apparent model sensitivity to forcing. Globally, precipitation dominates the climate induced uncertainty over nearly half of the vegetated land area, which is mainly due to climate data range and less so due to the apparent model sensitivity. Overall, climate data ranges are found to contribute more to the climate induced uncertainty than apparent model sensitivity to forcing. Our study highlights the need to better constrain tropical climate, and demonstrates that uncertainty caused by climatic forcing data must be considered when comparing and evaluating carbon cycle model results and empirical datasets.
Export citation and abstract BibTeX RIS

Original content from this work may be used under the terms of the Creative Commons Attribution 3.0 licence.
Any further distribution of this work must maintain attribution to the author(s) and the title of the work, journal citation and DOI.
1. Introduction
The climate affects a multitude of vegetation processes, resulting in complex and variable interactions (Luo 2007, Luo et al 2008, Zhou et al 2008). Dynamic Global Vegetation Models (DGVMs) attempt to describe such complexity using globally-applicable representation of vegetation structure and composition, ecosystem biogeochemistry and the responses of underlying physiological and ecological processes to variations in climate, atmospheric CO2 and other drivers (Prentice et al 2007, Scheiter et al 2013). DGVMs integrate available knowledge of ecological processes by combining theoretical process understanding with data from laboratory studies, field measurements and satellite-based estimations, and apply this knowledge to simulate ecosystem functions, such as carbon uptake and cycling, normally across a grid spanning the global land area. DGVMs complement observation-based methods such as remote sensing and field measurements by explicitly accounting for the process interactions and feedbacks linking climate and other forcings to ecosystem dynamics. They are widely used in global change impact and process studies, for characterisation of the terrestrial carbon cycle and its responses to greenhouse gas emissions and climate change, and as a component in Earth system models, accounting for biogeochemical and biophysical biosphere-atmosphere feedbacks (Scholze et al 2006, Hickler et al 2008, Sitch et al 2008, Sitch et al 2015). Gross Primary Production (GPP), the total amount of carbon assimilated by plants via photosynthesis, is a fundamental driver of vegetation processes, playing an important role in the global carbon cycle (Cox and Jones 1993, Battin et al 2009). It is a fundamental process simulated by all DGVMs. Many models adopt one of the available variants of the Farquhar et al (1980) biochemical photosynthesis model. In DGVMs, GPP represents the origin of carbon within the simulated ecosystem, controlling many other downstream processes. If GPP is simulated incorrectly, errors propagate to other processes and affect all carbon pools and fluxes of the simulated ecosystem (Luo et al 2003).
Although GPP is a fundamental flux of the carbon cycle, observation-based estimates of global GPP differ significantly between products based on remote sensing (Earth-Observation, EO-based), flux towers or a combination thereof. GPP estimates also differ between DGVMs and between DGVMs and observation-based datasets (Jung et al 2007, Jung et al 2011, Piao et al 2013, Anav et al 2015, Sitch et al 2015). Some of the discrepancies between GPP estimates of different DGVMs originate from model structural uncertainty arising from different representations of the same ecological processes, the scaling of these processes, their interactions and linkages to drivers and descriptors of ecosystem state, as well as the inclusion of certain processes, e.g. wildfires or nutrient interactions, in some models but not others (Cramer et al 2001, Gurney et al 2004, Tebaldi and Knutti 2007, Sitch et al 2008, De Kauwe et al 2014, Zaehle et al 2014). Additional uncertainty stems from parameter uncertainty due to different model calibration strategies (Knorr and Heimann 2001, Zaehle et al 2005, Wramneby et al 2008). In both DGVMs as well as models based on empirical data further uncertainty propagates from the environmental driver data, particularly data on climate variables such as temperature, precipitation, solar insolation, wind speed and atmospheric humidity, used to force or extrapolate the models (McGuire et al 2001, Zhao et al 2006, Jung et al 2007, Poulter et al 2011, Ahlström et al 2012b, Ahlström et al 2013). The climate inputs used in DGVMs are derived from either quasi-point-based measurements or model-based reanalyses. These variables need to be interpolated across areas of unmeasured territory to supply a model with values at each grid cell for the simulation, which inevitably introduces uncertainty propagating through the ecosystem model (Zhao et al 2006). A thorough and strict quantification of climate induced uncertainties is required to provide a robust interpretation and quantification of output from DGVM simulations. At present, little is known about how much each climate variable contributes to total climate induced uncertainty in GPP, and no studies have to our knowledge partitioned the uncertainty into components associated with climate data range (the magnitude of the forcing data uncertainty) and apparent sensitivity of the model to each individual driver of GPP.
Here we employ an individual-based DGVM (LPJ-GUESS) previously applied in a wide range of carbon cycle and climate impact studies to assess and quantify the potential uncertainty of estimated terrestrial GPP caused by climate driver uncertainty. We apply six historical climate datasets as input to simulations of the global terrestrial carbon cycle, and partition the revealed uncertainty into components propagating from different climatic drivers, in terms of forcing data range and the apparent sensitivity of the simulated ecosystem response to forcing, globally and among major bioclimatic regions.
2. Methodology
2.1. DGVM
We employ the Lund-Potsdam-Jena General Ecosystem Simulator (LPJ-GUESS; Smith et al 2001, Smith et al 2014) to estimate GPP. LPJ-GUESS is a DGVM which uniquely combines an individual-based representation of woody plant growth, demography and interspecific competition with process-based physiology and biogeochemistry. It employs gridded time series of climate data (air temperature, precipitation and incoming shortwave radiation) as forcing and simulates the effects of climate on vegetation structure and composition in terms of plant functional types (PFTs), soil hydrology and biogeochemistry. Atmospheric carbon dioxide (CO2) concentrations, nitrogen (N) deposition rates and soil physical properties (fixed) provide additional inputs. The 11 PFTs adopted for the present study and their prescribed parameters are given in tables S1 and S2 available at stacks.iop.org/ERL/12/064013/mmedia. We employ LPJ-GUESS version 3.0 which incorporates ecosystem nitrogen cycling, and the CENTURY soil biogeochemistry scheme (Parton et al 1993). A full description of the LPJ-GUESS is given in Smith et al (2014) and references therein.
2.1.1. Simulations
LPJ-GUESS is forced with six alternative climate datasets (each including temperature, precipitation and shortwave radiation (table 1)) in separate simulations. To ensure comparability, all climate datasets are regridded to a 0.5 × 0.5 degrees spatial resolution, aggregated to a monthly temporal resolution. These monthly datasets are interpolated to daily values uniformly within LPJ-GUESS according to Gerten et al (2004). The CRU dataset is derived from climate station records and constructed using the Climate Anomaly Method, CAM (Peterson et al 1998). CRU and CRUNCEP differ mainly in shortwave radiation where CRUNCEP calculate radiation transfer differently (Wei et al 2013) from the method applied within LPJ-GUESS to data on cloud cover. NCEP and ECMWF are reanalysis data, which are generated by combining observations with a meteorological forecast model. The other two datasets (WFDEI and PRINCETON) are hybrid datasets combining observations and reanalysis data.
Table 1. Description and source of climate datasets used in the analysis.
| Dataset | Spatial resolution | Time period | References |
|---|---|---|---|
| CRU TS 3.21 | 0.5 degree | 1901–2012 | Jones and Harris (2013) |
| CRUNCEP v5 | 0.5 degree | 1901–2013 | Wei et al (2013) |
| ECMWF/ERA Interim | 0.5 degree | 1979–2014 | Dee et al (2011) |
| NCEP-DOE II | 2.5 degree | 1979–2014 | Kanamitsu et al (2002) |
| PRINCETON_V2 | 0.5 degree | 1901–2012 | Sheffield et al (2006) |
| WFDEI_GPCC | 0.5 degree | 1979–2010 | Weedon et al (2011) |
Simulations are initialized with a 500 year spin-up where the model is forced by re-cycled de-trended 1979–2010 climate data, to achieve vegetation and soil carbon pools in equilibrium with the forcing climate. 500 years is sufficient to establish vegetation and litter inputs to the soil which in conjunction with respiration rates are used to solve the slower soil carbon pools steady state conditions. Atmospheric CO2 concentration is derived from Keeling and Whorf (2005) and N deposition data is taken from Lamarque et al (2011). Land use is taken into account with cropland and pastures being treated as natural grasslands, which is a standard simplified representation of managed land-use without additional processes such as harvest or grazing (Pugh et al 2015). The fractional cover of land use is obtained from Hurtt et al (2011).
2.2. Empirical datasets
We compare simulated GPP to the flux tower-based global estimation of GPP from Jung et al (2011) and Jung et al (2017) (herein after, FLUXCOM) and the EO-based MODIS (Moderate-resolution Imaging Spectroradiometer) GPP product (MOD17 v55) from (NTSG 2015), at global scale during 2000–2009. These 10 years mark the temporal common time period of the datasets used in table 1. The FLUXCOM here includes four GPP products derived from different machine learning methods: model trees ensemble (MTE, Jung et al 2009), Artificial Neural Networks (ANN, Papale and Valentini 2003), Multivariate Adaptive Regression Splines (MARS, Friedman 1991) and Random Forests (RF, Breiman 2001).
2.3. Land cover classes
The land cover classification (figure 1) is used to aggregate the global land area into six land cover categories: tropical forest, extra-tropical forest (boreal and temperate), semi-arid ecosystems, tundra and arctic shrub land, grasslands and land under agriculture (crops, here combined), and areas classified as barren (sparsely vegetated). This classification is based on the MODIS land cover classification, MCD12C1 type3 (Friedl et al 2002) and the Köppen-Geiger climate classification system (Kottek et al 2006) following Ahlström et al (2015).

Figure 1 Land cover for aggregating model output for analysis. The percentage values show the fraction of each land cover class of terrestrial area (excluding Greenland).
Download figure:
Standard image High-resolution image2.4. Partitioning of climate induced uncertainty
We partition climate induced uncertainty in simulated GPP into temperature, precipitation and shortwave radiation. Six climate datasets are available in this study, which limits our ability to partition uncertainties to specific climatic drivers. Therefore, we combine climate variables of the different datasets in such a way that a given simulation can be forced by the temperature from one dataset, the precipitation from another and the radiation from a third dataset. This approach also allows us to investigate the potential maximum GPP uncertainty stemming from climate variables from different climate datasets. The maximum potential climate induced uncertainty is found by first calculating the apparent model sensitivities to each of the three climate drivers using multiple linear regressions on an ensemble of simulations where climate variables are combined from a subset (n = 3) of the six climate datasets. The maximum potential GPP uncertainty is then found by multiplying the apparent model sensitivities to the climate drivers with the range (maximum minus minimum) of each of the climate drivers at each location (grid cells).
We select three out of six datasets (CRU, NCEP and ECMWF) since their corresponding global GPP represent the minimum, median, and maximum (997, 1064, and 1089 g C m−2 yr−1, respectively) within the 6 datasets. We run the simulations with the full combination of these 3 dataset (27 simulations), plus 3 original simulations for the other climate datasets. With these 30 simulation results, we use a multiple linear regression approach to identify the relative importance of each climate variable to total climate induced uncertainty in GPP. The regression is performed separately for each grid cell, cross climate datasets or combinations of climate variable among datasets but not along the time series:

where GPP, R, P and T represent z-scores (number of standard deviations from the mean) of the annual mean values of GPP, shortwave radiation, precipitation and temperature, respectively, used to force the simulation under consideration. The regression parameters α, β and γ represent the apparent model sensitivities to each of the drivers while ε is the residual error term. We refer to these sensitivities as apparent model sensitivities because they may be influenced by co-variation between climate variables (e.g. Piao et al (2013)). To investigate the potential influence of co-variation between the predictors we performed principal components regression (PCR) for analysis of the relationship between GPP and climate. Both analyses yield very similar sensitivities (see supplement 2 and figures S1–4) which add confidence that the sensitivities presented here are good approximations of the model's sensitivities and not heavily influenced by predictor co-variation.
The true sensitivities should ideally also include interaction terms between the variables, and other drivers not explicit in (1), for instance atmospheric CO2 concentration, may also contribute to the variability of GPP. However, for clarity we choose to illustrate an isolated effect of a driver on the climate induced uncertainty. This is motivated by the fact that interactions only explain a small part (∼5%) of the response variability in GPP according to ANOVA analysis (figure S5).
Once the regression coefficients (α, β, γ) are determined, the partial GPP uncertainty caused by the corresponding variables (shortwave radiation, precipitation, temperature) is estimated by:


where GPPR_unc is the partial GPP uncertainty caused by shortwave radiation (2), and α presents an apparent GPP uncertainty sensitivity to shortwave radiation range, R_range, which is the difference between the minimum and maximum shortwave radiation value across forcing datasets. Equations (3) and (4) are analogous cases for precipitation and temperature, and the total GPP uncertainty (GPPunc) is the sum of the three partial GPP uncertainties.
2.5. Partitioning of uncertainty into model sensitivity and climate uncertainty
We also assess how the uncertainty in GPP arises from a combination of climate data uncertainty and apparent model sensitivity by decomposing the partial GPP uncertainty into components associated with the climate data range and simulated apparent sensitivity of ecosystem GPP to the respective driver. Figure 2 shows an example of two possible outcomes with the same partial GPP uncertainty caused by shortwave radiation but with different contributions from climate data range and apparent model sensitivity. For Case 1, apparent model sensitivity contributes more than the climate data range, while the climate data range has higher influence in Case 2. The regression slopes provide their relative contributions to the partial GPP uncertainty (being larger or smaller than 1). Therefore, the fractions of apparent model sensitivity (fsen) and climate data range (frange) that contribute to a climate driver (e.g. shortwave radiation) induced GPP uncertainty can be estimated by:
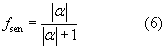

where α is the regression coefficient of multiple regression for shortwave radiation, ∣α∣ stand for the absolute value of α.

Figure 2 Graphical explanation of how climate data range and apparent model sensitivity contribute to the partial GPP uncertainty. Here shortwave radiation is used as an example. The Y axis represents the partial GPP uncertainty, i.e. the uncertainty caused by shortwave radiation, see equation (2), and the X axis represents the data range of shortwave radiation. The slope of the lines (α1 and α2) represent the change in partial GPP uncertainty for change in shortwave radiation. Both cases have the same GPP uncertainty, caused either by high apparent model sensitivity and small climate data range (AB, red line (case 1)) or by low apparent model sensitivity and large climate data range (AC, blue line (case 2)).
Download figure:
Standard image High-resolution image3. Results
3.1. Simulated GPP using six climate datasets
Global GPP simulated by LPJ-GUESS when forced by the six climate datasets without any mixing of climate variables between the datasets shows agreement with FLUXCOM and MODIS GPP (figure 3(a)). However, when stratified by land cover classes, the simulated GPP of the tropical forest (figure 3(e)), shows markedly lower values than both FLUXCOM and MODIS GPP, while for grasslands, croplands (figure 3(d)) and extra-tropical forest (figure 3(f)), simulated GPP is higher than both FLUXCOM and MODIS. These biome-specific discrepancies tend to cancel out to produce a simulated global GPP estimate closer to the remote sensing and flux tower-based estimates (Piao et al 2013). Aggregated to the global land surface area, the range among simulations amounts to 11 Pg C yr−1 or 9% of mean GPP.

Figure 3 Annual mean GPP during 2000–2009 estimated by LPJ-GUESS forced by the six climate datasets (without combining climate variables), MODIS and FLUXCOM as global totals and stratified by land cover classes (figure 1). FLUXCOM GPP presents the average of the four products (MET, ANN, MARS and RF), and the error bars show the range among these four products (figure S6 shows GPP of individual products). LPJ-GUESS GPP (mean value among simulations, 1048 g C m−2 yr−1) is very close to MODIS and FLUXCOM data, while they diverge at regional scale.
Download figure:
Standard image High-resolution image3.2. Climate induced uncertainty—combining climate variables among climate datasets
Here we show inferred apparent model sensitivities (section 3.2.1) and the maximum potential climate induced GPP uncertainty (section 3.2.2) as inferred by applying the regression-based partitioning on an ensemble of (n = 30) simulations. The simulations differ only in forcing climate, where climate variables from n = 3 climate datasets have been mixed to new and unique combinations. This method allowed us to better investigate the apparent model sensitivity and to investigate the maximum potential climate induced GPP uncertainty. Section 3.2.3 describes the results of partitioning of GPP uncertainty into apparent model sensitivity and climate data range.
3.2.1. Local apparent model sensitivities.
Applying the partitioning method (equations (1–5)) to individual terrestrial locations (grid cells), allows us to generate a global map of the relative importance of the three climate factors in inducing uncertainty in GPP (figure 4). The result shows that precipitation dominates climate induced uncertainty in arid regions and primarily at lower latitudes and cover approximately half (∼48%) of the terrestrial vegetated land surface. The areas dominated by temperature and shortwave radiation are roughly equal in areal extent and make up the remainder of the terrestrial vegetated surface, with shortwave radiation dominating in moderate to densely wooded ecosystems whereas temperature tends to dominate in high latitude and/or high altitude areas. A similar pattern is found when only using n = 6 simulations and not combining climate variables from the different climate datasets, but due to its lower number of data points the regression-based partitioning is statistically less significant (figure S7).

Figure 4 Relative importance of climate factors (red: temperature; blue: precipitation; green: shortwave radiation) to ensemble uncertainty in GPP. Non-vegetative regions and areas with no significant relationship between GPP change and climate change are masked as grey. Precipitation dominates the climate uncertainty over the largest area among the three drivers.
Download figure:
Standard image High-resolution image
Figure 5 Ensemble GPP uncertainty (black bar) between model simulations calculated from combinations of climate variables among six climate datasets. This result is derived from averaging local GPP uncertainty globally and for each land cover class. Red, blue and green bars show contributions of temperature, precipitation, and shortwave radiation, respectively, to the total climate induced uncertainty in GPP. Error bars show 95% confidence interval. Shortwave radiation and precipitation over tropical forests stand out as large contributors to global GPP uncertainties stemming from differences between climate datasets.
Download figure:
Standard image High-resolution image3.2.2. Potential maximum climate induced GPP uncertainty
The potential maximum climate induced uncertainty revealed by the analysis of simulations forced by temperature, precipitation and shortwave radiation data combined from different datasets is shown in figure 5. This result is generated by area weighted average of local GPP uncertainty globally and for each land cover class, and represents the local relative importance of climate drivers (figure 4) averaged over land cover classes. Large differences are apparent among land cover classes in terms of the relative contributions of different drivers to the total uncertainty. Aggregated to the global scale, the potential maximum uncertainty is 41 Pg C yr−1 (32% of mean GPP), or nearly four times the uncertainty of 11 Pg C yr−1 emerging from simulations based on a single driving dataset (i.e. when not combining climate variables, section 3.1). Error bars show the confidence interval of 95%. Negative values from error bars indicate that we cannot infer that the variable contributes to GPP uncertainties at all at 95% confidence level. The relatively low confidence as indicated by the error bars can partly be explained by small sample size (fewer simulations), inevitable co-variation between climate variables and the stochastic behaviour of LPJ-GUESS. The PCR analysis gives the same result with narrow confidence bands (figure S2). The influence of the stochastic behaviour can also be reduced when using more replicate patches (n = 20 here), which reduces the influence of stochastic disturbances (like windstorms or wildfires) on the average of GPP within a grid cell. Another effect of spatial averaging before applying the climate uncertainty partitioning is a decrease of the total uncertainty (16% of mean GPP), which is a result of spatial cancelation of local variation in GPP and climate variables (figures S8 and S9). The climate induced uncertainty is highest for tropical forest and is mainly due to shortwave radiation and precipitation uncertainty followed by air temperature.
3.2.3. Partitioning of GPP uncertainty into apparent model sensitivity and climate data range
The climate induced uncertainty is further partitioned into apparent model sensitivity and climate data range to give an estimate of their relative importance, i.e. do large GPP uncertainties stem from a large sensitivity in the model response to small difference in the drivers, or do the GPP uncertainty arise from low sensitivity in the model response but large difference between the drivers. Climate data range contributes more to the climate induced uncertainty than apparent model sensitivity to forcing (figure 6). Forested ecosystems show high apparent model sensitivity to shortwave radiation, whereas arid, high latitude and high altitude regions show high apparent model sensitivities to temperature and precipitation. In general, precipitation induced uncertainty has a relatively strong association to apparent model sensitivity in both magnitude and spatial extent, comparing to temperature and shortwave radiation induced uncertainty. Figure 7 shows aggregation of the fractional contributions of apparent model sensitivity and climate data range for each climate variable globally and for each land cover class, via averaging the local fractional contributions (figure 6). Apparent model sensitivity for shortwave radiation causes a slightly higher uncertainty in forested areas compared to other land cover classes. Although precipitation induced uncertainty strongly associated to the precipitation range, the importance of apparent model sensitivity is revealed in dry and tropical ecosystem. The uncertainty induced from temperature is mainly caused by the temperature range among the datasets, while apparent model sensitivity contribution increased in boreal ecosystems.

Figure 6 Global distribution of fractional contributions of apparent model sensitivity and climate data range to ensemble climate induced uncertainty for each climatic driver variable. Panels (a) and (b) show the fraction of contribution of apparent model sensitivity and climate data range to shortwave radiation induced uncertainty (these two fractions sum to 1). Similarly, panels (c) and (d) are for precipitation, and panels (e) and (f) are for temperature. Non-vegetative regions and areas without a significant relationship between GPP changes and climate changes are masked as grey. Climate data ranges are found to contribute more to the climate induced uncertainty than apparent model sensitivity to forcing.
Download figure:
Standard image High-resolution image
Figure 7 Fractional contributions of apparent model sensitivity and climate data range to ensemble climate induced uncertainty for each climatic driver variable. Climate induced uncertainty are mainly caused by climate data range, whereas apparent model sensitivity is revealed to be relatively important to precipitation induced uncertainty in dry and tropical ecosystem.
Download figure:
Standard image High-resolution image
4. Discussion
This study reveals that differences between global climate datasets induce considerable uncertainty in simulated gross primary productivity in our model. The data uncertainty stems from differences in the data sources and methodology used to construct the climate datasets, and from the sensitivity of the modeled processes to these differences globally and for different climatic regions and land cover classes.
4.1. Suitability of the model for this study
By using only a single model (LPJ-GUESS), our analysis excludes quantification of uncertainty stemming from differences in the structure and parameterization of alternative carbon cycle models. However, LPJ-GUESS is a well-established DGVM that has been evaluated and applied in a wide range of published studies, and has also been found to show relatively similar predictive skills and response to climate variations compared to other global ecosystem models (McGuire et al 2012, Murray-Tortarolo et al 2013, Piao et al 2013, Sitch et al 2015). Most models simulate similar GPP inter-annual variations at global scale, and these have been traced to large-scale variations in climate, particularly linked to global circulation phenomena such ENSO (Ahlström et al 2015). While our study does not address variation among models in sensitivity to climate forcing, we believe that our findings are likely to be representative for global ecosystem models as a class. LPJ-GUESS may thus tentatively be considered representative for how other DGVMs and carbon cycle models behave in response to uncertainties induced by climate forcing data. Although FLUXCOM and MODIS are considered as evaluation data in this study, both datasets involve considerable components of modeling (additionally to the measurement uncertainty) and are therefore also subject to some limitations and uncertainty (Zhao et al 2006, Jung et al 2011, Lin et al 2011). Further, both empirical datasets depend on climate data to extrapolate site measurements to gridded estimates of GPP. Previous studies have evaluated sources of uncertainty in the FLUXCOM (Jung et al 2009, Beer et al 2010, Jung et al 2011), and MODIS GPP products (Running et al 2004, Zhao et al 2005, Zhao and Running 2010).
4.2. Climate data and climate induced uncertainty
The six climate datasets analysed are derived from either quasi-point-based measurements or climate model-based reanalysis. Station networks, however, vary greatly in density across the globe, with sparse coverage over certain areas, such as the high latitudes (Jones and Harris 2013). Hence the data represent a limited sampling fraction and include an unknown error. Comparing the three main climatic variables of these datasets (figures S10–S12) reveals no strong overall difference in temperature over global and regional scales while a clear difference can be observed for precipitation and shortwave radiation, especially over tropical regions. Our results bring forward that these differences translate into large differences in simulated GPP in our model, and likely in other carbon cycle models.
The potential maximum climate induced uncertainty, if we combine climate variables from different datasets, is found to be 32% of mean GPP. Although the potential maximum uncertainty appears large, Barman et al (2014) found that the climate induced uncertainty could reach 20%–30% for simulations of savanna, grassland, and shrubland vegetation types. However, the way the maximum potential uncertainties are calculated here assumes that the most extreme values of each climate variable at each location are compared to create the simulated maximum and minimum GPP. This maximum uncertainty is therefore rather an illustration of the importance of climate drivers and to a lesser extent a representation of actual and realistic uncertainties; in most simulations cancellation effects will reduce the aggregated uncertainties presented here.
The tropical region shows disproportionate large climate induced uncertainty (figure 5) and empirical uncertainty based on observations (figure 3(e)). Earlier studies have likewise identified the tropics as a region of high spread in estimated GPP depending on forcing (Zhao et al 2006, Poulter et al 2011, Ahlström et al 2012b, Anav et al 2015). Data limitations are likely to be an important source of a high model spread in GPP. Meteorological station networks are generally sparse across the tropics (Medany et al 2006). Moreover, characterization of the climate, as based on measurements and modeling, is challenging for tropical regions due e.g. to the influence of extreme climate events (Trewin 2014, Wentz 2015) and the impact of heavy and extended cloudiness on remote sensing measurement (Fensholt et al 2007). Furthermore, the results show that the large uncertainty is mainly due to precipitation and radiation, which coincides with findings at site level of Barman et al (2014). Jung et al (2007) suggested that cloud and aerosol physics (which govern precipitation and radiation transfer) are most likely the principal causes of differences in precipitation and radiation estimates between datasets, since cloud and aerosol properties are implemented differently in different meteorological reanalyses. Our finding as to the global distribution of climate-induced uncertainty in GPP (figure 4) agrees with a recent empirically based study of the sensitivity of global terrestrial ecosystem to climate variables (Seddon et al 2016), who found ecologically sensitive regions with amplified responses to climate variability over the world. Moreover, the relative contributions of drivers show similarities in spatial patterns compared to the study by Nemani et al (2003) mapping the primary climate constraints to plant growth.
4.3. Apparent model sensitivity and climate data range
Overall, climate data range contributes more uncertainty to simulated global GPP than the sensitivity of the simulated ecosystem processes to climate forcing. This implies that errors in climate datasets play an important role in model-based carbon cycle estimations, and may exceed the importance of shortcomings in ecosystem model structure or parameterisation. We found that GPP uncertainties in simulations by our model are associated strongly to precipitation in large spatial extent (figure 4). In contrast to the general case described above, precipitation induced uncertainty in dry and tropical ecosystem is also relatively strong associated to apparent model sensitivity to the climate forcing (figures 6(c) and (7)). In other words, LPJ-GUESS simulated GPP has a strong sensitivity to precipitation at the global scale, though a model intercomparison study suggests DGVMs in general may be even more sensitive to precipitation than LPJ-GUESS (Piao et al 2013). Recent studies emphasize the importance of precipitation variation in controlling vegetation growth, driving inter-annual variability and dominating uncertainty in predictions of future plant production (Beer et al 2010, Ahlström et al 2012a, Ahlström et al 2015).
4.4. Limitations
Aside from limitations, discussed in section 4.1, to the generality of our findings due to the choice of a single (though arguably representative) carbon cycle model, this study is limited by the availability of independent climate datasets. The six climate datasets used here are relatively few to accurately estimate ensemble summary statistics, therefore we decide to combine climate variables of the different datasets to assess the potential maximum climate induced uncertainty. Current (Model Intercomparison Projects) MIPs do use climate forcing that are combinations of other datasets (e.g. Séférian et al (2015)), which is valuable to investigate the influence of differences between climate datasets. We apply the multiple linear regression method mainly because the different datasets vary only to a limited extent and therefore the assumption of a linear response of GPP is reasonable. If larger differences between the datasets would have been found in the screening of the data, a non-linear parameterization of the relationship between GPP and the climate variables would have been required (e.g. GPP is positively related to temperature over a certain part of the temperature gradient but too high temperature can cause drought stress). The partitioning between uncertainty stemming from apparent model sensitivity and data uncertainty should therefore be considered indicative and exact numbers are not reported here. Moreover, previous studies (Piao et al 2013, Seddon et al 2016) have addressed empirically linear relationship between vegetation productivity and climate.
We acknowledge that dependencies between the three climate variables exist, but since we are interested in the response of the model to differences in the climate data we consider these potential inter-dependences as less important for our purpose. Two-way or three-way interactions among climate variables can be substantial for both carbon and water processes. These multiple forcing interactions are not included in this study due to a small contribution to GPP variability (figure S5). It will be a future research challenge to adequately quantify interactive climatic uncertainty and corresponding apparent model sensitivity and interactive climatic data range.
5. Conclusion
We have shown that climate data uncertainties have a large influence on simulated GPP, globally and regionally, and that this uncertainty arises from a combination of differences among driver datasets and the sensitivity of simulated ecosystem processes to climate forcing. Based on our findings, we argue in favour for increased research efforts in constructing historical climate datasets in tropical areas which are found here to be of disproportionate importance for climate uncertainty with potentially large implications for assessments of global carbon cycling and sequestration. Globally and regionally, the choice of climate dataset will continue to affect both empirical data products and model results on the terrestrial carbon cycle.
Acknowledgments
This study is a contribution to the Strategic Research Areas BECC and MERGE, and to the Lund University Centre for Studies of Carbon Cycle and Climate Interactions (LUCCI). We acknowledge Martin Jung for providing FLUXNET GPP data through the site: www.bgc-jena.mpg.de/geodb/projects/Home.php. The work of Veiko Lehsten on this project has been supported by the FORMAS project CONNECT. Anders Ahlström acknowledges support from The Royal Physiographic Society in Lund (Birgit and Hellmuth Hertz' Foundation) and the Swedish Research Council (637-2014-6895).