
|
GLOBAL SOCIAL CHANGE RESEARCH PROJECT WORLD TREND REPORTS |
Click here to go back to the reports page.
First Copyright April 2012. May be used provided proper citation is given. See note at bottom.
This is the first in a set of reports about global demographic trends. In this report, we describe world population trends, where population has been increasing, where it is increasing the most, where the least, which countries are the largest, and what's happening to them. This set of reports is part of a larger project describing basic world social, political and economic trends, in ways that can be easily understood by anyone, and that can help to understand the world today.
This first set of reports describes world population trends, and demographic characteristics which may help explain population trends. The demographic characteristics include net natural change (births, deaths and migration), infant mortality rate, fertility rate and age distributions.
Summary
The major points of world population trends are shown in the summary table below.
| Asia |
Europe |
Latin America and the Caribbean |
Northern Africa |
Northern America |
Sub-Saharan Africa |
World | |
| Population | |||||||
| 1950 | 1,403,388,587 | 547,287,120 | 167,368,224 | 52,982,395 | 171,614,868 | 186,102,610 | 2,528,743,804 |
| 2010 | 4,164,252,297 | 738,198,601 | 590,082,023 | 209,459,184 | 344,528,824 | 856,327,157 | 6,902,848,086 |
| Population Growth | |||||||
| 1950 to 2010 | 197% | 35% | 253% | 295% | 101% | 360% | 173% |
| Population Growth - Annual Average | |||||||
| 1950 to 1955 | 2.1% | 1.0% | 2.9% | 2.5% | 1.8% | 2.2% | 1.9% |
| 2005 to 2010 | 1.1% | 0.2% | 1.2% | 1.8% | 0.9% | 2.6% | 1.2% |
| Population Distribution | |||||||
| 1950 |
55.5% | 21.6% | 6.6% | 2.1% | 6.8% | 7.4% | 100% |
| 2010 | 60.3% | 10.7% | 8.5% | 3.0% | 5.0% | 12.4% | 100% |
In addition, while population is still increasing in all regions, the increase has been slowing, and the slowing varied by region. For example, annual average growth rates in Asia declined from 2.1% during 1950-1955 to 1.1% during 2005-2010. On the other hand, European growth rates declined much more, from 1% during 1950-1955 to 0.2% during 2005-2010. Sub-Saharan African growth rates in 2005-2010 (2.6%) were actually higher than they were in 1950-1955 (2.2%). However, this is because average annual growth rates in Sub-Saharan Africa increased to a high of 3% in the 1980s and have since been declining, to the level lower than the 1980s level, but still higher than the 1950s level.
As a consequence of the differing growth rates, and differing slow down of growth rates, the proportion of world population that is from each region has changed over time. The largest change was that Sub-Saharan Africa increased from 7.4% of world population in 1950 to 12.4% in 2010, while Europe declined from 21.6% to 10.7%.
The rest of the demographic reports seek to explain the varying growth and slowdown patterns.
Chart 1
Chart 2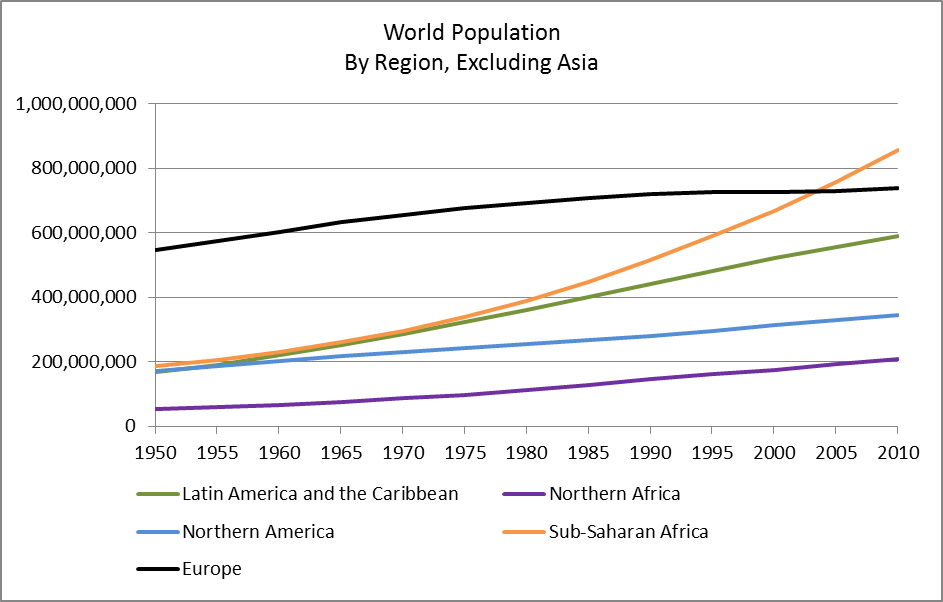
Chart 3
Chart 4
Chart 5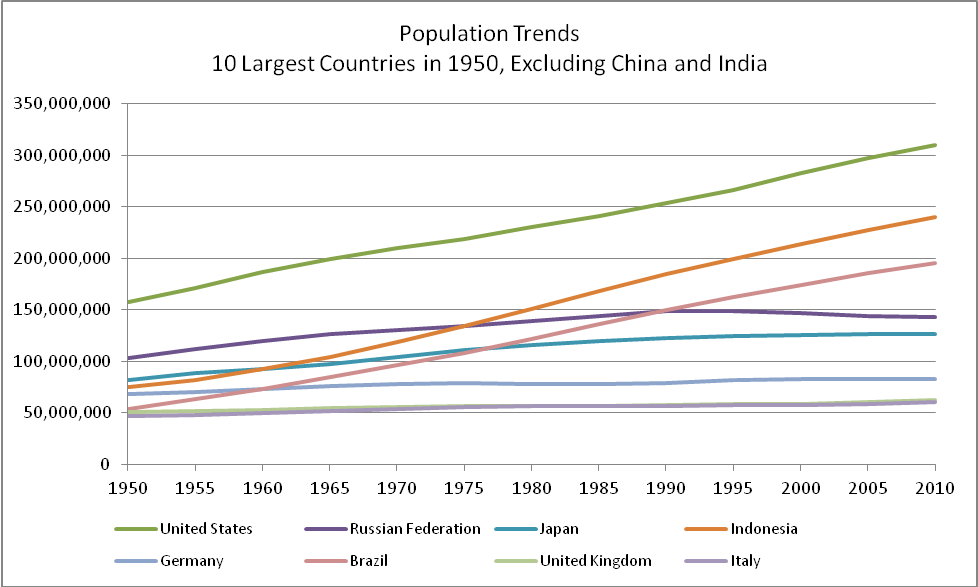
Chart 6
Chart 7
| Asia |
Europe |
Latin America and the Caribbean |
Northern Africa |
Northern America |
Sub-Saharan Africa |
World | Eastern Europe | |
| 1950 | 1,403,388,587 | 547,287,120 | 167,368,224 | 52,982,395 | 171,614,868 | 186,102,610 | 2,528,743,804 | 220,122,686 |
| 1955 | 1,549,292,725 | 575,236,145 | 191,707,177 | 59,560,875 | 186,960,025 | 206,235,129 | 2,768,992,076 | 237,039,502 |
| 1960 | 1,707,682,378 | 603,853,579 | 220,058,182 | 67,493,384 | 204,317,505 | 230,796,977 | 3,034,202,005 | 252,787,317 |
| 1965 | 1,886,185,733 | 633,590,766 | 252,604,959 | 76,342,131 | 219,223,662 | 260,594,848 | 3,328,542,099 | 266,561,335 |
| 1970 | 2,134,992,648 | 655,878,615 | 286,377,144 | 86,942,694 | 231,284,373 | 295,970,846 | 3,691,446,320 | 276,227,086 |
| 1975 | 2,393,055,653 | 676,123,164 | 323,073,647 | 98,795,948 | 242,360,377 | 338,654,176 | 4,072,062,965 | 285,623,781 |
| 1980 | 2,637,585,518 | 692,869,011 | 362,326,018 | 113,071,877 | 254,453,552 | 389,802,238 | 4,450,108,214 | 294,929,297 |
| 1985 | 2,906,850,838 | 706,799,741 | 402,393,418 | 129,955,461 | 267,079,432 | 448,863,242 | 4,861,942,132 | 303,677,257 |
| 1990 | 3,199,480,873 | 720,497,133 | 443,031,660 | 146,188,095 | 281,161,577 | 515,593,043 | 5,305,952,381 | 310,542,983 |
| 1995 | 3,470,446,102 | 727,422,115 | 482,647,055 | 161,394,729 | 295,749,132 | 589,677,124 | 5,727,336,257 | 309,882,275 |
| 2000 | 3,719,044,238 | 726,777,241 | 521,429,117 | 176,165,857 | 313,288,975 | 669,122,828 | 6,125,828,256 | 304,172,420 |
| 2005 | 3,944,992,360 | 730,735,740 | 557,037,708 | 192,016,749 | 329,231,166 | 757,513,446 | 6,511,527,169 | 297,758,038 |
| 2010 | 4,164,252,297 | 738,198,601 | 590,082,023 | 209,459,184 | 344,528,824 | 856,327,157 | 6,902,848,086 | 294,770,886 |
| Asia | Europe | Latin America and the Caribbean | Northern Africa | Northern America | Sub-Saharan Africa | World | Eastern Europe | |
| 1950 to1955 | 2.1% | 1.0% | 2.9% | 2.5% | 1.8% | 2.2% | 1.9% | 1.5% |
| 1955 to 1960 | 2.0% | 1.0% | 3.0% | 2.7% | 1.9% | 2.4% | 1.9% | 1.3% |
| 1960 to 1965 | 2.1% | 1.0% | 3.0% | 2.6% | 1.5% | 2.6% | 1.9% | 1.1% |
| 1965 to 1970 | 2.6% | 0.7% | 2.7% | 2.8% | 1.1% | 2.7% | 2.2% | 0.7% |
| 1970 to 1975 | 2.4% | 0.6% | 2.6% | 2.7% | 1.0% | 2.9% | 2.1% | 0.7% |
| 1975 to 1980 | 2.0% | 0.5% | 2.4% | 2.9% | 1.0% | 3.0% | 1.9% | 0.7% |
| 1980 to 1985 | 2.0% | 0.4% | 2.2% | 3.0% | 1.0% | 3.0% | 1.9% | 0.6% |
| 1985 to 1990 | 2.0% | 0.4% | 2.0% | 2.5% | 1.1% | 3.0% | 1.8% | 0.5% |
| 1990 to 1995 | 1.7% | 0.2% | 1.8% | 2.1% | 1.0% | 2.9% | 1.6% | 0.0% |
| 1995 to 2000 | 1.4% | 0.0% | 1.6% | 1.8% | 1.2% | 2.7% | 1.4% | -0.4% |
| 2000 to 2005 | 1.2% | 0.1% | 1.4% | 1.8% | 1.0% | 2.6% | 1.3% | -0.4% |
| 2005 to 2010 | 1.1% | 0.2% | 1.2% | 1.8% | 0.9% | 2.6% | 1.2% | -0.2% |
| Asia | Europe | Latin America and the Caribbean | Northern Africa | Northern America |
Sub-Saharan Africa | |
| 1950 | 55.5% | 21.6% | 6.6% | 2.1% | 6.8% | 7.4% |
| 1955 | 56.0% | 20.8% | 6.9% | 2.2% | 6.8% | 7.4% |
| 1960 | 56.3% | 19.9% | 7.3% | 2.2% | 6.7% | 7.6% |
| 1965 | 56.7% | 19.0% | 7.6% | 2.3% | 6.6% | 7.8% |
| 1970 | 57.8% | 17.8% | 7.8% | 2.4% | 6.3% | 8.0% |
| 1975 | 58.8% | 16.6% | 7.9% | 2.4% | 6.0% | 8.3% |
| 1980 | 59.3% | 15.6% | 8.1% | 2.5% | 5.7% | 8.8% |
| 1985 | 59.8% | 14.5% | 8.3% | 2.7% | 5.5% | 9.2% |
| 1990 | 60.3% | 13.6% | 8.3% | 2.8% | 5.3% | 9.7% |
| 1995 | 60.6% | 12.7% | 8.4% | 2.8% | 5.2% | 10.3% |
| 2000 | 60.7% | 11.9% | 8.5% | 2.9% | 5.1% | 10.9% |
| 2005 | 60.6% | 11.2% | 8.6% | 2.9% | 5.1% | 11.6% |
| 2010 | 60.3% | 10.7% | 8.5% | 3.0% | 5.0% | 12.4% |
| 1950 | 1960 | 1970 | 1980 | 1990 | 2000 | 2010 | |
| China | 550,771,433 | 658,270,094 | 814,622,841 | 983,170,638 | 1,145,195,229 | 1,269,116,737 | 1,341,335,152 |
| India | 371,856,500 | 447,844,159 | 553,873,890 | 700,058,589 | 873,785,449 | 1,053,898,107 | 1,224,614,327 |
| United States | 157,813,040 | 186,326,215 | 209,463,865 | 229,825,004 | 253,339,097 | 282,496,310 | 310,383,948 |
| Russian Federation | 102,702,461 | 119,905,701 | 130,391,798 | 138,655,363 | 148,243,501 | 146,757,517 | 142,958,164 |
| Japan | 82,199,470 | 92,500,572 | 103,710,287 | 115,914,688 | 122,251,184 | 125,720,310 | 126,535,920 |
| Indonesia | 74,837,310 | 91,946,612 | 118,361,740 | 150,820,044 | 184,345,939 | 213,395,411 | 239,870,937 |
| Germany | 68,376,002 | 72,814,899 | 78,169,287 | 78,288,577 | 79,098,094 | 82,349,027 | 82,302,465 |
| Brazil | 53,974,725 | 72,758,801 | 96,078,304 | 121,711,864 | 149,650,206 | 174,425,387 | 194,946,470 |
| United Kingdom | 50,616,012 | 52,544,356 | 55,645,390 | 56,303,011 | 57,214,474 | 58,874,117 | 62,035,570 |
| Italy | 46,366,767 | 49,519,312 | 53,324,772 | 56,221,171 | 56,832,330 | 56,986,329 | 60,550,848 |
| World | 2,532,229,237 | 3,038,412,766 | 3,696,186,306 | 4,453,007,478 | 5,306,425,154 | 6,122,770,220 | 6,895,889,018 |
| 10 as % of World | 62% | 61% | 60% | 59% | 58% | 57% | 55% |
| China and India as % of World | 36% | 36% | 37% | 38% | 38% | 38% | 37% |
| US as % of World | 6% | 6% | 6% | 5% | 5% | 5% | 5% |
| 1950 | 1960 | 1970 | 1980 | 1990 | 2000 | 2010 | |
| China | 550,771,433 | 658,270,094 | 814,622,841 | 983,170,638 | 1,145,195,229 | 1,269,116,737 | 1,341,335,152 |
| India | 371,856,500 | 447,844,159 | 553,873,890 | 700,058,589 | 873,785,449 | 1,053,898,107 | 1,224,614,327 |
| United States | 157,813,040 | 186,326,215 | 209,463,865 | 229,825,004 | 253,339,097 | 282,496,310 | 310,383,948 |
| Indonesia | 74,837,310 | 91,946,612 | 118,361,740 | 150,820,044 | 184,345,939 | 213,395,411 | 239,870,937 |
| Brazil | 53,974,725 | 72,758,801 | 96,078,304 | 121,711,864 | 149,650,206 | 174,425,387 | 194,946,470 |
| Pakistan | 37,542,380 | 45,920,204 | 59,382,651 | 80,492,664 | 111,844,679 | 144,522,192 | 173,593,383 |
| Nigeria | 37,859,746 | 45,926,253 | 57,357,275 | 75,543,388 | 97,552,057 | 123,688,536 | 158,423,182 |
| Bangladesh | 37,894,678 | 50,101,943 | 66,881,158 | 80,624,423 | 105,256,026 | 129,592,275 | 148,692,131 |
| Russian Federation | 102,702,461 | 119,905,701 | 130,391,798 | 138,655,363 | 148,243,501 | 146,757,517 | 142,958,164 |
| Japan | 82,199,470 | 92,500,572 | 103,710,287 | 115,914,688 | 122,251,184 | 125,720,310 | 126,535,920 |
| World | 2,532,229,237 | 3,038,412,766 | 3,696,186,306 | 4,453,007,478 | 5,306,425,154 | 6,122,770,220 | 6,895,889,018 |
| 10 as % of World | 60% | 60% | 60% | 60% | 60% | 60% | 59% |
Appendix 1. Comparisons with reports from other sources
A number of other reports also describe data or trends about demographics. Some of these reports include:
IMF Global Demographic Trends http://www.imf.org/external/pubs/ft/fandd/2006/09/picture.htm
The US Census Bureau shows world population and growth rates http://www.census.gov/population/international/data/idb/worldpopinfo.php
Appendix 2. Data for the Current Report
World Population Prospects: The 2010 Revision, United Nations Population Division, UN Data, http://data.un.org
All of the tables and charts in this reports were prepared by Gene Shackman.
All of the data used in this report are from the United Nations http://data.un.org/ They write, "All data and metadata provided on UNdata’s website are available free of charge and may be copied freely, duplicated and further distributed provided that UNdata is cited as the reference." http://data.un.org/Host.aspx?Content=UNdataUse Thus, all charts and tables in our report may be used freely, provided the proper citation is given (Shackman et al, 2012, from data provided by UNData). All text from this report may be used freely provided that the proper citation is given (Shackman et al. 2012).
First Copyright June 2002. Updated December 2012.
May be used provided proper citation is given.
Cite as
Shackman, Gene, Xun Wang and Ya-Lin Liu. 2012. Brief review of world demographic trends - Population. The Global Social Change Research Project. Available at
http://gsociology.icaap.org/report/demsum.html