WiFi Explorer, as well as other wireless scanning tools, provides an option to display signal strength in dBm or percentage values. The purpose of this blog is to describe this conversion process in WiFi Explorer. It should also help clarify why percentage values in WiFi Explorer might look so different when we compare them to the values we see in other tools.

Before we start discussing how the conversion works, let’s ask ourselves the following question: when we say that a network has 75% signal strength, what does that mean? Let’s assume for a moment that such value represents the percentage of transmitted power at which the signal is being received. So, if the AP is transmitting at 100 mW for example, 90% would mean the transmitted signal is being received at 90 mW, 80% at 80 mW, and so on. Unfortunately, it is not how it works.
Because of physics and Isaac Newton’s Inverse-Square Law, signals attenuate very rapidly within just a few meters away from the transmitter and they will always measure below 1 mW at the receiver, making it impractical to use percentage values this way. In fact, this is the reason we use dBm instead. dBm is a unit of comparison and we use it to compare a signal to 1 milliwatt of power. It makes it possible to express both very large and very small values in a short form:
| Power (dBm) | Power (mW) |
|---|---|
| -40 | 0.0001 |
| -30 | 0.0010 |
| -20 | 0.0100 |
| -10 | 0.1000 |
| 0 | 1.0000 |
| 10 | 10.0000 |
| 20 | 100.0000 |
| 30 | 1000.0000 |
| 40 | 10000.0000 |
You can convert milliwatts values to dBm using the formula:
PdBm = 10 x log10(PmW)
In an inverse manner, to convert dDm to milliwatts values you would use:
PmW = 10(PdBm/10)
In the context of 802.11 networks, a signal received at -40 dBm (0.0001 mW) would be considered a very strong signal, while a signal received at -80 dBm (0.00000001 mW) would be considered very weak. By now you can conclude that the closer the dBm value is to 0, the stronger the signal is. Also, in practice, typical dBm measurements range approximately from -20 to -95 dBm. To see signal strengths as high as -20 dBm you must be located right next to the AP, but on the other hand, how weak of a signal can be “heard” by the receiver will depend on the receiver’s sensitivity and noise floor (the background noise).
At this point, it seems natural to perform a simple one-to-one conversion to express dBm values as percentage, for example: 0 dBm = 100%, -1 dBm = 99%, -2 dBm = 98%, …, -98 dBm = 2%, -99 dBm = 1%, no signal = 0%. We can even adjust the model to consider only the range of dBm values that we expect to see in practice. For example, if we assume a maximum signal strength of -20 dBm and a minimum signal strength of -85 dBm, then the percentage value can be calculated using linear interpolation as follows:
percent = 100 x (1 – (PdBm_max – PdBm) / (PdBm_max – PdBm_min))
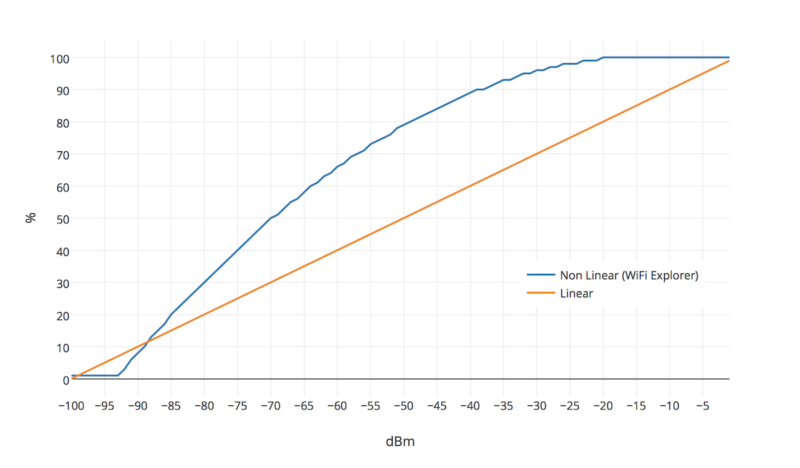
The problem with this approach is that is that RF signals propagate non-linearly! Consider for example a received signal value of -40 dBm. If we use a linear model, then that would be equivalent to 60% signal strength, which would be considered not a very strong signal, but in reality it is. At -40 dBm, not only the signal is strong, your network can achieve very high transmit rates (assuming an ideal environment). Therefore, using a linear model is not appropriate.
If a linear model is not a good choice, how is the conversion done in WiFi Explorer? A few years ago, while researching about dBm to percent conversion and how to implement it in WiFi Explorer, I came across this document titled Signal Quality as a Percent for IPW2200. In this document, the author describes various conversion models: the linear model we just discussed, lookup tables based on a perception about the performance of the network at various signal levels (excellent, very fast, slow, not associated, etc.), and quadratic models. Lookup tables as described are very subjective (what’s perceived as “fast” for you might not be the same for others), but quadratic models seem to provide a mathematical and consistent mapping between dBm, percentage values, and the user’s expectations for quality of the network at various signal levels.
WiFi Explorer uses a quadratic model derived from the IPW2200 driver implementation. The model’s parameters have been adjusted based on my own observations, and although we can still argue that the accuracy of the model might not be the best, I believe it is more consistent than the lookup table and better than a linear conversion, especially if you again ask yourself the question what does 75% signal strength mean, not only from a user’s perspective but also how it relates to the original dBm measurement.
Below you can see a comparison of the linear model and the quadratic model used in WiFi Explorer:
And just as a reference, I’m including here the list of dBm – percentage value mappings that are generated from this model.
| dBm | Percentage | dBm | Percentage | dBm | Percentage | dBm | Percentage |
|---|---|---|---|---|---|---|---|
| -1 | 100 | -26 | 98 | -51 | 78 | -76 | 38 |
| -2 | 100 | -27 | 97 | -52 | 76 | -77 | 36 |
| -3 | 100 | -28 | 97 | -53 | 75 | -78 | 34 |
| -4 | 100 | -29 | 96 | -54 | 74 | -79 | 32 |
| -5 | 100 | -30 | 96 | -55 | 73 | -80 | 30 |
| -6 | 100 | -31 | 95 | -56 | 71 | -81 | 28 |
| -7 | 100 | -32 | 95 | -57 | 70 | -82 | 26 |
| -8 | 100 | -33 | 94 | -58 | 69 | -83 | 24 |
| -9 | 100 | -34 | 93 | -59 | 67 | -84 | 22 |
| -10 | 100 | -35 | 93 | -60 | 66 | -85 | 20 |
| -11 | 100 | -36 | 92 | -61 | 64 | -86 | 17 |
| -12 | 100 | -37 | 91 | -62 | 63 | -87 | 15 |
| -13 | 100 | -38 | 90 | -63 | 61 | -88 | 13 |
| -14 | 100 | -39 | 90 | -64 | 60 | -89 | 10 |
| -15 | 100 | -40 | 89 | -65 | 58 | -90 | 8 |
| -16 | 100 | -41 | 88 | -66 | 56 | -91 | 6 |
| -17 | 100 | -42 | 87 | -67 | 55 | -92 | 3 |
| -18 | 100 | -43 | 86 | -68 | 53 | -93 | 1 |
| -19 | 100 | -44 | 85 | -69 | 51 | -94 | 1 |
| -20 | 100 | -45 | 84 | -70 | 50 | -95 | 1 |
| -21 | 99 | -46 | 83 | -71 | 48 | -96 | 1 |
| -22 | 99 | -47 | 82 | -72 | 46 | -97 | 1 |
| -23 | 99 | -48 | 81 | -73 | 44 | -98 | 1 |
| -24 | 98 | -49 | 80 | -74 | 42 | -99 | 1 |
| -25 | 98 | -50 | 79 | -75 | 40 | -100 | 1 |
Interesting article. Could you please share the mathematical equation for that quadratic conversion? It’s a bit hard to reverse-engineer that from the provided samples.
https://github.com/torvalds/linux/blob/9ff9b0d392ea08090cd1780fb196f36dbb586529/drivers/net/wireless/intel/ipw2x00/ipw2200.c#L4321
some quick PHP based on the ipw2200 code and a table generating function:
function signal_quality_perc_quad($rssi, $perfect_rssi=-20, $worst_rssi=-85) {
$nominal_rssi=($perfect_rssi – $worst_rssi);
$signal_quality =
(100 *
($perfect_rssi – $worst_rssi) *
($perfect_rssi – $worst_rssi) –
($perfect_rssi – $rssi) *
(15 * ($perfect_rssi – $worst_rssi) + 62 * ($perfect_rssi – $rssi))) / (($perfect_rssi – $worst_rssi) * ($perfect_rssi – $worst_rssi));
if ($signal_quality > 100) {
$signal_quality = 100;
} else if ($signal_quality < 1) {
$signal_quality = 0;
}
return ceil($signal_quality);
}
function qualtable($min_rssi=-100, $max_rssi=-1, $perfect_rssi=-20, $worst_rssi=-80) {
for ($rssi=$min_rssi; $rssi <= $max_rssi; $rssi++) {
echo "$rssi ".signal_quality_perc_quad($rssi, $perfect_rssi, $worst_rssi)."\n";
}
}
qualtable(-100, -1, -18, -85);
-100 0
-99 0
-98 0
-97 0
-96 0
-95 0
-94 4
-93 6
-92 8
-91 11
-90 13
-89 15
-88 17
-87 19
-86 21
-85 23
-84 26
-83 28
-82 30
-81 32
-80 34
-79 35
-78 37
-77 39
-76 41
-75 43
-74 45
-73 46
-72 48
-71 50
-70 52
-69 53
-68 55
-67 56
-66 58
-65 59
-64 61
-63 62
-62 64
-61 65
-60 67
-59 68
-58 69
-57 71
-56 72
-55 73
-54 75
-53 76
-52 77
-51 78
-50 79
-49 80
-48 81
-47 82
-46 83
-45 84
-44 85
-43 86
-42 87
-41 88
-40 89
-39 90
-38 90
-37 91
-36 92
-35 93
-34 93
-33 94
-32 95
-31 95
-30 96
-29 96
-28 97
-27 97
-26 98
-25 98
-24 99
-23 99
-22 99
-21 100
-20 100
-19 100
-18 100
-17 100
-16 100
-15 100
-14 100
-13 100
-12 100
-11 100
-10 100
-9 100
-8 100
-7 100
-6 100
-5 100
-4 100
-3 100
-2 100
-1 100
the "perfect_rssi" and "worst_rssi" variables modify the scale, so to generate a similar table to the one shown here rather than the driver's defaults (https://github.com/torvalds/linux/blob/9ff9b0d392ea08090cd1780fb196f36dbb586529/drivers/net/wireless/intel/ipw2x00/ipw2100.c#L6038) you would use "perfect_rssi=-18" and "worst_rssi="-85" or something