


Abstract
Understanding the spread and evolution of pathogens is important for effective public health measures and surveillance. Nextstrain consists of a database of viral genomes, a bioinformatics pipeline for phylodynamics analysis, and an interactive visualization platform. Together these present a real-time view into the evolution and spread of a range of viral pathogens of high public health importance. The visualization integrates sequence data with other data types such as geographic information, serology, or host species. Nextstrain compiles our current understanding into a single accessible location, open to health professionals, epidemiologists, virologists and the public alike.
All code (predominantly JavaScript and Python) is freely available from github.com/nextstrain and the web-application is available at nextstrain.org.
1 Introduction
Viral pathogens pose an ever-present danger to global human health, highlighted by recent events such as the West African Ebola epidemic and the ongoing Zika epidemic in the Americas. The rapid evolution of these viruses allows inference of epidemic history from genomic data. Such analyses are often done in isolation, and may lack the spatial or temporal context in which to best interpret the results (Pybus et al., 2013). Furthermore, the results of analyses are rarely made available to the public or health bodies until after publication, which may be too late to aid understanding or effect change in policy. We have developed Nextstrain to visualize outbreaks in as close to real time as possible. Whilst currently encompassing a selection of viruses, extension to non-viral pathogens is forthcoming.
The regularly updated nature and rapidity of these analyses is crucial to the monitoring and understanding of pathogen epidemiology and evolution. Sequencing times and costs are continually dropping, with on-the-ground sequencing used during recent epidemics (Faria et al., 2017; Quick et al., 2016). Rapid methods by which to analyze, interpret, and disseminate results must complement this speed of sequencing.
Nextstrain consists of data curation, analysis and visualization components: Python scripts maintain a database of available sequences and related metadata, sourced from public repositories such as NCBI (www.ncbi.nlm.nih.gov), GISAID (www.gisaid.org) and ViPR (www.viprbrc.org), as well as GitHub repositories and other sources of genomic data. A suite of tools perform phylodynamic analysis (Volz et al., 2013), including subsampling, alignment, phylogenetic inference, temporal dating of ancestral nodes and discrete trait geographic reconstruction, including inference of the most likely transmission events. This leverages the maximum likelihood analyses implemented in TreeTime (Sagulenko et al., 2018), allowing a full analysis of the entire Ebola epidemic (n = 1581 genomes) in under 2 h on a modern laptop. These scripts separate generic core functionality from a light pathogen-specific layer such that they are easily adapted to different pathogens. Visualization is available through nextstrain.org. This approach is similar in concept to Nextflu (Neher and Bedford, 2015) however extended and generalized to different viral pathogens. There is a growing need for surveillance of non-influenza viruses (Tang et al., 2017), and Nextstrain is able to be extended to most outbreaks with readily accessible genomic data, although we note the potential for recombination or low mutation rate to confound phylogenetic signal.
2 Joint temporal and spatial visualization
Conveying understanding of pathogen evolution through space and time involves filtering large amounts of data into forms that can be easily reasoned with. Multiple views into different facets of the data are presented and remain in sync as one interacts with the data. This allows simultaneous interrogation of phylogenetic and spatial relationships, with additional data such as genotype or serotype expressed through colourings (Fig. 1). This is coupled with an interactive time slider to see how the pathogen has evolved and spread over the course of the epidemic. By animating the temporal dimension, a high level overview of how the entire outbreak unfolded is quickly gained. This approach both communicates the geographical spread of the epidemic alongside the underlying genomic data that supports this geographic reconstruction.
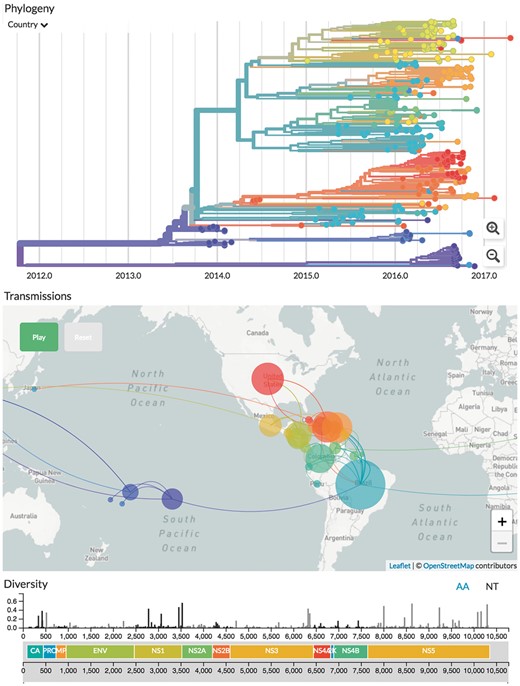
Genomic epidemiology of Zika virus as of Oct 2017 (live display at nextstrain.org/zika). The main interface consists of three linked panels—a phylogenetic tree, geographic transmissions and the genetic diversity across the genome
Maximum likelihood ancestral state reconstruction of discrete traits such as country or region of isolation allows identification of probable transmission events given the sampled data, together with inferred probability distributions of ancestral state at each node. Internal node colours indicate ancestral state and shifts are drawn as links between demes on the map. Confidence is conveyed by matching colour saturation to the confidence of that trait, and by displaying all relevant information when one hovers over the corresponding branch or isolate on the tree. Sampling bias and lack of data can obscure transmission links, and in certain cases we have chosen not to display the inferred states.
3 Monitoring of evolution and adaptation
Nextstrain tracks and reconstructs mutations across the tree and displays this information as a bar chart of entropy at each position in the genome, as well as showing the mutations inferred to occur on each branch by hovering over the tree. Selecting a position in the genome with non-zero entropy reveals the distribution of the segregating variant in the phylogeny and on the map. This allows interrogation of genetic change which may be adaptive or underlying a change in disease dynamics.
For many pathogens, the emergence and spread of gain-of-function variants is a grave concern. For instance, China has experienced seasonal epidemics of influenza A/H7N9 over the past five years. Despite no known human-to human-transmission events, the high mortality rate of 30% (Li et al., 2014) makes the threat of mutations which facilitate human-to-human transmission of extreme concern. For example, mutations identified by de Vries et al. (2017) are readily visible at nextstrain.org/avian/h7n9. Continual monitoring of such putatively adaptive mutations is critical.
4 A model for public sharing of data
Nextstrain presents a single, continuously updated overview of both endemic viral disease (seasonal influenza, dengue) as well as emergent viral outbreaks (avian influenza, Zika, Ebola), all based upon the same underlying bioinformatics architecture. This architecture is well positioned to respond to future outbreaks, be they viral or bacterial.
Analysis of such outbreaks relies on public sharing of data, and Nextstrain has the ability to automatically update as new sequences from a range of public databases and repositories appear. Scientists are justifiably hesitant to cede control of their data, and we try to address these concerns by preventing access to the raw genome sequences, and by clearly indicating the source of each sequence. Derived data, such as phylogenetic trees, metadata and screenshots are available, and one can append private metadata via CSV files. We believe this strikes a compromise between keeping certain data private and allowing the dissemination of results important to the wider scientific community, thereby encouraging collaboration between scientists. Genomic epidemiology has the potential to inform the public, health organisations and scientists alike, a potential realized by sharing of data in real-time rather than retrospectively (Croucher and Didelot, 2015).
Funding
This work was supported by the Open Science Prize to TB and RAN, by the NSF through DGE-1256082 to SMB, by the ERC through StG-260686 to RAN and by NIH R35 GM119774-01 to TB. TB is a Pew Biomedical Scholar.
Conflict of Interest: none declared.
References
Author notes
The authors wish it to be known that, in their opinion, the Trevor Bedford and Richard A. Neher authors should be regarded as Joint last Authors.

