


Abstract
Among the 28 000 targeted stars in K2 Field 10 is the white dwarf WD 1202-024 (EPIC 201283111), first noted in the SDSS survey (SDSS 120515.80-024222.7). We have found that this hot white dwarf (Teff ≃ 22 640 K) is in a very close orbit (P ≃ 71 min) with a star of near brown-dwarf mass ≃0.061 M⊙. This period is very close to, or somewhat below, the minimum orbital period of cataclysmic variables with H-rich donor stars. However, we find no evidence that this binary is currently, or ever was, transferring mass from the low-mass companion to the white dwarf. We therefore tentatively conclude that this system is still in the pre-cataclysmic variable phase, having emerged from a common envelope some 50 ± 20 Myr ago. Because of the 29-min integration time of K2, we use follow-up ground-based photometry to better evaluate the eclipsing light curve. We also utilize the original SDSS spectra, in approximately 15-min segments, to estimate the radial velocity of the white dwarf in its orbit. An analysis of the light curve, with supplementary constraints, leads to the following system parameters: Mwd ≃ 0.415 ± 0.028 M⊙, Rwd ≃ 0.021 ± 0.001 R⊙, Mcom ≃ 0.061 ± 0.010 M⊙ and Rcom ≃ 0.088 ± 0.005 R⊙ where the subscripts ‘wd’ and ‘com’ refer to the white dwarf and low-mass companion, respectively. If our interpretation of this system as a pre-CV is correct, it has the shortest period of any such system yet found and should become a compact CV in less than 250 Myr.
1 INTRODUCTION
The standard scenario for the evolution of cataclysmic variable (‘CV’) binaries is discussed in numerous papers, including Rappaport, Verbunt & Joss (1983), Patterson (1984), Warner (2003), Howell, Nelson & Rappaport (2001), Knigge, Baraffe & Patterson (2011), Kalomeni et al. (2016) and references therein. The formation of a CV starts when the more massive star in the primordial binary evolves first, and, in the process, develops a high-density, hydrogen exhausted core. When the primary expands up the giant or asymptotic giant branch, depending on the initial orbital separation, it may eventually overflow its Roche lobe and commence mass transfer on to the companion star. Depending on the mass ratio of the binary and the evolutionary state of the primary, the mass transfer may be dynamically unstable, leading to a so-called common-envelope (CE) phase (see e.g. Paczyński 1976; Taam, Bodenheimer & Ostriker 1978; Webbink 1984; Taam & Bodenheimer 1992; Pfahl, Rappaport & Podsiadlowski 2003). In this scenario, the secondary spirals into the envelope of the primary. If there is sufficient potential energy between the core of the primary and the secondary star, the entire envelope of the primary can be ejected, leaving a hot proto-white dwarf (i.e. the core of the primary) in a fairly short period orbit with the original secondary.
The result of this scenario is a phase that is often referred to as a ‘post-common-envelope binary’ or a ‘pre-cataclysmic variable’ (‘pre-CV’). At the present time, there are more than 60 such objects known (see e.g. Zorotovic, Schreiber & Gänsicke 2011), many of which were initially identified via the Sloan Digital Sky Survey (SDSS) survey. The companion stars have masses that are mostly in the range of 0.1–0.7 M⊙ and orbital periods of ∼2 h to a day. The white dwarfs consist of a mix of He WDs (with masses of ∼0.3–0.5 M⊙) and CO WDs (masses ≳0.5M⊙).
If and when the companion star itself evolves to fill its Roche lobe, and/or the orbit shrinks due to angular momentum losses (e.g. gravitational radiation or magnetic braking; Rappaport et al. 1983), mass transfer on to the white dwarf can commence, thereby marking the zero-age cataclysmic variable (‘ZACV’) phase. If the mass transfer during the initial phases of the CV is stable, then there are three known possible outcomes of the evolution depending on the initial conditions: (i) evolution to wide orbits where the donor star becomes a giant; (ii) evolution to shorter periods, where a minimum period of ∼72–75 min is reached, after which the orbit expands and (iii) evolution to ultrashort periods of ∼5 min after which the orbital period increases (see e.g. Kalomeni et al. 2016 for an extensive review).
The minimum orbital period in an H-rich CV occurs when the donor star becomes degenerate at a mass of ∼0.05 M⊙, and starts to expand upon further mass-loss. Thus, at a period of ∼70 min, a donor star that may have had an initial mass as high as 2 M⊙ could have been reduced to a mass of brown-dwarf proportions with most of its initial mass having been lost from the system. Therefore, when we see a system with a period of ∼70 min with a brown-dwarf like companion, the important issue arises as to whether the low-mass companion star has been whittled down from a much larger star, or if the system has only recently emerged from a CE with the star that ejected the envelope being relatively unscathed. In the latter case, it would be interesting to understand whether the CE phase can end with the companion star nearly filling its Roche lobe without actually doing so.
In this paper, we report on a binary system, WD 1202-024, which may indeed have only recently emerged from a CE phase, and is not yet in Roche lobe contact. In Section 2, we describe the K2 discovery and observations of WD 1202-024. In Section 3, we utilize a published analysis of an SDSS spectrum of WD 1202-024 obtained in 2002 to establish both Teff and log g for the white dwarf. We also carry out a radial velocity analysis by utilizing the three individual exposures contributing to the SDSS spectrum. Our ground-based photometry from five observatories is reported in Section 4. The system parameters are inferred in Section 5 from an analysis of the light curve coupled with other constraints on the system. In Section 6, we discuss the evolutionary status of WD 1202-024, and possible evolutionary scenarios to explain its origin. We summarize and discuss our results in Section 7.
2 K2 OBSERVATIONS
In our continuing search for unusual eclipsing binaries in the K2 observations (Howell, Sobeck & Hass 2014), we downloaded all available K2 extracted light curves common to Campaign 10 from the MAST.1 We utilized the pipelined data set of Vanderburg & Johnson (2014). The flux data from all 28 345 targets were searched for periodicities via a BLS algorithm (Kovács, Zucker & Mazeh 2002) as well as via an FFT search. Folded light curves of targets with significant peaks in their periodograms were then examined by eye to identify unusual objects among those with distinct periodicities.
Shortly after the release of the Field 10 data set, EPIC 201283111 (WD 1202-024) was identified as a very short 71-min period binary with a single discernible eclipse per orbit. The folded K2 light curve for WD 1202-024 is shown in Fig. 1.
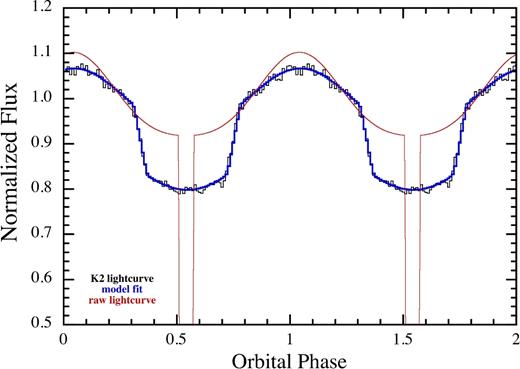
K2 light curve of WD 1202-024 folded about a period 71.2299-min (phase zero is offset for aesthetic reasons). The red curve represents a simple geometrical model with a 5-min long eclipse and two out-of-eclipse cosine functions to emulate the illumination effect on the secondary star – with a ∼18 per cent peak-to-peak amplitude. The heavy blue curve is that model convolved with the K2 integration time of 29.4 min.
Because the K2 integration time is a significant fraction (41 per cent) of the orbital period, the light curve shown in Fig. 1 is highly smoothed. In fact, the eclipse width appears to be roughly 30 min in duration, indicating that the actual eclipse is much shorter. The figure also shows a simple geometrical ‘toy’ model (red curve) with a 5-min long rectangular shaped eclipse, as well as out-of-eclipse cosine functions (at one and two times the orbital frequency; see Section 5.1) to emulate the illumination effect on the secondary star – with an ∼18 per cent peak-to-peak amplitude. The heavy blue curve is that same model convolved with the K2 integration time of 29.4 min, and it matches the observed light curve quite well.
3 SDSS DATA ARCHIVE
Fortunately, WD 1202-024 was observed by the SDSS (Eisenstein et al. 2006; Ahn et al. 2012) 15 yr ago in April of 2002. An SDSS image is presented in Fig. 2 and shows a 19th magnitude blue star identified as a hot WD via the SDSS spectrum. There are no obvious nearby companions of comparable brightness.
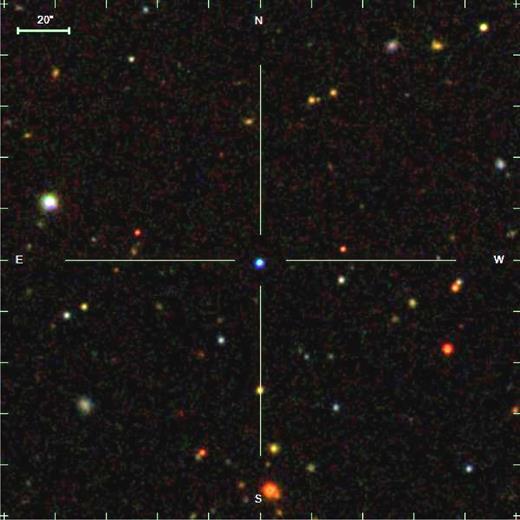
SDSS image of WD 1202-024 showing the 19th magnitude white dwarf well isolated from neighbouring stars of comparable brightness.
WD 1202-024 was first reported as a white dwarf by Eisenstein et al. (2006) with Teff ≃ 22 280 ± 530 K and log g ≃ 7.18 ± 0.09. This was followed by Kleinman et al. (2013) who reported Teff ≃ 22 640 ± 540 K and log g ≃ 7.30 ± 0.10 as part of their survey of ∼20 000 white dwarfs in SDSS DR7. We adopt this more recently analysed set of parameters for our analysis. The photometric and spectral properties of WD 1202-024 are summarized in Table 1, and we note that the light from this system is totally dominated by the white dwarf.
Photometric and spectral properties of WD 1202-024.
| Parameter | WD 1202-024 |
|---|---|
| RA (J2000) | 12:05:15.808 |
| Dec (J2000) | −02:42:22.69 |
| Kp | 18.75 |
| ua | 18.50 |
| Bb | 18.51 |
| ga | 18.49 |
| Vb | 18.67 |
| ra | 18.84 |
| ia | 19.15 |
| za | 19.39 |
| Teffc (K) | 22, 640 ± 540 |
| log gc (cgs) | 7.30 ± 0.10 |
| Distance (pc)d | 845 ± 60 |
| μα (mas yr−1)e | −18.0 ± 1.4 |
| μδ (mas yr−1)e | +8.0 ± 1.7 |
Notes. (a) Taken from the SDSS image (Ahn et al. 2012). (b) Converted from the SDSS magnitudes; see also VizieR http://vizier.u-strasbg.fr/; UCAC4 (Zacharias et al. 2013). (c) From Kleinman et al. (2013). (d) Based on photometric parallax only. (e) From Qi et al. (2015).
The SDSS spectrum of this object has a total exposure of about 50 min, and is presented in Fig. 3. Also shown on the same spectral plot are the FUV and NUV flux points from the Galex satellite2 (Martin et al. 2005). We also superpose a blackbody curve for Teff = 22 650 K to guide the eye. According to Vennes, Kawka & Németh (2011) the observed colour magnitudes of this white dwarf, FUV–NUV = −0.32 ± 0.08 and NUV–V = −0.51 ± 0.07, imply a white dwarf temperature of ∼19 600 K. When the colours are adjusted for interstellar extinction (according to the prescriptions of Cardelli, Clayton & Mathis 1989), assuming a minimal value for E(B-V) of ≃0.03, they yield a corrected Teff for the white dwarf of ≃22 000 K, thereby roughly confirming the value found spectroscopically by Kleinman et al. (2013).
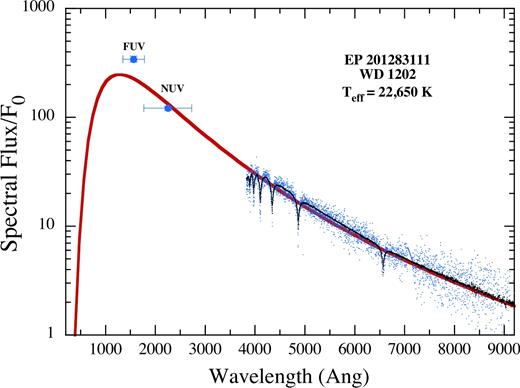
The SDSS spectrum of WD 1202-024 (blue points) showing prominent Balmer lines. The normalization constant F0 is 10−17 ergs cm−2 s−1 Å−1. The Galex FUV and NUV spectral points are also shown in blue. The black curve is a model spectrum over the visible band. The red curve is a blackbody of Teff = 22 650 K whose amplitude has been fitted to the data, and is meant only to guide the eye.
We downloaded the SDSS spectral data that consisted of three integrations of 15, 15 and 20 min durations. The times and exposures of the spectra are summarized in Table 2. We performed two analyses to measure the radial velocity of the three sub-exposures of the SDSS spectrum. We first performed a cross-correlation function (‘CCF’) analysis to measure radial velocities. After excluding outliers, we cross-correlated the three individual spectra against the model spectrum selected by the SDSS pipeline and recorded the velocity of the cross-correlation peak as the radial velocity. In addition to the CCF analysis, we measured radial velocities by modelling the stellar spectrum with a radial velocity shift (and two nuisance parameters for continuum offset and sky background contamination), and finding the most likely radial velocity shift. We used a Markov-chain Monte Carlo (‘MCMC’) algorithm (with affine invariant ensemble sampling; Goodman & Weare 2010; Hou et al. 2012) to explore parameter space and determine the best-fitting velocity shift and uncertainties. The resultant radial velocities (‘RVs’) that were determined in this manner are summarized in Table 2.
Radial velocities from SDSS spectraa.
| Time (BJDtdb) | Expos. (s) | RVb (km s−1) | ϕc cycles | cd cycles |
|---|---|---|---|---|
| 2452367.8107 | 900 | +78.4 | 0.750 | 0.928 |
| 2452367.8230 | 900 | +86.6 | 0.998 | 0.928 |
| 2452367.8369 | 1200 | −36.2 | 0.279 | 0.874 |
| Time (ϕ = 0) | K | γ | Δϕe | |
| (BJDtdb) | (km s−1) | (km s−1) | (offset) | |
| 2452367.8298 | 88 ± 19 | 26 ± 13 | 0.135 ± 0.036 |
Notes. (a) Spectral data taken from the SDSS spectral archive (Ahn et al. 2012). (b) RV values are from our cross-correlation analysis of the three spectra with a template white dwarf (see Section 3) The uncertainty in each RV point is estimated to be 20 km s−1 (see text). (c) The orbital phase computed from the ephemeris in Table 6. (d) The correction factors given by equation (2). (e) Phase difference from the back-projected phases determined in 2016–2017.
The SDSS spectra are of low signal to noise, and the white dwarf spectrum has only broad hydrogen absorption lines, so the radial velocity uncertainties are large. Using our MCMC analysis, we find ∼10 km s−1 photon limited uncertainties, but the true uncertainty on each radial velocity measurement is likely larger due to systematic uncertainties related to our ability to continuum-normalize the spectra. When we change the way we continuum normalize the spectra (by dividing out polynomials of varying orders), we find the results remain consistent at approximately the 20 km s−1 level. We adopt this value as the uncertainty on each radial velocity point in our analysis.
To the extent that we can fully accept the RVs determined from the SDSS spectra, we find K ≃ 88 ± 19 km s−1 and γ ≃ 26 ± 13 km s−1. These fitted values of K and γ are also listed in Table 2 along with the time of orbital phase zero and the corresponding offset from the phase projected back from the K2 observations.
4 GROUND-BASED PHOTOMETRY
We followed up the K2 observations of WD 1202-024 with ground-based photometric observations. The ground-based data were acquired with amateur-operated 36-cm and 80-cm telescopes in Arizona, the 1-m telescope of the South African Astronomical Observatory, and the 1.6-m telescope at Observatoire Mont Mégantic (‘OMM’) in Québec. We also obtained 15 min of photometry around the time of eclipse with the Magellan 6.5-m telescope.3
The amateur-astronomer measurements in Arizona covered 61 individual orbital cycles during the 87-d interval from 2016 December 28 to 2017 March 24. The Gary observations conducted at the Hereford Arizona Observatory (HAO) used a 36-cm telescope, and the data were reduced by author BLG. The observatory, observing procedure and reduction process are described in Rappaport et al. (2016). The Kaye/Gary observations were conducted with the Junk Bond Observatory (‘JBO’) 80-cm telescope by author TGK of the Raemor Vista Observatory. Image sets were calibrated and measured by BLG. The observatory, observing procedure and image reduction process are also described in Rappaport et al. (2016). The exposure times for the latter observations were either 30 or 40 s (with cadences of 42 and 54 s). During most nights of observation, approximately four complete orbital cycles were recorded.
In addition to these observations, we also acquired one observation covering nearly two orbital cycles on the night of 2017 February 18 using the 1-m telescope at the South African Astronomical Observatory. These data were taken with a shorter integration time of only 8 s using the Sutherland High Speed Camera (‘SHOC’; Coppejans et al., 2013) so as to better study the eclipse ingress and egress.
Following on these observations, we obtained photometric observations covering seven orbital cycles on the nights of 2017 February 28 and March 6 at OMM. These data were taken with the PESTO (Planetes Extra-Solaires en Transit et Occultations) camera on the 1.6-m telescope using 8-s cadence.
All of the above observations utilized an ‘open’ or ‘clear’ filter that yields a bandpass largely dictated by the responses of the CCDs (roughly 0.4–0.9 μm).
Most recently, we obtained 15 min of flux measurements using the LDSS3-C camera on the Magellan Clay telescope in Sloan i-band around the time of eclipse. This was done specifically to further attempt to detect the companion star during total eclipse. The observations were made on ut 2017 March 30 with exposures of 30 s and a cadence of 60 s.
In order to determine a precise orbital period, we fit each eclipse for a mid-eclipse time. These times are plotted versus the orbital cycle count in Fig. 4. In addition, we divided up the K2 photometric data into 12 discrete pieces, each of duration ∼5 d. We determined the eclipse times for each of these 12 segments of K2 data. These eclipse times are also plotted in Fig. 4. In all, the timing data span approximately 5220 orbital cycles or nearly 9 months. All of our measured eclipse times, along with the observatories where the data were taken, are listed in Table 3.
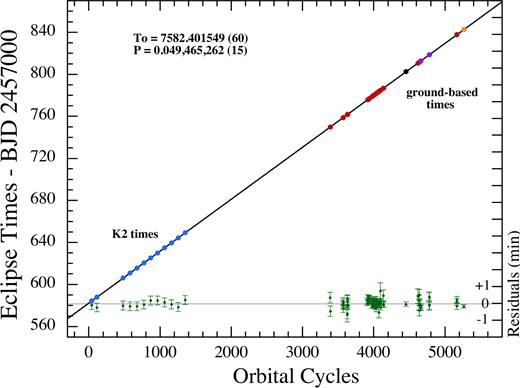
Summary of eclipse timing measurements of WD 1202-024. The eclipse times are plotted versus the orbital cycle number. The blue points to the lower left are from the K2 observations, while most of the points to the upper right (in red) were acquired with the Gary/Kaye facilities. The black point is from the 1-m telescope of the South African Astronomical Observatory, the purple points are from the OMM 1.6-m data, and the orange point is from the Magellan observation. The residuals from a best-fitting linear period are shown at the bottom with green points and error bars; the scale is on the right and is expressed in minutes.
Eclipse times for WD 1202-024.
| Eclipse no. | BJDTDB-2457000 | Telescopea | Eclipse no. | BJDTDB-2457000 | Telescopea | |
|---|---|---|---|---|---|---|
| 40 | 584.3801 | K2 | 4014 | 780.9550 | 80 | |
| 114 | 588.0404 | K2 | 4015 | 781.0047 | 80 | |
| 481 | 606.1942 | K2 | 4032 | 781.8453 | 80 | |
| 578 | 610.9923 | K2 | 4033 | 781.8951 | 80 | |
| 675 | 615.7905 | K2 | 4034 | 781.9445 | 80 | |
| 772 | 620.5887 | K2 | 4035 | 781.9937 | 80 | |
| 868 | 625.3375 | K2 | 4036 | 782.0433 | 80 | |
| 965 | 630.1356 | K2 | 4052 | 782.8347 | 80 | |
| 1062 | 634.9337 | K2 | 4053 | 782.8843 | 80 | |
| 1158 | 639.6823 | K2 | 4054 | 782.9337 | 80 | |
| 1255 | 644.4803 | K2 | 4055 | 782.9832 | 80 | |
| 1352 | 649.2787 | K2 | 4056 | 783.0327 | 80 | |
| 3388 | 749.9901 | 36 | 4072 | 783.8237 | 80 | |
| 3389 | 750.0390 | 36 | 4073 | 783.8736 | 80 | |
| 3567 | 758.8441 | 36 | 4074 | 783.9230 | 80 | |
| 3568 | 758.8937 | 36 | 4075 | 783.9725 | 80 | |
| 3569 | 758.9428 | 36 | 4076 | 784.0220 | 80 | |
| 3570 | 758.9924 | 36 | 4093 | 784.8634 | 80 | |
| 3571 | 759.0420 | 36 | 4094 | 784.9123 | 80 | |
| 3628 | 761.8611 | 80 | 4095 | 784.9616 | 80 | |
| 3629 | 761.9111 | 80 | 4096 | 785.0114 | 80 | |
| 3630 | 761.9605 | 80 | 4134 | 786.8913 | 80 | |
| 3631 | 762.0098 | 80 | 4135 | 786.9404 | 80 | |
| 3911 | 775.8602 | 80 | 4136 | 786.9899 | 80 | |
| 3912 | 775.9098 | 80 | 4451 | 802.5714 | 100 | |
| 3913 | 775.9591 | 80 | 4637 | 811.7719 | 80 | |
| 3915 | 776.0580 | 80 | 4638 | 811.8211 | 80 | |
| 3932 | 776.8991 | 80 | 4639 | 811.8710 | 80 | |
| 3933 | 776.9484 | 80 | 4640 | 811.9207 | 80 | |
| 3934 | 776.9979 | 80 | 4641 | 811.9698 | 80 | |
| 3935 | 777.0475 | 80 | 4658 | 812.8106 | 160 | |
| 3972 | 778.8777 | 80 | 4659 | 812.8601 | 160 | |
| 3973 | 778.9269 | 80 | 4660 | 812.9095 | 160 | |
| 3974 | 778.9766 | 80 | 4777 | 818.6974 | 160 | |
| 3975 | 779.0261 | 80 | 4778 | 818.7465 | 160 | |
| 3992 | 779.8668 | 80 | 4779 | 818.7960 | 160 | |
| 3993 | 779.9164 | 80 | 4780 | 818.8458 | 160 | |
| 3994 | 779.9658 | 80 | 5164 | 837.8402 | 80 | |
| 3995 | 780.0152 | 80 | 5165 | 837.8898 | 80 | |
| 4012 | 780.8560 | 80 | 5166 | 837.9390 | 80 | |
| 4013 | 780.9057 | 80 | 5261 | 842.6382 | 650 |
Notes. (a) Telescopes: K2 ⇒ NASA K2 mission; ‘36’ ⇒ Hereford Arizona Observatory 36 cm; ‘80’ ⇒ Junk Bond Observatory 80 cm; ‘100’ ⇒ South African Astronomical Observatory (‘SAAO’) 100 cm; ‘160’ ⇒ Mont Mégantic Observatory (‘OMM’) 160 cm; ‘650’ ⇒ Magellan 650 cm. The uncertainties in the eclipse times are approximately 10 s.
The orbital period is 71.229 977(30) min, with a limit on orbital decay of |$P_{\rm orb}/|\dot{P}_{\rm orb}| \gtrsim 2 \times 10^5$| yr.
If we project the orbital phase backward in time by 14.3 yr to the epoch when the SDSS spectra were taken, we can retain a coherent cycle count, but with a 1σ uncertainty in the phase of 0.040 cycles (corresponding to 2.8 min). We note that the phase of the RV orbit misses the back projection of the photometric phasing by 9.6 min (see Table 2). When taking into account both the uncertainty in the back projection as well as in the RV orbital phase determination (0.036 orbital cycles), the discrepancy is 9.6 ± 3.8 min., a 2.5σ discrepancy. On the other hand, even the slightest component of |$\dot{P}_{\rm orb}$| given above will allow the phases to match up.
5 MODELING THE LIGHT CURVE
5.1 MCMC physical light-curve fitting
In this section, we describe the fit to the light curves with a relatively simple physical model, while simultaneously imposing a set of supplementary constraints that allows for unique system solutions, modulo the uncertainties in the measurements and constraints. We utilize an MCMC approach (see e.g. Ford 2005; Madhusudhan & Winn 2009 and references therein), and choose six parameters to fit via the MCMC procedure: the two constituent masses, Mwd and Mcom, the white dwarf radius, Rwd, the orbital inclination angle, i, the age, τ, of the binary (since its formation) and a thermal bloating factor, f, of the companion star.
Because the light curve does not contain sufficient information to allow for the determination of the six MCMC adjusted parameters Mwd, Mcom, Rwd, i, τ and f, we utilize six additional constraints or relations.
RV amplitude from SDSS spectra: The two MCMC masses and the known orbital period determine the orbital separation, and the inclination angle allows for a prediction of the K-velocity of the white dwarf. This predicted value is then ‘tested’, via χ2 against the value inferred from the SDSS spectra, equivalent to imposing a Gaussian prior.
Determination of log g from SDSS spectra. The MCMC mass and radius of the white dwarf are used to compute log g. This is compared to the value of log g inferred from the SDSS spectrum by Kleinman et al. (2013), also equivalent to imposing a Gaussian prior on this quantity.
-
Mass–radius relation for an assumed H-rich companion. Given the MCMC mass of the companion star, we compute its radius via a fitting formula that covers higher-mass brown dwarfs, ‘transition objects’, and stars near the end of the main-sequence. We derived a fitting formula for Rcom(M, τ) to represent stars of mass between 0.04 M⊙ and 0.10 M⊙ as a function of age, using our own models of low-mass stars and brown dwarfs. All of the stellar models were computed using the Lagrangian-based Henyey method. The original code has been described in several papers (see e.g. Nelson, Chau & Rosenblum 1985; Nelson, Dubeau & McCannell 2004) and has been extensively tested (Goliasch & Nelson, 2015). We also reported results for low-mass main-sequence stars using this same code in Rappaport et al. (2017). The expression we have devised iswhere f ≥ 1 is an arbitrary multiplication factor that allows for the companion star to be thermally bloated by the external heating effects from the hot white dwarf, either currently or in the recent past when the WD might have been much hotter. In this expression M is the mass of the companion star, assumed to be an H-rich brown dwarf, ‘transition object’, or lower main-sequence star over the range 0.04–0.10 M⊙, and ℓτ is the log10 of the stellar age in years since birth. Equation (5) holds for 8.5 ≲ log10(τ) ≲ 10. The coefficients for this expression may be found in Table 4.(5)\begin{eqnarray} R_{\rm com}(M,\tau ) & \simeq & f(\alpha _1 + \alpha _2 M^{-1} + \alpha _3 \, \ell \tau + \alpha _4 M^{-2} \nonumber \\ & & +\, \alpha _5 \, \ell \tau ^2 + \alpha _6 \, \ell \tau \, M^{-1} +\alpha _7 M^{-3} \nonumber \\ & & +\, \alpha _8 \, \ell \tau ^3 + \alpha _9 \,\ell \tau ^2 M^{-1} + \alpha _{10}\, \ell \tau M^{-2}) \end{eqnarray}
-
Mass–radius relation for white dwarf at a given Teff. In Section 6.2, we will present a set of our own cooling curves (see Fig. 9) for recently unveiled low-mass white dwarfs that have lost their envelopes via Roche lobe overflow. We have combined these models with those of Panei et al. (2007), in order to increase the number of mass models, and show that for white dwarfs with the approximate Teff of WD 1202-024 (22 640 K; Kleinman et al. 2013), there is a relatively simple expression connecting the mass and the radius:(with an ∼8 per cent uncertainty in the theoretical values) that we use for masses up to ≃0.50 M⊙. For higher masses, we simply set Rwd = 0.017 R⊙.(6)\begin{equation} R_{\rm wd}(M_{\rm wd}) \simeq 0.00616 \,(M_{\rm wd}/\mathrm{M}_{\odot })^{-1.44}\, \mathrm{R}_{\odot } \end{equation}
Radius of companion must be < Roche lobe radius. We impose the constraint that the chosen radius for the companion star must be less than, or equal to, its Roche lobe radius, RL.
-
Matching the out-of-eclipse fit to the amplitude expressed analytically by Kopal (1959). Here, we utilize only the fitted amplitude A in equation (4) (i.e. the illumination term at the orbital period) to match the Kopal's (1959) analytic expression for A:(see equation 6 of Carter, Rappaport & Fabrycky 2011), where a is the orbital separation, and the ‘BC’ terms are the ratio of bolometric correction factors for the bandpass that produces the light curves.(7)\begin{equation} A \simeq -\frac{17}{48} \left(\frac{R_{\rm com}}{a}\right)^2 \left[1 + \frac{3}{4} \left(\frac{R_{\rm com}}{a}\right)\right] \frac{BC_{\rm com}}{BC_{\rm wd}} \end{equation}
Coefficients for equation (5).
| Coefficient | Value |
|---|---|
| α1 | +7.909 973 19 |
| α2 | +0.020 619 60 |
| α3 | −2.355 359 16 |
| α4 | −0.000 780 21 |
| α5 | +0.237 058 29 |
| α6 | −0.002 797 61 |
| α7 | −0.000 010 03 |
| α8 | −0.007 759 62 |
| α9 | −0.000 202 13 |
| α10 | +0.000 179 43 |
| Coefficient | Value |
|---|---|
| α1 | +7.909 973 19 |
| α2 | +0.020 619 60 |
| α3 | −2.355 359 16 |
| α4 | −0.000 780 21 |
| α5 | +0.237 058 29 |
| α6 | −0.002 797 61 |
| α7 | −0.000 010 03 |
| α8 | −0.007 759 62 |
| α9 | −0.000 202 13 |
| α10 | +0.000 179 43 |
For every given set of MCMC parameters, we compute χ2 from the fit to the light curve, and then add to this χ2 sum the contributions from constraints (i), (ii), (iv) and (vi) above. A decision about whether to accept the particular set of parameters or make a new selection is made based on the standard Metropolis–Hastings jump conditions (see e.g. Ford 2005; Madhusudhan & Winn 2009 and references therein). After running the MCMC simulations, we find that constraints (ii) and (iv) are the most influential.
Illustrative model fits to the light curves from the combined 30-s and 40-s JBO data sets and to the OMM 2017 February 28 light curve are shown in Fig. 5. The grey points represent the individual flux measurements while the red points are the same data but binned and averaged in 200 points across the light curve. Note the clear illumination effect of the companion star during the out-of-eclipse portion of the light curve. There is no significant detection of flux during the total eclipse of the white dwarf, and only a marginal detection of the secondary eclipses (at the ∼1.5σ level).
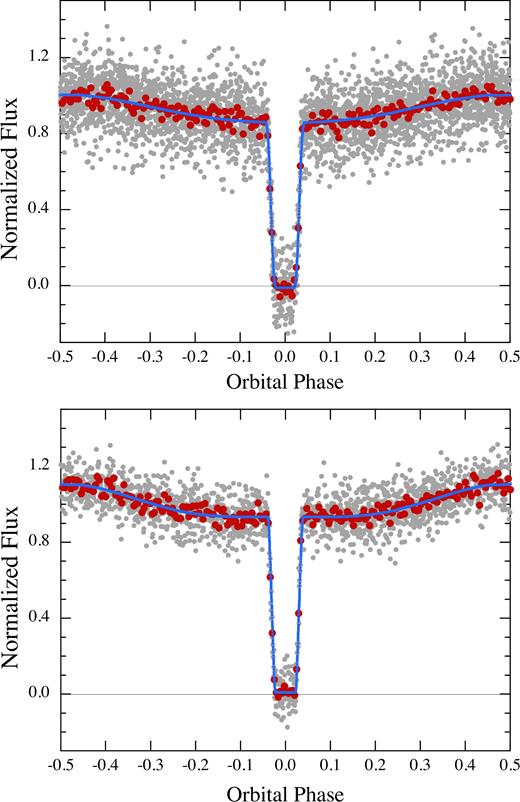
Fitted light curves for WD 1202-024. Top panel is based on the Kaye/Gary data acquired with the JBO 80-cm telescope with the 30-s and 40-s exposure data sets combined (see Table 3). The bottom panel is from the OMM observations of 2017 February 28 using 8-s cadence. The grey and red points are the unbinned and binned data points, respectively, while the solid blue curve is the model fit discussed in Section 5.1.
In the top panel of Fig. 6, we show the region of the OMM light curve (from February 28) zoomed in near the eclipse. The ingress and egress times are each about 1 min in duration, which are well resolved with the 8-s cadence. This portion of the light curve contains most of the information for determining the stellar radii and orbital inclination angle.
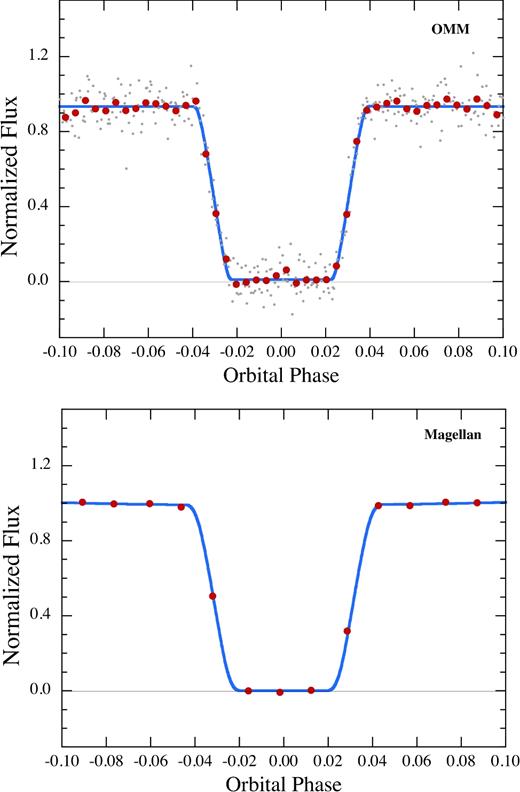
Fitted light curves zoomed in on the eclipse region. Top panel: based on the data acquired with the OMM 1.6-m telescope of 28 February with 8-s cadence. Bottom panel: from the Magellan Sloan-i band data of March 30 with 60-s cadence. The solid blue curve is a model fit, using the same ingredients as the fits in Fig. 5 (see Section 5.1). The uncertainty on the Magellan data points are about half the size of the plotted points, and they are used to set a 3σ upper limit during eclipse of 1 per cent of the out of eclipse flux.
In the bottom panel of Fig. 6, we show the same region of the light curve with the much sparser sampling but more precise photometry of the Magellan observations. These data were acquired in the Sloan-i band. The main thing we learn from these measurements is that there is no detectable flux during total eclipse of the WD down to a level of 1 per cent (3σ) of the out-of-eclipse flux. The equivalent magnitude is ≳24.
5.2 Results of the analysis
The results of running a dozen chains with a million links each are shown in Fig. 7. The parameter fits here are for the OMM February 28 data set; however, fits to all the data sets are reported below in tabular form. The top left panel of Fig. 7 shows the correlation between Mcom and Mwd. The white dwarf mass seems narrowly constrained to 0.415 ± 0.028 M⊙, which makes it most likely an He WD. The companion star has a mass of 0.061 ± 0.010 M⊙ and a radius of 0.088 ± 0.005 R⊙ (see upper right panel in Fig. 7). This places the companion star near the boundary between brown dwarfs and the very tail end of the main sequence, i.e. a ‘transition object’.
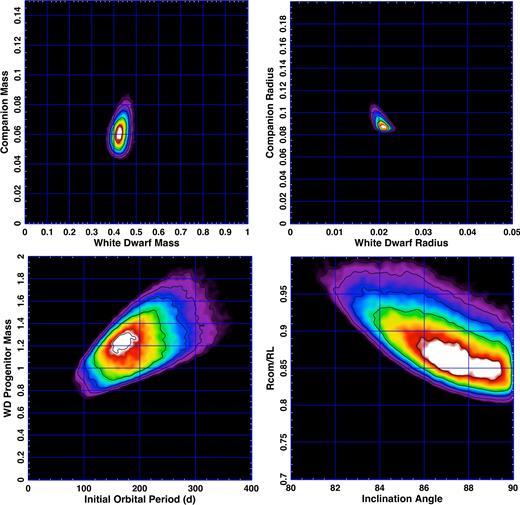
MCMC correlation plots for the WD 1202-024 system parameters based on the OMM February 28 data set. Clockwise from the upper left panel: Mwd − Mcom, Rwd − Rcom, Rcom/RL − i and Mp, init − Porb, init planes. Here, Mp is the WD progenitor mass and Porb, init is the orbital period of the primordial binary at the onset of the CE. Black contour curves are typically in steps of a factor of 2 in probability density.
From the upper right panel of Fig. 7, we see that the white dwarf has a radius that is narrowly constrained to be 0.021 ± 0.001 R⊙. Thus, it is substantially thermally bloated over its degenerate radius. We utilize this in Section 6.2, along with the WD's Teff of 22 640 K, to show that this is a relatively young WD and still quite thermally bloated.
In the bottom right panel of Fig. 7, we show the correlation between the orbital inclination angle and the Roche lobe filling factor. Inclination angles of 84°–90° are strongly preferred. Most interestingly, the companion star appears to be somewhat, but significantly, underfilling its Roche lobe (with a filling factor of between 0.82 and 0.93; <0.97 at 2σ confidence). As we discuss in Section 6 this points in the direction that this system is quite young, and that the mass transfer on to the WD has not yet commenced. The bottom left panel in Fig. 7 will be discussed in Section 6.2.
The properties of the WD 1202-024 binary are summarized in Table 5. There we give the results of MCMC fits for each of the five individual data sets, as well as an average value across all the data sets. We cite the average uncertainty in the parameter over the five data sets as a rough measure of the overall uncertainty.
MCMC derived parameters of the WD 1202-024 binary.
| OMM-1 | OMM-2 | SAAO | JBO-1 | JBO-2 | ⇐ Observatory | |
|---|---|---|---|---|---|---|
| 8-s | 8-s | 8-s | 40-s | 30-s | ⇐ Exposure | |
| 1728 | 1728 | 1050 | 2000 | 1390 | ⇐ Flux samples | |
| 0.086 | 0.122 | 0.074 | 0.105 | 0.137 | ⇐ RMS flux | |
| Parameter | Averagea ⇓ | |||||
| a (R⊙) | 0.447 ± 0.009 | 0.443 ± 0.009 | 0.449 ± 0.008 | 0.438 ± 0.009 | 0.444 ± 0.010 | 0.444 ± 0.009 |
| Mwd (M⊙) | 0.424 ± 0.030 | 0.411 ± 0.029 | 0.431 ± 0.027 | 0.393 ± 0.027 | 0.414 ± 0.028 | 0.415 ± 0.028 |
| Rwd (R⊙) | 0.021 ± 0.001 | 0.022 ± 0.001 | 0.020 ± 0.002 | 0.023 ± 0.002 | 0.021 ± 0.001 | 0.021 ± 0.001 |
| Mcom (M⊙) | 0.060 ± 0.010 | 0.062 ± 0.010 | 0.064 ± 0.008 | 0.059 ± 0.010 | 0.062 ± 0.010 | 0.061 ± 0.010 |
| Rcom (R⊙) | 0.087 ± 0.005 | 0.088 ± 0.006 | 0.088 ± 0.004 | 0.087 ± 0.005 | 0.089 ± 0.005 | 0.088 ± 0.005 |
| Thermal bloating, fb | |$1.055^{+0.060}_{-0.034}$| | |$1.056^{+0.047}_{-0.033}$| | |$1.063^{+0.071}_{-0.039}$| | |$1.068^{+0.078}_{-0.045}$| | |$1.074^{+0.063}_{-0.045}$| | |$1.063^{+0.064}_{-0.039}$| |
| Rcom/RLc | 0.82–0.93 | 0.82–0.94 | 0.82–0.89 | 0.82–0.93 | 0.83–0.94 | 0.82–0.92 |
| i (°) | 84–90 | 83–90 | 87–90 | 83–90 | 84–90 | 84–90 |
| cos ωorbt term | −0.088 ± 0.002 | −0.107 ± 0.002 | −0.083 ± 0.002 | −0.074 ± 0.002 | −0.077 ± 0.002 | −0.086 ± 0.013d |
| cos 2ωorbt term | +0.025 ± 0.002 | +0.019 ± 0.002 | +0.008 ± 0.002 | +0.007 ± 0.002 | +0.011 ± 0.002 | +0.014 ± 0.008d |
Notes. (a) Given that each data set has statistical uncertainties as well as systematic errors that may or may not be correlated with those of the other sets, for simplicity we report straight averages of the five measurements and their mean uncertainties. (b) The thermal bloating factor, f, is the value by which the companion star is found to be larger than its nominal radius given by equation (5). These factors are already incorporated in the values given in the row for Rcom. (c) Roche lobe filling factor. The average 2σ upper limit is 0.97. (d) Here, we cite the rms of the scatter in the five values as the more appropriate uncertainty.
6 THE ORIGIN OF WD 1202-024
6.1 Evolutionary scenarios
From the empirical evidence collected thus far for WD 1202-024, and its analysis, a picture emerges of a very short period binary containing a hot, thermally bloated white dwarf in orbit with a brown dwarf or transition object relatively close to the end of the main sequence. Based on our analysis, the companion star seems to be somewhat underfilling its Roche lobe. To our knowledge, there is no evidence that this system is now, or ever was, a mass-transferring CV (see e.g. Ritter & Kolb 2003). In particular, there is no evidence in the eclipse profile or the spectrum indicating the presence of an accretion disc, and no flickering in the light curve (the latter would have also indicated the presence of an accretion disc). Moreover, there is nothing in the historical record concerning a prior nova event at the source location (see e.g. Shafter 2017). In this regard, WD 1202-024 is not detected in any of the WISE images4 indicating no clear excess above the ordinary thermal continuum spectrum of the white dwarf.
In spite of the fact that this object does not appear to be a CV, its orbital period is as short as, or shorter than, the minimum orbital period for CVs containing H-rich donor stars. However, shorter period CVs (e.g. AM CVns, with Porb as short as ∼6 min; Ritter & Kolb 2003) exist, but they are thought to harbour He-rich donor stars (e.g. Kalomeni et al. 2016 and references therein). The majority of CVs are thought to have commenced their mass transfer phase with the donor star having a mass as high as perhaps 2 M⊙ (e.g. Kalomeni et al. 2016). As the orbital period slowly decreases, from perhaps 10 h, the donor star loses mass while the orbit shrinks until the minimum period occurs near 72–75 min with a donor star mass of ∼0.05 M⊙ (see e.g. Rappaport, Joss & Webbink 1982; Rappaport et al. 1983; Howell et al. 2001). The minimum period is reached when the core of the donor star is becoming degenerate, while at the same time its envelope is still somewhat thermally bloated.
To illustrate some of these standard CV evolution features, we selected 13 evolution tracks from the work of Kalomeni et al. (2016) and plot them in Fig. 8 in the Porb − Mdon plane. These systems all start with donor-star masses in the range of ∼0.75–2.7 M⊙ and end up with those masses whittled down to 0.02 M⊙. They all have the property that they pass through a point in the Porb − Mdon plane that is close to the current state of WD 1202-024. Familiar features of these tracks include the minimum orbital period near 70 min and individual systems entering and leaving the period gap within the range of 2–3 h. The ‘U’ shaped feature near the start of several of the tracks is thermal-time-scale mass transfer from the more massive donor stars to the white dwarf. Systems that are transferring mass near a period of 70 min typically do so at a rate of ∼3 × 10⁻¹¹ M⊙ yr−1.
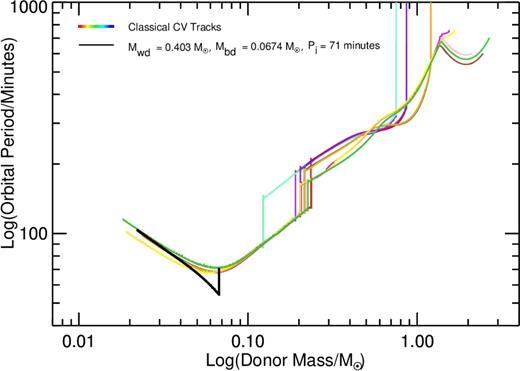
Illustrative CV evolution tracks for 13 different sets of initial system parameters are shown as different coloured curves (run with the mesa evolution code; Paxton et al. 2013, 2015; Kalomeni et al. 2016). The initial white dwarf masses, donor-star masses and orbital periods range from 0.6–1.4 M⊙, 0.75–2.7 M⊙ and 10–25 h, respectively. Familiar features include the minimum orbital period at ∼70 min, as well as several ‘jumps’ in period that represent the ‘period gap’. The heavy black curve is the calculated evolution track of the current WD 1202-024 going forward in time from the present epoch.
In this section, we will adopt the working hypothesis that the WD 1202-024 system is not the result of the standard CV evolution depicted above, but rather has evolved directly to its current state from a relatively recent CE phase. During this CE phase, the current companion star spiralled into, and ejected the envelope of the giant that was the progenitor of the current white dwarf. This phase of its evolution occurred perhaps 50 Myr ago (see Section 6.2). At the end of the CE phase, the orbital period was basically the same as its current 71 min, and the companion star was much as it is today, filling some 82 per cent to 92 per cent of its Roche lobe. Specifically, the low-mass companion star would be nearly the same as it was in its primordial state. In later subsections, we return to reconsider the possibilities that (i) the companion star has evolved through a conventional CV phase and lost much of its mass or (ii) the companion star filled its Roche lobe at the end of the CE phase and subsequently quickly lost a small fraction of its mass before settling into its current configuration.
6.2 Preferred scenario
If we now combine equations (10) and (11), and identify Pf with the current orbital period of 71.2 min, we can solve for the only unknown value, namely, Mp, i.e. the mass of the primordial primary star that led to the current system.
The results of this type of calculation, directly computed during each MCMC link, are shown in the lower left panel of Fig. 7. There we can see the correlation between the mass of the white dwarf's progenitor star and the orbital period of the binary at the time mass transfer commenced, triggering a CE phase. The most likely initial orbital periods are |$P_i \simeq 155^{+60}_{-40}$| d, and the corresponding masses of the primary star are Mp ≃ 1.18 ± 0.26 M⊙, though we note that there may be additional contributions to the error budget due to the uncertainties in the CE parameter combination λα.5 This exercise mostly serves to demonstrate that it is quite plausible for a very low-mass star to successfully eject the envelope of a much more massive star without merging with its core (see also Politano 2004).
Once the CE phase has ended, the low-mass companion star is in a very tight 71-min orbit with the newly unveiled core of the primary, namely the He white dwarf that we see at the current epoch. Evolutionary cooling tracks for white dwarfs formed by having the primary star lose its envelope in binaries via stable mass transfer, are shown in Fig. 9. We use the code devised by Nelson et al. (2004) to compute the cooling evolution of the WDs. It is assumed that the red-giant progenitors are of solar metallicity and hydrogen abundance. After the proto-WDs start contracting, the compression of the hydrogen-rich envelopes for a narrow range of WD masses (0.21–0.29 M⊙) causes thermonuclear runaways (TNRs) to occur on their surfaces. This leads to a rapid expansion of the outer layers; more than one cycle can occur before the TNRs are quenched (see Fig. 9). Various cooling times are marked along the tracks in Fig. 9 (the isochrones are denoted by dashed lines and are labelled in terms of the log of the cooling age in years).
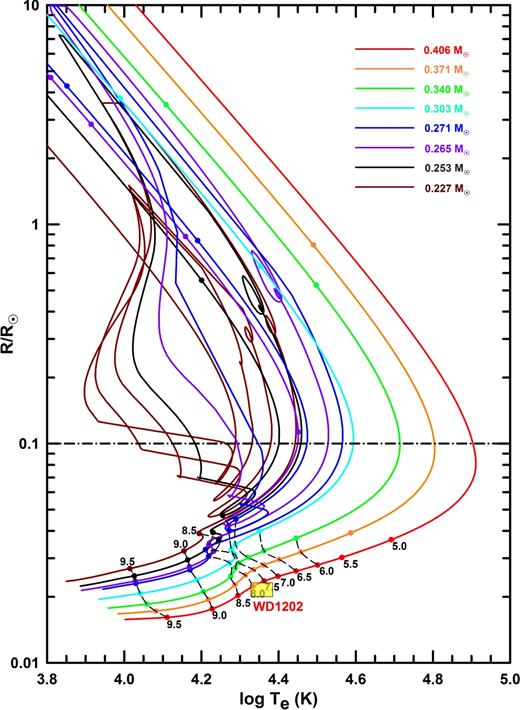
Cooling curves for He white dwarfs whose envelopes were removed via stable Roche lobe overflow. The curves are colour coded by the final mass of the white dwarf. The Roche lobe overflow should emulate the envelope removal of a CE albeit on a much slower time-scale. We expect that immediately after the CE phase the proto-WD has a radius of ≲ 0.1 R⊙, and the cooling tracks start near the dot–dashed horizontal line. Isochrones corresponding to the log of the cooling age (in yr) extending from 6.0 to 9.5 are indicated by dashed lines and are labelled. The boxed region (yellow rectangle) encloses the range of radii and Teff that we are considering in this work.
Applying these results to WD1202-024, we find that for the first 105–106 yr, or so, the evolving proto-WD would have a very large radius that would greatly overfill its Roche lobe in a 71-min binary. However, during a CE phase, which lasts much less time than 105 yr (see e.g. Sandquist et al. 1998), the H-rich tenuous envelope would be sufficiently extended that it would be quickly stripped away. By the end of the CE phase we would expect its thermally bloated radius to be no larger than 0.1 R⊙ due to the rapid stripping. A star of this latter radius could indeed be accommodated within the Roche lobe at a period of 71 min. In any case, within a time of ∼50 ± 20 Myr, the radius would have shrunk to a value close to that observed today, namely Rwd ≈ 0.021 ± 0.001 R⊙ (the boxed region in Fig. 9). In fact, we used these later-time cooling tracks to derive the rough mass–radius relation that we employed in the MCMC evaluation of the system parameters, namely equation (6).
6.3 Alternate scenario
6.3.1 Invoking a prior nova explosion
Even though it appears that WD 1202-024 is not now in Roche lobe contact and it is not transferring mass from the companion star to the WD, we should also consider the possibility that it had done so in the past. Suppose that this is indeed a very old system, where the current companion star was initially much more massive, and it lost most of its envelope during a long (∼Gyr) mass-transfer phase. This raises several questions, including: (i) why is there now apparently no mass transfer occurring, and (ii) why is the white dwarf still very hot and thermally bloated? Regarding the first of these, there is no evidence for any CV or dwarf nova activity reported from this object in the literature (see e.g. Ritter & Kolb 2003). There are no evident emission lines in the spectrum due to an accretion disc (see Fig. 3). The photometric light curve of WD 1202-024 (see Figs 5 and 6) is symmetric about the eclipse as opposed to a number of eclipsing CVs undergoing mass transfer which exhibit distinctly asymmetric light curves due to the accretion disc hotspot (see e.g. fig. 1 of Littlefair et al. 2007 and fig. 2 of Savoury et al. 2011). Additionally, there is no prior X-ray activity reported for this source (e.g. from the Rosat All-Sky Survey6) another possible signature of mass transfer in CVs.
The results of our analysis of the system parameters (see Table 5) indicate that the companion star is most probably filling 82–92 per cent of its Roche lobe with little statistical probability in the MCMC distribution for a filling factor of >97 per cent (at the 2-σ confidence level; see Table 5 and Fig. 7). However, if our estimates are slightly off due to unknown systematic errors, then it is still conceivable that the companion is very close to filling its Roche lobe (i.e. at ≳0.997).
6.3.2 Implications of a prior nova explosion
WD 1202-024 is well above the Galactic plane (at bII ≃ 58°) with little visual extinction. Thus, a nova at that location might well have been seen from the ground and reported, at least over the past century when better astronomical record-keeping began. Yet there is no evidence for any historical nova at this location (see e.g. Shafter 2017). In spite of this lack of an historical record of a nova, it is possible that such an event occurred centuries or even millennia prior to the current epoch. There have been numerous studies of the long-term cooling of the WD after nova explosions (see e.g. Starrfield 1971; Prialnik 1987; Bode 2004; Starrfield et al. 2004; Yaron et al. 2005 and references therein). It appears from these studies that the WD photospheres can cool to ∼50 000 K within about 30 yr (i.e. within the span of time since the Palomar Sky Survey was first carried out). However, cooling to values of Teff of ∼23 000 K (comparable to WD 1202-024) could take anywhere from a few hundred to a few thousand years.
We have checked these cooling times approximately using a Paczyński (1983) one-zone shell model for nova explosions on a WD of 0.4 M⊙, and find cooling times to 23 000 K for shell masses of 1, 3 and 10 × 10−4 M⊙ of 500, 2300 and 5000 yr, respectively. In any of these cases, the cooling of the white dwarf over the past 60 yr of photographic records of the object would have gone unnoticed.
In the end, we tentatively conclude that WD 1202-024 was not a longstanding CV that happens to be turned ‘off’ at the current epoch due to a past nova explosion or for any other reason. Our main piece of evidence for rejecting this hypothesis must stand on our measurement that the companion star is currently underfilling its Roche lobe by at least 3–17 per cent and not merely ≲0.3 per cent.
7 SUMMARY AND DISCUSSION
We have found a short-period binary, WD 1202-024, consisting of a hot, thermally bloated white dwarf in orbit with a low-mass companion star that is of brown-dwarf size and mass. Fortunately, there exist archival SDSS spectral data from which Kleinman et al. (2013) deduced the Teff and log g values for the white dwarf. We were also able to use the sub-exposures of the SDSS spectrum to extract three rough radial velocities over the course of an orbital cycle. In addition, we have obtained ground-based follow-up photometric observations that have yielded light curves for this 19th magnitude object that are good enough to resolve the ingress and egress, as well as to readily detect the out-of-eclipse illumination curve of the heated companion star.
When we analyse this light curve, coupled with the other constraints on the system, we are able to deduce the basic parameters of the binary. The results are summarized in Table 6. The mass and radius of the white dwarf are 0.415 ± 0.028 M⊙ and 0.021 ± 0.001 R⊙, respectively, while those parameters for the low-mass companion star are 0.061 ± 0.010 M⊙ and 0.088 ± 0.005 R⊙. The companion star fills between 82 per cent and 92 per cent of its Roche lobe, and ≲97 per cent with 2σ statistical confidence.
Summary properties of the WD 1202-024 binary.
| Parameter | Value |
|---|---|
| Porba (min) | 71.229 977 (30) |
| Porba (d) | 0.049 465 262 (20) |
| |$|\dot P_{\rm orb}|/P_{\rm orb}{}^a$| | < 5 × 10− 6 yr− 1 |
| T0a (BJD) | 2457 582.401 55 (6) |
| Kwdb (km s−1) | 88 ± 19 |
| Kwdc (km s−1) | 59 ± 7 |
| Kcomc (km s−1) | 396 ± 10 |
| ac (R⊙) | 0.444 ± 0.009 |
| Mwdc (M⊙) | 0.415 ± 0.028 |
| Rwdc (R⊙) | 0.021 ± 0.001 |
| Twdd (K) | 22 650 ± 540 |
| Mcomc (M⊙) | 0.061 ± 0.010 |
| Rcomc (R⊙) | 0.088 ± 0.005 |
| Tcom, sse (K) | 5250 ± 375 K |
| Tcom, heate (K) | 4390 ± 375 K |
| Tcom, darke (K) | ≲2450 K |
| ic(deg) | 84°–90° |
| Lbol, wdc (L⊙) | 0.104 ± 0.026 |
| Lv, com/Lv, wdc | ≲1 per cent |
| agewdf (Myr) | 50 ± 20 |
| τ (agebinary)c, g (Gyr) | |$3.4^{+2.7}_{-1.5}$| |
| Mprim, initc, g (M⊙) | 1.18 ± 0.26 |
| Pbin, initc, g (d) | |$155^{+60}_{-40}$| |
Notes. (a) From the photometric observations (Section 4). (b) Based on our cross-correlation analysis of the data from three individual SDSS spectral exposures (see Section 3). (c) Based on the MCMC analysis of the system parameters (see Section 5.1). (d) Taken from the SDSS spectra (Kleinman et al. 2013). (e) The subscripts ‘ss’, ‘heat’ and ‘dark’ refer to the temperature at the substellar point of the white dwarf, the mean temperature on the heated hemisphere and the effective temperature on the unheated side of the star (close to the companion's intrinsic temperature), respectively. The cited uncertainties for the former two temperatures come from using an albedo of 0.25 ± 0.25. (f) Inferred from the white dwarf cooling curves shown in Fig. 9. (g) The age of the binary since its primordial inception, the initial mass of the WD progenitor, Mprim, init, and the initial orbital period of the primordial binary, Pbin,init, are derived as part of the MCMC analysis utilizing a CE prescription (see Section 6.2).
The white dwarf is extremely hot at 22 640 K, likely the result of having emerged from a CE some 50 Myr ago. From the system geometry and the out-of-eclipse light curve, we infer that the substellar point on the companion star reaches a Teff of 5400 K, while the average value of Teff of the heated hemisphere is approximately 4390 K (see Table 6). We do not detect the companion star during total eclipse with a broad-band derived V-mag > 23, and in the Sloan i-band of 24th magnitude. From that, we infer that the temperature on the dark side of the companion is below ∼2500 K, or some ≳1900 K below that of the irradiated hemisphere. Thus, heat is not transported efficiently around to the dark side of the companion. However, it would be very useful to follow up our study in the future with the K-band observations, especially during the total eclipse.
Based on (i) the lack of evidence for mass transfer; (ii) the thermally bloated nature of the white dwarf and (iii) evidence from our analysis that the companion star somewhat, but significantly, underfills its Roche lobe, we conclude that this system is not currently, nor has it ever been, a mass transferring CV. Instead, it appears that the system has relatively recently emerged from a CE phase, and the current low-mass companion star is basically the original secondary star in the primordial binary. If this is borne out by future studies of this system, then it provides a further demonstration that a star of brown-dwarf proportions can successfully eject the envelope of a much more substantive G star and end up in a very short period system, still underfilling its Roche lobe (see e.g. Politano 2004; references in Table 7). There are six other known pre-CVs with short periods and low-mass companions, and we summarize some basic information about these in Table 7 and references therein. WD 1202-024 is then the shortest period pre-CV yet found (see e.g. Zorotovic et al. 2011; Steele et al. 2013; Casewell et al. 2015).
White dwarfs in close detached binaries with brown-dwarf or transition-object companions.
| Object name | Porb (min) | Mwd (M⊙) | Teff (K) | Mcom (M⊙) | Eclipsing | Ref. |
|---|---|---|---|---|---|---|
| GD 1400 | 600 | 0.67 | 11 600 | 0.06a | no | 1,2,3 |
| WD 0837+185 | 250 | 0.80 | 15 000 | 0.024a | no | 4 |
| SDSS J1557 | 136 | 0.45 | 21 800 | 0.063 | no | 5 |
| SDSS J1411 | 122 | 0.53 | 13 000 | 0.050 | yes | 6,7 |
| WD 0137-349 | 116 | 0.4 | 16 500 | 0.053 | no | 8,9,10 |
| NLTT 5306 | 102 | 0.44 | 7756 | 0.053 | no | 11 |
| WD 1202-024 | 71 | 0.41 | 22 650 | 0.067 | yes | this work |
Notes. (a) This value is Mcomsin i. References: (1) Farihi & Christopher (2004); (2) Dobbie et al. (2005); (3) Burleigh et al. (2011); (4) Casewell et al. (2012); (5) Farihi, Parsons & Gäsicke (2017); (6) Littlefair et al. (2014); (7) Beuermann et al. (2013); (8) Casewell et al. (2015); (9) Maxted et al. (2006); (10) Burleigh et al. (2006); (11) Steele et al. (2013).
There are several other short-period binaries containing a white dwarf and an irradiated brown dwarf with system parameters comparable to those of WD 1202-024, but where mass transfer is clearly taking place. These include SDSS J143317.78+101123.3 (Porb ≃ 78 min, Mcom ≃ 0.057 M⊙; Hernández Santisteban, Knigge & Littlefair 2016) and SDSS J150722.30+523039.8 (Porb ≃ 66.6 min, Mcom ≃ 0.056M⊙; Littlefair et al. 2007). In spite of the fact that they have similar system parameters, they are clearly in the process of transferring mass from the donor star to the white dwarf that leads to such phenomena as asymmetric light curves, emission from an accretion disc, and so forth. This lends more confidence to the fact that, since these phenomena are not seen in WD 1202-024, this system is indeed detached.
If gravitational radiation is the only sink of angular momentum dissipation, we anticipate that WD 1202-024 will achieve Roche lobe contact within ≲250 Myr and that its orbital period will then be about 55 min. It will then subsequently evolve to longer orbital periods (see black track in Fig. 8), in much the same way as do more typical CVs that have evolved starting with much more massive companion stars.
Acknowledgments
We are grateful to Paul Schechter for acquiring the Magellan Sloan-i band images. We thank Jules Halpern for facilitating the participation of JRT in this project, as well as for helpful discussions. We thank the referee for extensive, insightful and very helpful comments. AV is supported by the National Science Foundation Graduate Research Fellowship, Grant No. DGE 1144152. The amateur observers (BLG, TGK) are self-funded so for them no institutional or tax-funded agencies need acknowledgement. BK acknowledge the support provided by the Turkish Scientific and Technical Research Council (TÜBİTAK-112T766). JRT thanks the South African Astronomical Observatory for allocating telescope time, Patrick Woudt and David Buckley for help obtaining the time, the University of Cape Town Astronomy Department for their warm hospitality, and Mokhine Motsoaledi for help at the telescope. This paper includes data collected by the K2 mission. Funding for the K2 mission is provided by the National Aeronautics and Space Administration (NASA) Science Mission directorate. The Galaxy Evolution Explorer (GALEX) satellite is a NASA mission led by the California Institute of Technology. TGK thanks Beth Christie and Cheryl Healy for material support in JBO telescope operations and equipment. LN thanks the Natural Sciences and Engineering Research Council (Canada) for financial support through the Discovery Grants program, F. Maisonneuve and E. Dubeau for their work on the stellar models, and Wen-Jian Chung and the staff at the Observatoire Astronomique du Mont-Mégantic for their technical assistance. Some computations were carried out on the supercomputers managed by Calcul Québec and Compute Canada. The operation of these supercomputers is funded by the Canada Foundation for Innovation (CFI), NanoQuébec, Réseau de Médecine Génétique Appliquée, and the Fonds de recherche du Québec – Nature et technologies (FRQNT).
This paper includes data gathered with the 6.5 m Magellan Telescopes located at Las Campanas Observatory, Chile.
http://irsa.ipac.caltech.edu/Missions/wise.html (Wright et al. 2010).
For the product of these two parameters, we adopted randomly chosen values between 0.2 and 0.5 (see e.g. Tauris & Dewi 2001). For values of λα as small as 0.1, the mass of the primary becomes too low for it to evolve during a Hubble time.
https://heasarc.gsfc.nasa.gov/docs/rosat/rass.html (Voges et al. 1999).
REFERENCES
