The freezing of water and melting of ice are among the most dramatic examples of phase transitions in nature. Melting ice accounts for everyday phenomena as diverse as the electrification of thunderclouds, in which the liquid layer on ice chunks facilitates the transfer of mass and charge during collisions between them; frost heave powerful enough to lift boulders from the ground (see April 2003, page 23); and, of course, slippery surfaces.
Everyday experience suggests why ice surfaces should be slippery: Water spilled on a kitchen floor or rainwater on asphalt or concrete can create the same kinds of hazards for walkers and drivers that ice can. Presumably, the liquid makes the surface slippery because liquids are mobile, whereas solid surfaces are relatively rigid. Asking why ice is slippery is thus roughly equivalent to asking how a liquid or liquid-like layer can occur on the ice surface in the first place.
Pressure melting
The common perception, even among those with a moderate knowledge of science, is that skaters slide more easily on ice than on other solids because ice melts under their skates’ pressure to produce a film of water. Water is denser than ice and occupies about 10% less volume per mole. So according to Le Chatelier’s principle, an increase in pressure results in melting the ice and decreases the sample’s volume. That is, if melting had occurred by itself, it would have resulted in a decrease in pressure.
The science of the observation originated in 1850, when James Thomson developed an expression for the linear dependence of the freezing point depression on pressure. His brother William, later Lord Kelvin, verified that result experimentally. Neither, however, referred to ice skating. That inference had to wait until 1886, when a young engineer named John Joly worked on the problem and referred to Thomson’s results. Joly pointed out that the pressure of a skater’s blade edge is so great because it touches the ice over so small an area. He calculated a pressure of 466 atmospheres and a corresponding melting point of −3.5 °C, a temperature that creates a film of water on which the skater slides (see figure 1).

Figure 1. An ice skater exerts pressures on the order of a few hundred atmospheres on the ice surface, enough to reduce the melting temperature by only a few degrees. Premelting—the development of a liquid-like surface layer at temperatures below freezing—and frictional heating of the ice as skaters move around must account for ice’s slipperiness at the wide variety of subzero temperatures found in nature.
Figure 1. An ice skater exerts pressures on the order of a few hundred atmospheres on the ice surface, enough to reduce the melting temperature by only a few degrees. Premelting—the development of a liquid-like surface layer at temperatures below freezing—and frictional heating of the ice as skaters move around must account for ice’s slipperiness at the wide variety of subzero temperatures found in nature.
Osborne Reynolds also invoked pressure melting in 1899 to explain ice skating. But his inspiration came from watching solder melt when it was pressed against a soldering iron. Reynolds assumed that a similar pressure produced a liquid film on ice that made skating possible. 1
Joly never explained how skating might be possible at temperatures lower than −3.5 °C. And there’s the problem. The optimum temperature for figure skating is −5.5 °C and for hockey, −9 °C; figure skaters prefer slower, softer ice for their landings, whereas hockey players exploit the harder, faster ice. Indeed, skating is possible in climates as cold as −30 °C and skiing waxes are commercially available for such low temperatures. In his 1910 account of his last expedition to the South Pole, Robert Falcon Scott tells of skiing easily at −30 °C. But Scott’s chief scientist, Edward Wilson, described the snow surface as sandlike at −46 °C. Based on his soldering-iron experiments, Reynolds might have anticipated that frictional melting must play a role as well as pressure melting, inasmuch as heat caused the melting of his solder. But surprisingly, even with little evidence in its favor, pressure melting remained the dominant explanation of the slipperiness of ice for nearly a century.
Frictional heating
Frank P. Bowden and T. P. Hughes suggested the frictional heating alternative to pressure melting in a 1939 article. 2 Remarkably, no one before them had calculated that a skier’s pressure on snow is insufficient to cause melting at low temperatures. Bowden and Hughes carried out an extensive set of experiments in a cave dug out of the ice above the research station in Jungfraujoch, Switzerland, at an altitude of 3346 meters. Cave temperatures never rose above −3 °C, and the team achieved lower temperatures by using solid carbon dioxide and liquid air. Using surfaces of wood and metal, they measured both static and kinetic friction. Because metal skis showed higher friction than wooden skis, the researchers concluded that frictional heating was responsible for melting the ice; frictional heating would be affected by the conductivity of the skis, but pressure melting would not. Pressure melting seemed to play a role only near the melting point.
Geophysicist Samuel Colbeck made a series of contributions to the debate in a series of papers published between 1988 and 1997. 3 In the earliest, he argued against the pressure-melting explanation on the basis of calculations of the pressure required to melt ice at low temperatures and on the basis of the phase diagram, which shows the transition of ice from one solid phase to another at −22 °C (see figure 2). The argument confirmed again how pressure melting leaves unexplained the ability to ski and skate at temperatures as low as −35 °C. Colbeck also pointed out that the pressure required to cause melting at the lower temperatures would squeeze the liquid film to such an extent that the friction generated, far from facilitating skating, would resist it.

Figure 2. Phase diagram of H2O. Ice exhibits a rich variety of crystalline and glassy structures in at least 11 distinct phases (7 are shown here) at different pressures and temperatures. The ice—water phase transition is simpler. The melting temperature increases steadily with pressure except at low pressures, where the familiar hexagonal ice-Ih structure is less dense as a solid than a liquid.
Figure 2. Phase diagram of H2O. Ice exhibits a rich variety of crystalline and glassy structures in at least 11 distinct phases (7 are shown here) at different pressures and temperatures. The ice—water phase transition is simpler. The melting temperature increases steadily with pressure except at low pressures, where the familiar hexagonal ice-Ih structure is less dense as a solid than a liquid.
He and coworkers then provided experimental evidence for frictional heating by fastening a thermocouple to a skate blade (and later to the bottoms of skis). The increase in temperature with velocity, they observed, was consistent with frictional, localized heating of the ice underfoot to create a thin water layer. Were pressure melting—an endothermic process—the dominant contribution, the researchers would have expected a decrease in temperature.
Melting below zero
Neither pressure melting nor frictional heating explains why ice can be so slippery even while one is standing still on it. What evidence is there for the existence of liquid at the surface—even at temperatures below zero? Although he was apparently unconcerned with ice skating and frictional effects on surfaces, Michael Faraday took the first steps toward answering that question. In a discourse given at the Royal Institution on 7 June 1850, he devoted most of his remarks to elegant experiments he had conducted on regelation, the freezing together of two ice cubes when they come into contact. Faraday suggested that a film of water on ice will freeze when placed between the two pieces of ice, although the film remains liquid on the surface of a single piece. The liquid layer that coats the ice cubes, he argued, must play a critical role in freezing them together. Observations of wet snow freezing may have inspired Faraday’s claims, but his experiments were nevertheless the first to investigate the phenomenon of premelting, the development of a liquid layer that forms on solids at temperatures below the bulk melting point.
Not everyone at the time was convinced. Shortly after Faraday’s published account appeared in 1859, 4 James Thomson took the position that the regelation Faraday observed was due to pressure on the ice cubes. The resulting absorption of the heat of melting caused the refreezing, he argued, although he provided no additional experimental evidence. Later that year, Faraday replied to Thomson’s views, arguing for the presence of a liquid layer near the melting point mainly on the basis that ice cannot be superheated, whereas liquid water can be superheated and supercooled. 5
An 1860 article offered a more complete rebuttal, with new experimental results. Faraday prepared two pieces of ice, each attached by a thread to lead weights that submerged them in a water bath maintained at 0 °C. When displaced laterally, they returned to their original places “with considerable force.” “If brought into the slightest contact, regelation ensued, the blocks adhered, and they remained adherent notwithstanding the force tending to pull them apart.” 5 Thomson, unconvinced, replied yet again. J. Willard Gibbs, in a long, though little noticed, footnote to his famous 1876 paper on thermodynamics, took account of the work and found that his conclusions were “in harmony with the opinion of Professor Faraday.”
Remarkably, despite the elegant and simple experiments and published support from Gibbs, Faraday seems to have been forgotten, and Thomson’s views prevailed. Thomson’s purely verbal arguments held sway for nearly a century. Indeed, it wasn’t until 1949 that a modern scientist, C. Gurney, suggested that an intrinsic liquid film plays a role in the slipperiness of ice. Gurney hypothesized that molecules, inherently unstable at the surface due to the lack of other molecules above them, migrate into the bulk of the solid until the surface becomes unstable, which prompts the formation of a liquid phase. Two years later, W. A. Weyl accepted Faraday’s concept of a liquid film on the surface of ice and developed a model based on the differences between the molecular arrangement of water molecules in the bulk and on the surface. 6
In the mid-1950s, different research teams put the concept on a quantitative footing by performing experiments reminiscent of Faraday’s own investigations on the freezing together of ice cubes. In each case they measured the force of adhesion between two spheres of ice allowed to touch. 7 Charles Hosler’s group at the Pennsylvania State University achieved particularly compelling results (see figure 3). The group compiled data from a series of experiments, each conducted at a different temperature between −25 °C and 0 °C at the vapor pressure of ice, to construct a smooth curve of the forces required to pull ice spheres apart. At vapor pressures below ice saturation, no adhesion occurred below −4 °C. The researchers inferred that the expected roughness of the surfaces was removed by the presence of a liquid film whose thickness was sufficient to provide a smooth surface of contact.
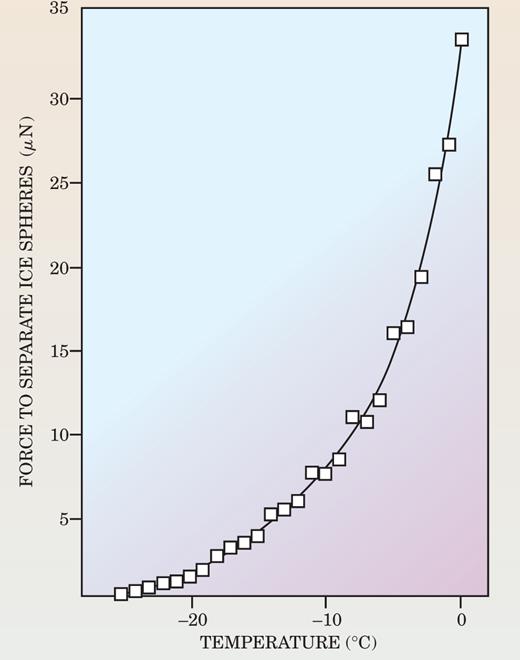
Figure 3. In a series of 1957 experiments, Charles Hosler and colleagues measured the force required to pull apart a pair of ice spheres in equilibrium and touching each other. The force increased as the temperature increased, an indication that warmer—though still subzero—temperatures form increasingly thick liquid-like layers on each sphere’s surface.
Figure 3. In a series of 1957 experiments, Charles Hosler and colleagues measured the force required to pull apart a pair of ice spheres in equilibrium and touching each other. The force increased as the temperature increased, an indication that warmer—though still subzero—temperatures form increasingly thick liquid-like layers on each sphere’s surface.
In the years since Weyl’s and Gurney’s papers appeared, experimentalists and theoreticians have done much to understand the relative contributions of pressure melting, frictional heating, and the presence of liquid-like films on surfaces of ice. Each mechanism plays a role that depends on the temperature (for a review, see reference 8). Of those contributions, the precise nature of the liquid-like layer has been the most elusive.
Measuring thickness
In 1963 J. W. Telford and J. S. Turner carried out a series of regelation experiments, each at a different temperature, in which a wire under pressure slowly migrates through ice. 9 The experiment was a quantitative version of an earlier one used to support the hypothesis of pressure melting. Using a contact on the wire as part of a potentiometer circuit, the researchers precisely measured the velocity and found that it increased linearly with temperature from −3.5 °C to −0.5 °C. From −0.5 °C to the melting point, the velocity of the wire’s passage increased sharply. For the force applied and the size of wire used, they calculated a melting-point decrease of −0.5 °C due to pressure melting, yet another indication that pressure melting was not responsible for the passage of the wire through ice below that temperature. The quasi-static nature of the motion meant frictional processes played no role either. Nor was creep—the slow mechanical deformation of a solid—responsible for the wire’s motion, to judge from the activation energy they calculated.
Rather, Telford and Turner interpreted their results in terms of the flow of a thin Newtonian shear layer of a viscous fluid around the wire, and calculated a layer thickness that satisfied a function (T - T m)−1/2.4, where T is the temperature in kelvin, and T m is the melting point temperature. In 1980, R. R. Gilpin 9 extended Telford and Turner’s work to the broader temperature range of −35 °C to −0.005 °C. At −35 °C, the calculated viscosity of the water in the liquid layer is at most a few times greater than that of bulk water. Gilpin found both a slow mode and a fast mode for the wire’s motion, in accord with Telford and Turner, and fit the velocity as a function of temperature in the slow mode to the same function. The phenomenon occurred at temperatures well below −22 °C.
In 1969, Michael Orem and Arthur Adamson found yet more surprising evidence for the presence of a liquid-like layer on the surface of ice when they compared the physical adsorption of simple hydrocarbon vapors on ice with their adsorption on a liquid-water surface. Above −35 °C the adsorption isotherm of n-hexane on the surface of ice tracks that of the same vapor on the surface of liquid water, but not at temperatures below −35 °C. The entropy and enthalpy of adsorption also track the pattern of liquid water above −35 °C, but not below. Orem and Adamson interpreted their results as indicating that the onset of ice’s surface premelting is at −35 °C.
That liquid layers persist to such low temperatures can have striking environmental consequences. In the 1990s, chemistry Nobel laureate Mario Molina and coworkers, for instance, attributed the adsorption of hydrochloric acid on polar stratospheric clouds to the existence of a liquid-like layer on ice. The adsorption plays a role in the destruction of ozone. 10
Since the mid-1960s, a variety of experimental approaches, performed under a variety of conditions, have been brought to bear on the premelting problem to determine the temperature range and thickness of any postulated layer. (For review of the literature on the topic up to that time, see reference 11.) Unfortunately, those different experimental conditions, ranging from high vacuum to the equilibrium vapor pressure of ice, make comparison between experimental results difficult (see figure 4).

Figure 4. A compilation of data from different experimental approaches illustrates the variation of thicknesses of the liquid-like layer on ice obtained by different methods.
Figure 4. A compilation of data from different experimental approaches illustrates the variation of thicknesses of the liquid-like layer on ice obtained by different methods.
Nuclear magnetic resonance (NMR) provided evidence for a liquid layer on the surface of ice: Below the melting point there is a narrow absorption line, not the broad line one would expect from a periodic solid. 12 Molecules at the surface between −20 °C and 0 °C rotate at a frequency five orders of magnitude greater then those in bulk ice and about 1/25 as fast as those in liquid water. The self-diffusion coefficient is two orders of magnitude larger than that in bulk ice.
Using proton backscattering, researchers in 1978 found surface vibrations of the oxygen atoms roughly 3.3 times the amplitude of their value in the bulk, and an amorphous layer 10 times thicker than what NMR measurements had estimated. 13 But, unlike NMR, the proton backscattering measurements were made under high vacuum, a condition markedly different from the finite vapor pressures at which surface melting typically occurs.
X-ray diffraction offers perhaps the most convincing evidence for the liquid-like layer on the surface of ice. 14 Work done in 1987 found that the intermolecular distance on the ice surface is slightly smaller than it is in liquid water, whose intermolecular distances are, of course, smaller than ice’s are. In the mid-1990s Helmut Dosch (Max Planck Institute for Metal Research and the University of Stuttgart) and coworkers published a series of more detailed papers on their study of ice surfaces using glancing-angle x-ray scattering. This group found a liquid-like layer on the different crystallographic ice surfaces between −13.5 °C and 0 °C. Their model describes a surface layer that exhibits rotational disorder with intact long-range positional order well below the surface melting temperature. At the surface-melting temperature, a completely disordered layer exists on the surface above the rotationally disordered layer.
In 2004 Harald Reichert, Dosch, and colleagues studied the interface between ice and solid silicon dioxide using x-ray reflectivity and calculated the thickness and density of that liquid-like layer between −25 °C and 0 °C. The density of the surface phase turned out to vary from the typical value of liquid water at the melting point to 1.17 g/cm3 at −17 °C—close to that of the high-density form of amorphous ice, and reminiscent of Yoshinori Furukawa’s results on the intermolecular distance measured between oxygen atoms in the surface layer.
In 1998, using atomic force microscopy, Astrid Döppenschmidt and Hans-Jurgen Butt, both at the Gutenberg University in Mainz, Germany, measured the thickness of the liquid-like layer on ice. 15 Capillary forces on the liquid surface prompted the AFM’s cantilever tip to jump into contact with the solid ice once it reached the much softer layer’s level. The upper limit in thickness of the liquid-like layer varied from 12 nm at −24 °C to 70 nm at −0.7 °C. Their results indicated that at about −33 °C surface melting starts.
Döppenschmidt and Butt also found that the surface layer is thicker when salt is present. Indeed, Yale University’s John Wettlaufer argues that the presence of impurities in the surface films can explain the wide thickness variation in the liquid-like film on ice and the temperature dependence of the thickness that researchers have found using various techniques. 16 Wettlaufer describes the transition with increasing temperature from a disordered solid to a partly structured quasi-liquid to a fluid; hence the difficulty of finding consistent descriptions with different techniques. Further progress toward understanding the surface of ice may be dependent on performing several kinds of measurements on the same surface under comparable conditions.
The nature of the liquid-like layer is not clear from experimental measurements, so theorists have tried to clarify the situation. In 2004 Tomoko Ikeda-Fukazawa (Japan Science and Technology Agency) and Katsuyuki Kawamura (Tokyo Institute of Technology) performed molecular dynamics simulations of the ice-Ih surface as a function of temperature. 17 Figure 5 illustrates the melted or liquid-like surface layer calculated in a simulation of the surface at −20 °C.
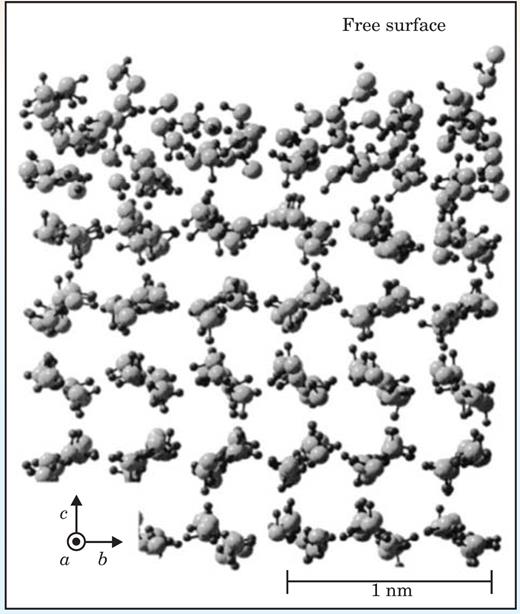
Figure 5. Molecular-dynamics simulations calculate the variation from the periodic lattice that surface molecules suffer in the premelted phase at −20 °C. The large gray circles represent oxygen atoms and the small black circles, hydrogen atoms; the thin lines represent covalent bonds that connect them.
Figure 5. Molecular-dynamics simulations calculate the variation from the periodic lattice that surface molecules suffer in the premelted phase at −20 °C. The large gray circles represent oxygen atoms and the small black circles, hydrogen atoms; the thin lines represent covalent bonds that connect them.
The periodic structure breaks down and the molecular layers adopt a more amorphous reconstruction in response to the reduced number of chemical bonds holding the surface molecules in place. Atoms in the outermost surface vibrate with greater amplitude as a function of temperature than atoms in the interior lattice (see figure 6). Surface melting is attributable to the interaction of the vibrational motion of the surface molecules with the interior bulk molecules.
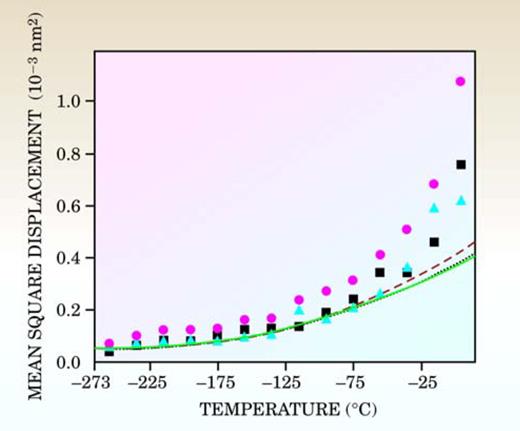
Figure 6. With fewer chemical bonds to hold them in place, surface molecules vibrate with greater amplitude than those located in the bulk crystal. The mean square displacement (MSD) of oxygen and hydrogen atoms on the outermost surface of ice reflects that thermal vibration and increases as a function of temperature. The squares, triangles, and circles represent the average MSD of the outermost oxygen bilayer of the crystal surface along the a-, b-, and c- axes, respectively; the dotted, dashed, and solid lines indicate the MSD of bulk ice along those axes.
Figure 6. With fewer chemical bonds to hold them in place, surface molecules vibrate with greater amplitude than those located in the bulk crystal. The mean square displacement (MSD) of oxygen and hydrogen atoms on the outermost surface of ice reflects that thermal vibration and increases as a function of temperature. The squares, triangles, and circles represent the average MSD of the outermost oxygen bilayer of the crystal surface along the a-, b-, and c- axes, respectively; the dotted, dashed, and solid lines indicate the MSD of bulk ice along those axes.
Beyond ice
The phenomenon of surface melting is not limited to ice. In 1985 Joost W. M. Frenken and J. F. van der Veen of the Institute for Atomic and Molecular Physics in Amsterdam fired a beam of ions against a lead crystal and monitored the scattering. 18 Based on how the ions backscattered into their energy detectors, the researchers deduced that lead has a melting transition far short of its bulk melting temperature (327 °C) and found a phase in which the surface became completely disordered at 307 °C. The surface film’s thickness rises logarithmically with temperature. Since then, experiments have verified liquid-like surface layers on metals, semiconductors, molecular solids, and rare gases.
The slipperiness of other solids is another matter. Although diamond does not exhibit surface melting at room temperature, it does have, below its melting point, a kinetic coefficient of friction even smaller than ice—the friction coefficient, measured in air, can be as low as 0.1 for diamond-like carbon films sliding on each other. Friction coefficients are highest (about 0.6) on diamond measured in vacuum, with successively lower values measured in hydrogen, oxygen, and water-vapor atmospheres—the presence of gases serves to tie up reactive dangling bonds on a surface. The friction coefficient of ice sliding on ice, in comparison, varies between 0.1 and 1.5, depending on sliding velocity.
In an argon atmosphere, lead, zinc, tin, and cadmium powders all exhibit lower friction from 10 to 100 °C below their melting points when used as lubricants for steel rubbing against steel. Indeed, researchers have modeled the lubrication between two metal surfaces in which one has a low melting temperature and found evidence that frictional melting provides lubrication by a liquid film. Whether these observations or the model support the notion that a frictionally melted layer would permit skating on a metal surface near or below its melting point is surely an open question.
I am grateful to Brian Hoffman and Richard Van Duyne for the initial impetus to write this article, to Samuel Colbeck for many valuable discussions, and to Franz Geiger and Louis Allred for a careful reading of an early draft.
REFERENCES
Bob Rosenberg is an emeritus professor of chemistry at Lawrence University in Appleton, Wisconsin, and a visiting scholar at Northwestern University in Evanston, Illinois.