
ABSTRACT
The color‐magnitude diagram of M67 is used to constrain the value of the parameter Fover in its ≈1.3 M⊙ turnoff stars: Fover is effectively the fraction of the maximum possible extent of convective core overshooting predicted by the Roxburgh (1989, A&A, 211, 361) criterion. Isochrones that treat overshooting using the parameterized Roxburgh criterion are able to reproduce the morphology of the cluster turnoff, including the luminosity of the gap, if Fover ≈ 0.07 (assuming current best estimates for the reddening and metallicity). Previous studies have derived values of Fover near 0.5 in open clusters of similar metallicity but having turnoff masses ≥1.55 M⊙, indicating that the overshooting parameter is a strong function of mass in the lowest mass stars that retain convective cores throughout the main‐sequence phase. NGC 188 appears to be too old for core overshooting to play any role in the evolution of stars that are currently in the core H‐burning phase, but the availability of well‐calibrated BVRI photometry for this system, together with Landolt photometric standards, provides valuable tests of the color‐Teff relations that apply to [Fe/H] ≈ 0.0 stars. Our analysis of color‐color diagrams, in particular, suggests that the Castelli (1999, A&A, 346, 564) V−R and V−I transformations for lower gravity stars are more realistic than those published recently by VandenBerg & Clem (2003, AJ, 126, 778). The same color‐color diagrams also indicate that the differences in recent (V−I,V) diagrams for M67 appear to be due, at least in part, to the difficulty of defining the standard VRI photometric system. The ages of M67 and NGC 188 that have been derived in this study are 4.0 and 6.8 Gyr, respectively, which is consistent with other modern determinations.
Export citation and abstract BibTeX RIS
1. INTRODUCTION
Open cluster studies conducted during the past decade have shown that stellar models must allow for convective core overshooting if they are to provide satisfactory matches to observed color‐magnitude diagrams (CMDs); see, e.g., Daniel et al. (1994), Demarque et al. (1994), Nordström et al. (1997), Rosvick & VandenBerg (1998), Gim et al. (1998), and Kalirai et al. (2001). This finding, coupled (in particular) with the supporting evidence from binary stars (see Andersen 1991; Schröder et al. 1997), has provided a compelling case against models that neglect overshooting. It is, in fact, for this reason that most modern grids of evolutionary tracks and isochrones (including those by, e.g., Meynet et al. 1994; Claret 1995; Girardi et al. 2000; Yi et al. 2001) assume that convective cores are enlarged by some fraction of a pressure scale height, HP (usually 0.2HP–0.25HP or an equivalent amount if a different formalism is employed).
New sets of overshooting stellar models are currently being computed by D. A. VandenBerg, P. A. Bergbusch, & P. D. Dowler (2004, in preparation). Unlike the case with existing grids, the sizes of convective cores are determined using a modified version of the Roxburgh (1978) criterion. As discussed subsequently by Roxburgh (1989), convective cores should not extend beyond the radius rmax where
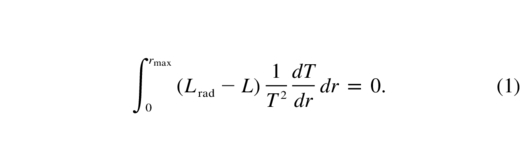
(L and Lrad represent the total luminosity produced by nuclear reactions and the radiative luminosity, respectively, while the other symbols have their usual meanings.) This equation gives the maximum size of a convective core, because it does not allow for the viscous dissipation of energy, which requires the evaluation of a second, much more complicated integral. According to the most general form of Roxburgh's criterion, the radius for which the difference between these two integrals vanishes defines the actual boundary of a central convective zone. Because this second integral is so intractable, we have opted to represent it as a fraction of the first integral.
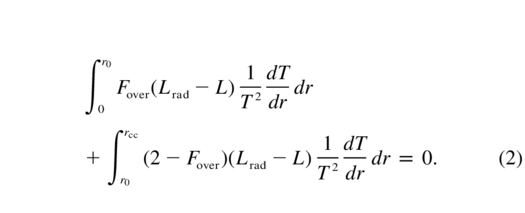
To be more specific, at smaller radii than the classical core boundary r0 (where ∇ad = ∇rad), Lrad<L, and the integrand in equation (1) is positive. In this part of the star, we can allow for dissipative processes by multiplying equation (1) by a factor (1 - Fdiss), where 0.0≤Fdiss≤1. At larger radii (i.e., in the overshooting zone), Lrad>L, and given that the dissipation term is always positive, the multiplicative factor must be changed to (1 + Fdiss). In fact, we prefer to use Fover = 1 - Fdiss as the overshooting parameter, because Fover = 0 implies that there is no overshooting beyond the boundary given by the Schwarzschild criterion (i.e., rcc = r0), whereas Fover = 1 implies that the core is enlarged by the maximum possible amount of overshooting (i.e., rcc = rmax). With this change of variable, the integral equation that must be solved for the convective core boundary rcc can be written as
Observational constraints must then be used to calibrate the parameter Fover as a function of mass and chemical composition. As long as this quantity does not vary appreciably with evolutionary state, this approach should yield results that are faithful to the generalized Roxburgh criterion, which was derived from the relevant equations of fluid dynamics.
The main purpose of the present investigation is to determine the value of Fover that applies to turnoff stars in M67, which is arguably the oldest known open cluster with accurately determined parameters (metallicity, distance) that has a well‐defined gap at the main‐sequence turnoff (MS TO). It provides an especially important constraint on the variation of Fover with stellar mass, in the case of near‐solar abundance stars, because its ≈1.3 M⊙ TO stars are only 0.15–0.2 M⊙ more massive than the lowest mass MS star that is expected to retain a convective core until central H exhaustion. Earlier studies have revealed that Fover ≈ 0.5 in both NGC 6819 (Rosvick & VandenBerg 1998) and NGC 7789 (Gim et al. 1998), which were found to have TO masses near 1.55 and 1.8 M⊙ and ages of ∼2.5 and ∼1.6 Gyr, respectively. As shown in § 2, a much smaller value of Fover must be assumed in models that are fitted to the ∼4 Gyr TO stars of M67. (As shown in a forthcoming study by P. D. Dowler & D. A. VandenBerg [see also Dowler 1994], the amount of overshooting that is calculated using eq. [2] with Fover = 0.5 is approximately equivalent to the net effect over the MS lifetime of extending the convective core by Λ = 0.2HP–0.25HP. The two parameters [Fover and Λ] are not simply related; measured as a fraction of a pressure scale height, the extent of overshooting derived from the Roxburgh criterion is initially small at the zero‐age MS, rising to ≳0.35HP just prior to central H exhaustion.)
In what follows, we also explore the implications of different assumptions concerning the helium and metal abundances of M67 for Fover, and also for the cluster distance/age and the quality of the isochrone fit to the observed CMD (by Montgomery et al. 1993, hereafter MMJ93).1 Most of our results are based on BV data, given current uncertainties in both the V−I transformations for stars with [Fe/H]≳0.0 (see VandenBerg & Clem 2003; hereafter VC03) and the available VI photometry (Sandquist 2004, hereafter S04). Further discussion of the difficulties with current VI photometry for M67 is presented at the end of § 2.
Fortunately, the quite well defined CMDs and color‐color diagrams for NGC 188 that can be constructed from the BV(RI)C data given by Stetson et al. (2004)2 provide important clues about the color‐temperature relations that are obeyed by near‐solar abundance stars. As described in § 3, in order to satisfy the constraints afforded by both NGC 188 and Landolt (1992) photometric standard stars, it appears to be necessary to make modest revisions to the semiempirical (V−R)‐Teff and (V−I)‐Teff relations published by VC03, primarily at log g≲3.5 and Teff≲5000 K. A derivation of the dependence of the inferred distance and age of NGC 188 on the assumed helium and metal abundances, along with our best estimate of the cluster age, is also contained in § 3. The main results of this study are then summarized in § 4.
2. M67
The reddening and metallicity of M67 appear to be particularly well established. The E(B−V) estimates derived from Strömgren photometry (Nissen et al. 1987), the two‐color diagram (Sarajedini et al. 1999), and the latest dust maps (Schlegel et al. 1998) are within ±0.005 mag of the mean value (0.036 mag) from these three sources. Throughout this study, we will adopt E(B−V) = 0.038 mag, as given by the Schlegel et al. reddening maps. High‐resolution spectroscopic studies have found the cluster stars to be slightly metal poor relative to the Sun: Tautvaišienė et al. (2000) have recently obtained [Fe/H] = -0.03 ± 0.03, in excellent agreement with the iron abundance ([Fe/H] = -0.04 ± 0.12) derived previously by Hobbs & Thorburn (1991). Very similar values (between −0.05 and −0.09) have been found using lower resolution spectroscopy (Friel & Janes 1993), calibrations of metallicity sensitive DDO indices (Janes & Smith 1984), and calibrations of the ultraviolet excess at (B−V)0 = 0.6 as a function of [Fe/H] (Montgomery et al. 1993).
VC03 have already shown that if E(B−V) = 0.038 and [Fe/H] = -0.04 are adopted for M67, then a MS fit of the MMJ93 CMD to isochrones for the adopted metallicity yields (m−M)V ≈ 9.65. This should be quite an accurate estimate of the apparent distance modulus, because the temperature scale of the models (for solar abundances) satisfies the solar constraint and because the color‐Teff relations that were used agree exceedingly well with the empirical transformations derived by Sekiguchi & Fukugita (2000) from a sample of solar neighborhood stars with well‐determined parameters. Encouragingly, the best‐fitting isochrone (for 4 Gyr) to the cluster subgiants also matches the red giants very well, and as shown by VC03, the predicted temperatures for the latter are in excellent agreement with those inferred from empirical (V−K) versus Teff relations. There are no obvious discrepancies between theory and observations, although the morphology of the TO can be matched by nondiffusive models only if a small amount of convective core overshooting is assumed, as demonstrated in the next section. (Note that the isochrone used by VC03 was taken from the present investigation.)
2.1. Overshooting in M67 Turnoff Stars
The value of Fover that must be assumed in stellar models in order to provide the best reproduction of an observed CMD can only be determined by an iterative process. That is, a grid of evolutionary tracks and isochrones must be computed for an initial guess at the value of Fover, and based on the resulting comparison between the synthetic and observed CMDs, this guess must be refined and the process repeated until the discrepancies between theory and observations are minimized. The computational effort can thus be quite considerable if isochrones for several different values of Y and Z (the mass‐fraction abundances of helium and heavier elements, respectively) are fitted to the same CMD.
Given that the metallicity of M67 appears to be well constrained to the range −0.1≲[Fe/H]≲0.0, as noted above, models have been computed for Z = 0.015, 0.0173, and 0.0188 with, in each case, assumed helium abundances corresponding to Y = 0.25, 0.2768, and 0.30. Our standard solar model for Z = 0.0188 required the adoption of Y = 0.2768 and a value of the usual mixing‐length parameter αMLT = 1.90 in order to match the observed luminosity and temperature of the Sun, respectively, at the solar age (4.6 Gyr). Although one naively expects that M67 has close to the same helium content as the Sun, given the similarity in metallicity, it is not impossible that the differences in Y are as much as 0.02–0.03. After all, the Hyades cluster appears to have a subsolar helium abundance despite its supersolar metallicity (see, e.g., Lebreton et al. 2001; VC03). It is, in any case, of some interest to examine how the results are affected when different helium (and metal) abundances are assumed.
Figure 1 provides some examples of MS fits of the MMJ93 CMD for M67 to isochrones for Y = 0.2768 and Z = 0.0173, in which the only quantity that is varied is Fover. The value of this parameter has no more than a small effect on the age implied by the cluster subgiants midway between the TO and the lower giant branch, as indicated, but it has a dramatic effect on the predicted morphology of the isochrone in the vicinity of the TO. Models with Fover≳0.1 are clearly inconsistent with the observed CMD insofar as (1) they fail to match the location of any of the cluster stars just above the observed gap (which spans the magnitude range indicated by the arrows bounded by short horizontal lines adjacent to the TO), and (2) the luminosities of their blueward hooks are appreciably too bright. The Fover = 0 (nonovershooting) models are similarly ruled out because they fail to predict a gap where one is observed; these computations show just the beginnings of a hook feature (as indicated by the dashed portion of the isochrone) at an MV that is ∼0.3–0.4 mag too faint. Only in the case of the isochrone for Fover ≈ 0.07 do the red and blue ends of the hook have absolute magnitudes that coincide well with those corresponding, in turn, to the bottom and top of the observed gap.

Fig. 1.— Several comparisons of isochrones for the indicated values of Fover and age with the Montgomery et al. (1993) CMD for M67. The isochrones in each panel, which were transposed to the observed plane using the color transformations reported by VC03, were computed for Y = 0.2768, Z = 0.0173, and αMLT = 1.90. (The assumed abundances correspond to [Fe/H] = -0.04.) In each of the four cases shown, E(B−V) = 0.038 and (m−M)V = 9.62 have been adopted for the cluster reddening and distance modulus, respectively. The observed gap spans the magnitude range indicated by the arrows just to the right of the turnoff. The part of each isochrone represented by a dashed curve indicates where very few stars are expected (for some justification of this prediction, see Michaud et al. [2004, their Fig. 14 and the associated text]).
However, the fit to the data in Figure 1b does not seem to be completely satisfactory either, because the isochrone matches only the brightest stars comprising the clump at MV∼3.1 and (B−V)0∼0.55, just above the gap. On the other hand, the binary fraction is known to be especially high in M67 (≳63%, according to MMJ93), and it is possible (if not probable, given their large numbers) that most of the stars in that clump are close binaries. Be that as it may, Figure 1b illustrates the best fit of an isochrone for [Fe/H] = -0.04 to the cluster photometry that we are able to obtain at this time. The inferred (small) value of Fover indicates that overshooting is much less important in M67 TO stars than in those of NGC 6819 (Rosvick & VandenBerg 1998) and NGC 7789 (Gim et al. 1998), which are both younger than M67 by ≳1.5 Gyr, and for which the best estimate of Fover is ≈0.5. The overshooting parameter apparently has a steep dependence on mass in the range 1.3≲M/M⊙≲1.55.
This conclusion is largely independent of the assumed metallicity and helium abundance for M67. As shown in Figure 2, nonovershooting models for any Y from 0.25 to 0.30 and any Z in the range 0.015≤Z≤0.0188 (or −0.12≲[Fe/H]≲0.01) fail to match the observed location of the gap in M67. That is, some amount of overshooting must be assumed in order for the models to satisfy this constraint. In fact, it is possible to obtain fits to the TO of M67 as good as that shown in Figure 1b for any Y,Z combination in the above ranges, provided that Fover is suitably defined. This is illustrated in Figure 3, which indicates that this parameter may be as low as 0.02 if Y = 0.25 and Z = 0.0188 (Fig. 3g), or as high as 0.12 if Y = 0.30 and Z = 0.015 (Fig. 3c). (Note that the predicted age varies from 3.6 to 4.6 Gyr, depending on the adopted values of Y and Z, and that it is affected at a level of ≲0.1 Gyr by the assumed small amounts of overshooting. In addition, in each panel the best‐fit isochrone was deemed to be the one that overlays the brightest stars in the clump just above the gap.) However, it is also apparent that the best fits to the entire CMD (i.e., including the subgiants and red giants) are obtained in Figures 3a, 3e, and 3i. Of course, this offers only weak support for these particular cases, given current uncertainties in, e.g., the treatment of convection, the low‐temperature opacities, and the color‐temperature relations, which can all affect the predicted position of the giant branch relative to that of the TO.

Fig. 2.— Comparisons of nonovershooting (Fover = 0) isochrones for the indicated values of Y, Z, [Fe/H], and age with the Montgomery et al. (1993) CMD for M67. In each case, E(B−V) = 0.038 (Schlegel et al. 1998) has been assumed, and the indicated value of (m−M)V was derived from a main‐sequence fit of the observations to the part of the isochrone that is fainter than MV∼4.5. Note that at a given Z, the [Fe/H] values differ slightly because of differences in the assumed He, and hence H, abundances. The color‐Teff relations given by VC03 were used to transpose the models from the theoretical to the observed plane.

Fig. 3.— Same as in the previous figure, except that overshooting isochrones are compared with the CMD of M67. To obtain the best match to the observed turnoff morphology, including the luminosity of the gap, the indicated values of Fover had to be assumed in the calculation of the grids of evolutionary tracks from which the isochrones were derived.
In the context of the present models, it is possible for nonovershooting isochrones to fit the morphology of M67 near its TO, but only if the cluster metallicity is greater than solar (by ≈0.1 dex if M67 has the same helium content as the Sun). Interestingly, as already mentioned in § 1, much improved consistency between the observed CMD of M67 and nonovershooting models can be obtained for a metallicity that is much closer to the observed value if gravitational settling and radiative acceleration processes are treated. The fit of diffusive models for [Fe/H] = 0.0 to the CMD of M67 reported by Michaud et al. (2004) is virtually identical to that shown in Figure 1b. This indicates that even less overshooting than that inferred from our models is needed to explain the cluster observations. (As shown by Michaud et al., the enlargement of convective cores on the MS due to the effects of diffusion decreases rapidly with increasing mass. Consequently, it can be anticipated that values of Fover near 0.5 would still be needed for fits of diffusive isochrones to the CMDs of NGC 6819 and NGC 7789. A rapid increase in Fover with increasing MS mass above ∼1.3 M⊙ appears to be a robust result.)
2.2. On the (V−I)‐Teff Relations Applicable to M67
As shown by VC03, their BV(RI)C transformations are such that the isochrone plotted in our Figure 1b provides a good match to both the (V, B−V) and (V, V−I) observations by MMJ93. However, they were unable to obtain similar consistency for the Hyades when isochrones for current best estimates of [Fe/H] and Y were fitted to the observed CMDs on the assumption of the Hipparcos distance. There were no obvious problems reproducing the BVR data, but there was an ≈0.02 mag offset between the predicted and observed MS locus on the [(V−I)0, MV] plane, in the sense that the models were too red. It was not possible for them to choose among the many possible explanations for that discrepancy.
It is worthwhile to revisit this problem, given that S04 has found "substantial differences" between his photometry for M67 and the observations published by MMJ93, which played a central role in the determination of the (V−I)‐temperature relations by VC03. These two data sets are compared on the B−V versus V−I plane in the top panel of Figure 4, in which small filled circles represent the high‐probability single stars listed in S04's Table 5, and large open circles identify the fiducial sequences that we have derived from the CMDs reported by MMJ93. [Note that the observed photometry was corrected by E(B−V) = 0.038 mag (Schlegel et al. 1998), and the E(V−I) values were calculated from E(V−I)/E(B−V) = 1.25 [1.0 + 0.06 (B−V)0 + 0.014 E(B−V)]; Dean et al. 1978.] The differences between the two are especially large for near‐TO stars (≈0.04 mag in V−I at a fixed B−V value).

Fig. 4.— Top: Color‐color diagram for M67, in which the small filled circles represent the data obtained by S04, after the application of reddening corrections, while the large open circles indicate the dereddened fiducial sequences determined in this study for the CMDs reported by Montgomery et al. (1993). The solid curve gives a 4.0 Gyr isochrone for [Fe/H] = -0.04, Y = 0.2768, and Fover = 0.07 (also plotted in Fig. 1b), with colors derived from the VC03 color‐Teff relations. The dashed curve gives a computed zero‐age main sequence (ZAMS) for the same chemical abundances. Bottom: Color‐color diagram for Landolt standards that been designated main‐sequence stars (large filled circles) and normal giants (crosses) by Smith et al. (2002). These stars are assumed to be unreddened. The solid and dashed curves represent the same models that have been plotted in the top panel.
The solid and dashed curves in Figure 4 respectively represent the isochrone that does the best job of reproducing the MMJ93 CMDs (see Fig. 1b and VC03) and the upper end of a computed zero‐age MS for [Fe/H] = -0.04. If the observations of M67 by S04 are more accurate than those by MMJ93, they would seem to add to the evidence from the Hyades that the V−I colors given by the VC03 transformations should be corrected to the blue by 0.02–0.03 mag. However, the bottom panel in Figure 4 indicates that the predicted color‐color diagram is consistent with that defined by the subset of Landolt (1992) standards that are believed to be MS stars (i.e., luminosity class V; large filled circles) according to Smith et al. (2002). (A very similar plot is obtained if all of the Landolt 1992 standards are considered.) That is, the isochrone (at least its MS segment) appears to be precisely on the Landolt system, which would imply that (1) the MMJ93 observations are similarly well calibrated, given that the latter are matched quite well by the models, and (2) S04's data are not on the standard system.
However, there is more to this than meets the eye. Both MMJ93 (see their Table 2) and S04 (see his Fig. 3) compared their magnitudes and colors with those derived by Joner & Taylor (1990) for the dipper asterism stars in M67, and it is disconcerting to find the mean δ(V−I) between the MMJ93 and Joner‐Taylor data sets is +0.019 mag, whereas S04 found a median difference of only −0.003 mag. M. D. Joner and B. J. Taylor have made a concerted effort over the years to produce very accurate and precise photoelectric photometry for small samples of stars in M67 and other open clusters. The fact that S04 reproduces their results to within a few millimagnitudes (but not MMJ93) would seem to suggest that the calibration of his data is more secure than that by MMJ93—and yet Figure 4 suggests that the reverse is true.
The CMD‐isochrone comparisons presented in Figure 5 provide some insight into what is going on. It is clear from the two top panels that there is little to choose between the (B−V, V) diagrams of M67 by MMJ93 and S04, as the 4 Gyr isochrone for [Fe/H] = -0.04 and Y = Y⊙ fits both CMDs comparably well. For these plots, it was assumed that E(B−V) = 0.038 and (m - M)V = 9.62. The CMD obtained by S04 is much better defined, in part because he did his best to remove binaries from his sample, but it is evident that the differences between the mean cluster loci are within δ(B−V)≈ ±0.01 mag over the entire range in V magnitude considered. Also shown in the top right‐hand panel is the fiducial sequence for NGC 188 from the Stetson et al. (2004) investigation. For this system, E(B−V) = 0.087 (Schlegel et al. 1998) and (m - M)V = 11.40 (see § 3) was adopted. Since NGC 188 is observed to have close to the same metallicity as M67, it is quite comforting to find that its lower MS provides a good match to that of M67 (from either the MMJ93 or S04 studies) when preferred estimates of the basic parameters of the two clusters are assumed.

Fig. 5.— Comparisons of the 4 Gyr isochrone for Fover = 0.07, Y = 0.2768, and Z = 0.0173 ([Fe/H] = -0.04) with both the BV and VI data for M67 by MMJ93 and S04, as indicated, and also to the VI observations by Richer et al. (1998; bottom right panel). The color transformations by VC03 were used to transpose the isochrones to the observational planes. The crosses represent the fiducial sequences for NGC 188 given by Stetson et al. (2004). The reddening and apparent distance modulus for M67 were taken to be E(B−V) = 0.038 and (m - M)V = 9.62, and we have adopted E(B−V) = 0.087 and (m - M)V = 11.40 for NGC 188. The relation between E(V−I) and E(B−V) given by Dean et al. (1978) was assumed.
Unfortunately, the same overall consistency is not found on the (V−I, V) plane. Because the MMJ93 observations were used in part to define the semiempirical color‐Teff relations recently published by VC03, it is no surprise that both their BV and VI data can be fitted comparably well by the same isochrone. This is essentially by design. What is especially revealing is the fact that the lower MS segment of this isochrone coincides with the lower MS of NGC 188 (see the middle panel in the bottom row) if (m - M)V = 11.40 (as in the upper right‐hand panel) and the relation between E(V−I) and E(B−V) given by Dean et al. (1978) is assumed. In fact, as shown in § 3, that isochrone that has the same TO magnitude as NGC 188 provides a very good match to the entire MS fiducial. Because Stetson et al. (2004) have taken great care to put their NGC 188 data on the Johnson/Cousins/Landolt system, it follows that the isochrones (and the MMJ93 CMDs) must also be on the standard system.
Further support for this conclusion is provided in the bottom right‐hand panel of Figure 5. This shows a fit of the same isochrone that appears in the other panels to independent VI observations by Richer et al. (1998). Their CMD clearly agrees quite well with that by MMJ93. In fact, their V−I colors are slightly redder than those by MMJ93 at a given V magnitude, which is in the opposite direction of the difference between the V−I colors derived by S04 and MMJ93. This adds to the evidence that the S04 observations (and also those by Joner & Taylor 1990) may not be as well placed on the Landolt system as the other data sets.
An additional argument in support of this inference can be made using the Hyades. The color‐color diagram given in Figure 6 plots the same Landolt class V standards considered in Figure 4 (large filled circles), along with a number of Hyades MS stars belonging to the de Bruijne et al. (2001) "high fidelity sample" of single Hyades members (small open circles). The B−V colors for the latter are as given by de Bruijne et al., while the V−I colors are from Taylor & Joner (1985). (Taylor & Joner do not report B−V colors, nor should the accuracy of the adopted B−V colors be a concern. VC03 were able to get a nearly perfect match of theoretical models for the spectroscopically observed metallicity and a helium abundance derived from the cluster binaries to both the BV and VR data for the Hyades on the assumption of the Hipparcos distance. It was only on the (V−I, V) plane that the models were offset from the cluster fiducial sequence [by about 0.02 mag, in the sense of being too red, which is similar to the discrepancy between S04's VI data and the best‐fitting isochrone to his BV observations].) Curiously, the Hyades stars bluer than B−V ≈ 0.55 lie above the Landolt standards. However, they do coincide quite well with the dashed curve, which represents the V−I versus B−V relation derived by Caldwell et al. (1993) from the photometric standardization of the Cousins system carried out at the South African Astronomical Observatory (SAAO).

Fig. 6.— Comparisons of the color‐color relation derived from the same Landolt class V standards (large filled circles) that were plotted in Fig. 4 with that defined by those Hyades MS stars (small open circles) in the de Bruijne et al. (2001) "high fidelity sample" for which V−I colors were available from Taylor & Joner (1985). All of the stars are assumed to be unreddened. The solid curve, which clearly matches the Landolt standard stars quite well, is the 650 Myr isochrone used by VC03 to fit the cluster CMDs. The dashed curve represents the color‐color relation given by Caldwell et al. (1993), based on their standardization of the Cousins system. (Although not shown, the upper MS observations of M67 by S04 are well matched by the dashed curve.)
It is difficult to know how Figure 6 should be interpreted. Is the difference between the dashed curve and the solid curve (which, by the way, indicates the location of the isochrone used by VC03 to fit the Hyades CMDs) really representative of the difference between Landolt and SAAO standards for bluer MS stars? Taylor & Joner (1996) studied the relationship between these photometric standards, and although they found it difficult to confirm that the various standard VRI systems in current use are consistent among themselves at better than ∼0.01 mag, differences larger than this appear to be precluded. If this is correct, then there must be other factors at play (e.g., the definition of the I‐filter bandpass). Alternatively, perhaps the correct locus through the Landolt standards, which do not define a particularly tight sequence, should be drawn through the stars with the bluest V−I colors at B−V values between 0.4 and 0.6.
In any case, taken at face value, Figure 6 does indicate that the Taylor & Joner (1985) observations define a somewhat different relation between V−I and B−V than that given by the Landolt standards. Hence, the difficulty that VC03 had in fitting the (V−I, V) CMD of the Hyades appears to be more of an observational problem than an indication of some deficiency with their color‐Teff relations. It should also be kept in mind that the sorts of study‐to‐study differences that we find here may simply be a reflection of the difficulty that individual observers have in transforming their instrumental magnitudes to their chosen standard system with a precision better than 0.01–0.02 mag (for some discussion of this, see Stetson et al. 2003, 2004). This level of uncertainty could well be an inescapable limit for testing theoretically predicted colors with the current generation of observed photometric indices.
Finally, one additional point needs to be made regarding Figure 4. Note, in particular, the location of the crosses in the bottom panel, which represent class III giants from the Smith et al. (2002) tabulation of Landolt standards. The fact that the giant branch segment of the isochrone lies along the upper boundary of the distribution of field giants suggests that there may be a small problem with either the predicted B−V or V−I colors for lower gravity stars. Obviously, the apparent good agreement between the isochrone and the M67 giant branch shown in the top panel would necessarily imply that the cluster photometry also suffers from the same problem (if one exists). In fact, as discussed in § 3, a plot of the giant branch fiducial for NGC 188 (from Stetson et al. 2004) on the same color‐color diagram shows better consistency with the location of the Landolt class III standards than either our isochrones or the MMJ93 photometry for M67. This good agreement is used in the next section as the basis for making small (≲0.02 mag) refinements to the VC03 (V−R)‐Teff and (V−I)‐Teff relations for lower gravity stars having [Fe/H] ≈ 0.0.
3. NGC 188
The reddening and metallicity of NGC 188 appear to be quite well determined. In this investigation, we have chosen to adopt E(B−V) = 0.087 mag, as derived from the Schlegel et al. (1998) dust maps. This agrees very well with the latest estimate of the reddening from the two‐color diagram by Sarajedini et al. (1999), who obtained 0.09 ± 0.02 mag. As far as the cluster metal abundance is concerned, most determinations during the past decade or so have tended to fall within the range −0.12≲[Fe/H]≲0.0 (e.g., Hobbs et al. 1990; Friel & Janes 1993; Friel et al. 2002; Randich et al. 2003), which is very similar to what has generally been found for M67. Consequently, the same grids of isochrones that were used to fit the M67 CMD are probably applicable to NGC 188 as well. By considering the same models, one can determine (1) which values of Y and Z result in the best matches of isochrones to the NGC 188 CMD, and (2) whether or not the inferred values of these chemical composition parameters are similar to those obtained for M67.
Figure 7 contains the answers to these questions. Each panel gives the result of performing a MS fit of those stars from the Stetson et al. (2004) study that are deemed to have ≥50% membership probabilities to isochrones for the indicated parameters. (In order to be able to distinguish the isochrones from the stellar data, only half of the cluster main‐sequence stars satisfying the adopted membership criterion have been plotted. To be more specific, the probable members were first sorted in magnitude, and then every second star in the resulting list was plotted. Moreover, to avoid too much clutter in each panel, only that isochrone that does the best job of reproducing the cluster subgiants is shown; this isochrone provides our best estimate of the age of NGC 188 in each of the cases considered.)

Fig. 7.— Comparisons of nonovershooting isochrones for the indicated values of Y, Z, [Fe/H], and age with the Stetson et al. (2004) CMD for NGC 188. In each case, E(B−V) = 0.087 (Schlegel et al. 1998) has been assumed, and the indicated (m−M)V value was derived from a main‐sequence fit of the observations to the part of the isochrone that is fainter than MV∼5. The color‐Teff relations given by VC03 were used to transpose the isochrones from the theoretical to the observed plane.
Recall from Figure 3 that the Y, Z values assumed in the panels along the diagonal running from the upper left to the lower right resulted in the best agreement between the isochrones and the M67 CMD (for ages ranging from 4.3 to 3.9 Gyr, respectively). Essentially the same result is found for NGC 188, although slightly larger Y values at a given Z seem to be favored, and the inferred ages are larger by 2.6–3.0 Gyr. (Very similar age differences were found by Sarajedini et al. 1999.) Interestingly, the variation in the morphology of the isochrones with Y and Z is such that if the metallicity of either cluster is less than Z = 0.015, it will not be possible to obtain a simultaneous match of both their MS and lower giant branch populations unless the assumed helium abundance is less than Y = 0.25. This seems rather unlikely, given that the primordial He abundance from the concordance between Wilkinson Microwave Anisotropy Probe (WMAP) observations (Spergel et al. 2003) and big bang nucleosynthesis calculations is very close to Y = 0.248 (Cyburt et al. 2003; Coc et al. 2004)—which in turn argues against a low metal abundance for either cluster.
To be sure, it would be risky to place too much reliance on such a conclusion, given that (as noted in § 2) many factors can affect the predicted age and metallicity dependence of the location of the giant branch relative to the TO and MS. On the other hand, both the model temperature scale and the adopted (B−V)‐Teff relations are fully consistent with the best available empirical constraints (see VC03), and the isochrones are able to reproduce the observed CMDs quite well on the assumption of [Fe/H] values that are in the middle of the ranges found from spectroscopy and helium abundances that are close to the solar helium content. Although the agreement is not perfect (e.g., the isochrones tend to lie redward of the mean locus through the brightest TO stars in NGC 188), small discrepancies could easily be due to the effects of binaries, problems with the color transformations, differences between the actual and assumed heavy‐element mixtures, etc. In view of such uncertainties, minor problems with the fits of isochrones to observed CMDs can hardly be avoided.
While Figure 7 contains several interesting results, our main motivation for studying NGC 188 is to find out whether our isochrones yield the same interpretation of its CMD, irrespective of whatever color is used. In fact, as illustrated in Figure 8, such consistency is not found. In this figure, the three plots in both the upper and lower rows correspond, in turn, to the cases presented in Figs. 7a, 7e, and 7i: the former involve V−R and V−I, respectively, whereas the latter are concerned with B−V colors. To get comparably good fits to the VR and VI photometry for the TO and MS stars as those found on the ([B−V]0, MV) diagram, it is necessary to apply small zero‐point shifts to the isochrone colors (as noted in the individual panels of Fig. 6). However, after such adjustments are made, the predicted giant branch segments are all appreciably bluer than the mean locus through the cluster giants, while in the case of the BV data, they either agree well with the observations or are slightly too red. For consistency, the differences between the isochrones and observations on the various color planes should be in the same sense and of a comparable size.

Fig. 8.— Representative fits of isochrones to VR and VI data for NGC 188 (from Stetson et al. 2004; the adopted color transformations are those by VC03). The panels in both rows, from left to right, correspond to the cases plotted in Figs. 5a, 5e, and 5i. Small zero‐point corrections were added to the predicted V−R and V−I colors, as noted, in order to obtain comparable agreement along the main‐sequence on all three color‐magnitude planes. Note that the observed giant branch is not consistently matched by the theoretical models: the latter are appreciably too blue on the ([V−R]0, MV) and ([V−I]0, MV) diagrams, but are in satisfactory agreement or slightly too red on the ([B−V]0, MV) diagrams.
As discussed by Stetson et al. (2004), small zero‐point differences (≲0.02 mag) are easily within calibration uncertainties and thus are not a serious concern. Indeed, some fairly compelling evidence presented in that investigation indicates that the V−R colors determined for the cluster stars are probably too red by about 0.02 mag. This was found from comparisons of the NGC 188 fiducial sequence with (1) Landolt standards on various color‐color diagrams, and (2) the CMDs for Gliese (1969) catalog stars having MV values from Hipparcos and BV(RI)C photometry from Bessell (1990). (If such an offset were applied to the V−R data, then essentially no zero‐point correction to the isochrone V−R colors would be necessary.) Importantly, in a systematic sense, the variations of B−V, V−R, and V−I colors with V magnitude along the lower MS of NGC 188 agreed very well with those indicated by the Gliese stars.
One way of reconciling the fits of the isochrones to the cluster observations in Figure 8 with their counterparts in Figure 7 is to adopt somewhat redder (V−I)‐Teff and (V−R)‐Teff relations for stars of lower gravity (log g≲4.0) than those by VC03. It is evident from the plots presented by VC03 (see their Figs. 8 and 15) that the color transformations advocated by Castelli (1999) have the desired behavior; i.e., they agree well with those adopted by VC03 at gravities appropriate to MS stars, but they become systematically redder as the gravity is reduced. The solid curve in Figure 9 represents the 6.8 Gyr isochrone for Y = 0.2774 and Z = 0.0173 (that plotted in Figs. 5e, 6b, and 6e) when the colors are derived from Castelli V−I and VC03 B−V transformations. The predicted color‐color diagram for the isochrone so obtained is clearly in good agreement with the same sample of Landolt standard stars considered in Figure 4 (the large filled circles and crosses represent class V and class III standards, respectively) and with the fiducial sequence for NGC 188 (small open circles). [The latter was dereddened assuming E(B−V) = 0.087 and the E(V−I)/E(B−V) relation given by Dean et al. 1978.]

Fig. 9.— Comparison of the color‐color relations defined by the same Landolt standards plotted in Figs. 4 and 6 for Population I main‐sequence stars (large filled circles) and normal giants (crosses), with the fiducial sequence for NGC 188 (small open circles) given by Stetson et al. (2004) and a 6.8 Gyr isochrone for [Fe/H] = -0.04 (solid curve). The giant branch segment of the isochrone was transformed to the observed plane using the color‐Teff relations reported by Castelli (1999). The dashed curve shows the predicted location of the giant branch if the color transformations derived by VC03 are employed instead. (The latter agree well with those by Castelli for main‐sequence stars.)
The same consistency was not found in our examination of the BVI photometry for M67 by MMJ93 (see Fig. 4). In this case, a representative isochrone produced a fine match to the color‐color diagram of M67 (when VC03 color‐Teff relations were used), but the predicted giant branch segments of the two loci were offset from the location of Landolt class III standards. The dashed curve in Figure 9 shows where the giant branch segment of the solid curve would be located if the V−I colors were derived from the VC03 transformations, instead of those by Castelli (1999). It is quite clear that the solid curve provides a superior fit to the data. This implies that (1) the Castelli (V−I)‐Teff relations are more realistic than those by VC03 (at least for [Fe/H] values close to solar), and (2) the MMJ93 V−I colors for giants in M67 are too blue by ∼0.02 mag. (Whereas the BV CMDs of M67 and NGC 188 appear to be consistent with one another, judging from the isochrone fits presented in Figs. 3 and 7, the same cannot be said for the cluster VI data. The comparisons that we have made of the cluster fiducials with the Landolt standards suggests that the problem must rest mainly with the M67 photometry.)
Figure 10 presents an analogous comparison of the different data sets on the V−R versus B−V diagram. [E(V−R)/E(B−V) = 0.59 was assumed; see Bessell et al. 1998.] Note that in order for the NGC 188 locus to overlie the same Landolt standards in the color range 0.6≲B−V≲0.9 as in the previous figure, it was necessary to subtract 0.018 mag from the fiducial V−R colors. (As discussed by Stetson et al. 2004, the zero‐point of the cluster R‐band photometry appears to be slightly too bright.) Here, too, it was necessary to adopt the Castelli (1999) V−R transformations instead of those published by VC03 in order to obtain the good agreement of the isochrone with the cluster sequence and the Landolt standards that is evident in this figure.

Fig. 10.— Same as in the previous figure, except that V−R and B−V colors are plotted. Note that 0.018 mag was subtracted from the V−R colors of the cluster fiducial points tabulated by Stetson et al. (2004) prior to being plotted. With such an adjustment, the level of agreement between the NGC 188 fiducial and the Landolt standards becomes comparable to that shown in the previous figure.
Thus, one of the main conclusions reached in this investigation is that the Castelli (1999) transformations to V−R and V−I (for [Fe/H] ≈ 0.0) appear to be preferred over those by VC03. [As shown by Sekiguchi & Fukugita 2000 and VC03, the Castelli (B−V)‐Teff relations are not consistent with empirical constraints.] If we then adopt her color‐temperature relations and repeat the comparisons between theory and observations given in Figure 8, we obtain the results shown in Figure 11. The quality of the isochrone fits to the observed data is now much improved, and importantly, they are now much more consistent with those on the [(B−V)0, MV] plane (see Fig. 7). That is, consistent explanations of the data on the three color planes can been achieved by using VC03's transformations to B−V, coupled with those by Castelli for V−R and V−I. We believe that our analysis has given us an improved understanding of the color‐temperature relations appropriate to stars having near‐solar abundances of the heavy elements.

Fig. 11.— Same as in Fig. 8, except that Castelli (1999) color‐temperature relations have been used to transpose the isochrones to the observed planes. With this choice and the adoption of the (B−V)‐Teff relations by VC03, the isochrones now provide consistent interpretations of the BV, VR, and VI observations of NGC 188.
For the reasons discussed above, the zero‐point offset of 0.018 mag that was applied to the isochrones shown in Figures 11a–11c should probably be applied the NGC 188 observations instead. It is not clear whether the corrections to the predicted V−I colors in Figs. 11d–11f are due to a small problem with the color‐Teff relations or with the photometric zero point.
4. CONCLUSIONS
The two most important results of this investigation are the following. First, when using the parameterized Roxburgh criterion described in § 1 to treat convective core overshooting, the value of the parameter Fover that should be assumed in computing nondiffusive stellar models for ≈1.3 M⊙ near‐solar metallicity stars is ≈0.07. With this choice, isochrones are able to provide a good match to the CMD of M67 in the vicinity of the turnoff (and elsewhere). Second, the color‐color relations defined by Landolt standards in both the main‐sequence and giant phases offer considerable support for the VandenBerg & Clem (2003) (B−V)‐Teff relations, together with the Castelli (1999) transformations to V−R and V−I. If these color‐temperature relations are adopted, then stellar models having a well‐constrained Teff scale provide consistent (and quite good) fits to the various CMDs that can be constructed from the BVRI photometry for NGC 188 by Stetson et al. (2004), and they are able to reproduce the Landolt color‐color diagrams very well.
In carrying out our analyses of the M67 and NGC 188 CMDs, we explored only a small range in [Fe/H] (from −0.12 to +0.01, which nevertheless encompasses most spectroscopic determinations for these open clusters) in addition to a modest range in helium abundance (0.25≤Y≤0.30). Depending on the assumed chemistry, the derived ages of M67 and NGC 188 varied from 3.6 to 4.6 Gyr (see Fig. 3) and from 5.9 to 8.1 Gyr (see Fig. 7), respectively. Our best estimates of their ages, from stellar models that do not take diffusive processes into account, are 4.0 and 6.8 Gyr (treating such processes will lead to a reduction in these age estimates by 5%–7%; see Michaud et al. 2004). The resulting age determinations should be accurate to within ±10%, even if some allowance is made for the effects of reddening and calibration uncertainties.
The comparisons of isochrones with the M67 CMD presented in Figure 3 also showed that the value of Fover that is assumed in the models has to be a fairly small number, irrespective of the assumed chemical abundances. This indicates that core overshooting is much less important in the turnoff stars of M67 than in those of NGC 6819 (Rosvick & VandenBerg 1998) and NGC 7789 (Gim et al. 1998). Thus, based on the studies carried out to date, we have learned that Fover increases from a value near zero in ≈1.3 M⊙ stars to about 0.5 in ≈1.55 M⊙ stars, and the indications are that Fover remains fairly constant thereafter. (Many more constraints on the mass dependence of this parameter will be reported in a forthcoming study by P. D. Dowler & D. A. VandenBerg 2004, in preparation).
Finally, although we have argued from the Landolt standards and the NGC 188 photometry by Stetson et al. (2004) that Castelli (1999) transformations to V−R and V−I (for giant stars) are more realistic than those by VandenBerg & Clem (2003), the reliability of this result is difficult to assess. This is mainly because the (B−V)‐(V−I) diagram for giants in M67, based on CCD photometry either by Montgomery et al. (1993) or Richer et al. (1998), disagrees with that for giants in NGC 188 (Stetson et al.) at the level of 0.02–0.03 mag in V−I at a given B−V value (or vice versa). The Stetson et al. fiducial is definitely in better agreement with the mean locus for the Landolt standards, but the latter are relatively few in number, and they do not themselves define a tight sequence. Further work needs to be undertaken to understand the small discrepancies between the M67 and NGC 188 color‐color diagrams. Further study of a similar (≈0.02 mag) offset between the (B−V)‐(V−I) relation for main‐sequence stars derived from Landolt standards and that for Hyades main‐sequence stars would also be worthwhile.
We thank an anonymous referee for thoughtful remarks that have led to a much expanded discussion in § 2.2. Helpful discussions with John Stauffer and James Clem are also gratefully acknowledged. We are particularly grateful to Pat Dowler for providing the overshooting subroutine that he wrote as part of his M.Sc. thesis several years ago. This work was supported in part by a Discovery Grant to D. A. V. from the Natural Sciences and Engineering Research Council of Canada.
Footnotes
-
1
Diffusive processes (gravitational settling and radiative accelerations) are not considered in this investigation. Michaud et al. (2004) have already shown that models that treat these processes are able to match the CMD of M67 exceedingly well without the need for any convective core overshooting at all (provided that M67 has the same metallicity as the Sun). However, diffusion causes only a small increase in the sizes of convective cores; consequently, overshooting must still be invoked to explain the CMDs of younger systems. Although one would like to use stellar models that allow for both diffusion and convective overshooting in comparisons with observations, the treatment of diffusive processes is computationally very demanding. For instance, up to now, G. Michaud and his colleagues (still the only ones who treat settling and radiative accelerations in a fully self‐consistent way) have been able to produce no more than a few grids for a small range in mass, chemical abundances, and evolutionary state. Core overshooting has not yet been implemented in their models. Because it will likely be several years before extensive diffusive grids with overshooting are available, most stellar population studies have little recourse in the meantime but to make use of nondiffusive calculations in which the extent of convective overshooting has been carefully calibrated. This investigation is part of a loosely connected series of studies to carry out such a calibration, and in fact, we are able to obtain fits of isochrones to the M67 and NGC 188 CMDs as fine as those reported by Michaud et al. The main difference is that diffusion causes a ∼6% reduction in the predicted age at a given turnoff luminosity (at [Fe/H] ≈ 0.0). From the perspective of fitting isochrones to observed CMDs, the neglect of diffusive processes is less of a concern than the neglect of core overshooting. However, if one is trying to understand chemical abundance data, it is obviously very important to take into account all processes that can affect chemical abundance profiles, including diffusion.
-
2
In addition to reporting new observations, this investigation reanalyzed most of the existing photometric data for NGC 188—from the early photoelectric and photographic studies by Sandage (1962) and Eggen & Sandage (1969) to the recent CCD surveys by Sarajedini et al. (1999) and Platais et al. (2003)—and placed all of the data on a consistent footing.