


ABSTRACT
We present high-resolution 4.6 μm CO spectra of the circumstellar environments of two red supergiants (RSGs) that are potential supernova (SN) progenitors: Betelgeuse and VY Canis Majoris (VY CMa). Around Betelgeuse, 12CO emission within ±3'' (±12 km s−1) follows a mildly clumpy but otherwise spherical shell, smaller than its ∼55'' shell in K i λ7699. In stark contrast, 4.6 μm CO emission around VY CMa is coincident with bright K i in its clumpy asymmetric reflection nebula, within ±5'' (±40 km s−1) of the star. Our CO data reveal redshifted features not seen in K i spectra of VY CMa, indicating a more isotropic distribution of gas punctuated by randomly distributed asymmetric clumps. The relative CO and K i distribution in Betelgeuse arises from ionization effects within a steady wind, whereas in VY CMa, K i is emitted from skins of CO cloudlets resulting from episodic mass ejections 500–1000 yr ago. In both cases, CO and K i trace potential pre-SN circumstellar matter: we conclude that an extreme RSG like VY CMa might produce a Type IIn event like SN 1988Z if it were to explode in its current state, but Betelgeuse will not. VY CMa demonstrates that luminous blue variables are not necessarily the only progenitors of SNe IIn, but it underscores the requirement that SNe IIn suffer enhanced episodic mass loss shortly before exploding.
Export citation and abstract BibTeX RIS
1. INTRODUCTION
Massive stars shed copious mass before exploding as supernovae (SNe) with a wide diversity of observable properties. Stars in the initial mass range 20–40 M☉ are key, because their complex post-main-sequence evolution is dictated to a large extent by their poorly understood mass loss. They represent a transitional range of mass below which stars die in a normal red supergiant (RSG) phase, and above which they skip the RSG phase altogether and become luminous blue variables (LBVs) instead. In between, stars may traverse the HR diagram through a cool RSG phase with strong mass loss, but they can potentially evolve back to warmer temperatures through a variety of hypergiant phases to a Wolf-Rayet (WR) phase if mass loss is sufficient to remove the H envelope. Depending on when they explode along this mass-loss sequence, stars in this initial mass range can appear as SNe of Types II-P, II-L, IIb, or Ib/c—or if the immediate pre-SN mass loss is severe, they could potentially be Type IIn with relatively narrow H emission lines (see Filippenko 1997 for a review of SN types). Here we investigate under which conditions this is likely.
The amount and specific nature of this RSG mass loss can dictate the subsequent evolution of the star, especially its chemical mixing, mass stripping, and angular momentum loss. At the present time, however, the driving of RSG winds is poorly understood and mass-loss rates are not calculable from ab initio theory, so stellar evolution models must adopt mass-loss rates guided by observations. These are usually time-averaged mass-loss rates, but  may vary prodigiously during RSG evolution. Empirical studies are critical to constrain physical parameters of the mass loss, in order to decipher how observed SN types map to initial mass. This may be critical for phases just before explosion.
Like their more massive siblings the classical LBVs (Smith & Owocki 2006; Humphreys & Davidson 1994), stars of initial mass 20–40 M☉ can display relatively sudden, episodic bursts of mass loss in their post-main-sequence evolution. This can happen as RSGs, as yellow hypergiants (de Jager 1998; de Jager & Nieuwenhuijzen 1997), or in a post-RSG LBV phase (Smith et al. 2004). As is the case with LBV eruptions, this episodic mass loss is not accounted for in current models of stellar evolution, but it may nevertheless significantly alter a star's evolution (Smith & Owocki 2006). Besides LBVs, examples of episodic mass loss are the outbursts of variable yellow hypergiants like ρ Cas and Var A in M 33 (Lobel et al. 2003; Humphreys et al. 2006; de Jager 1998; de Jager & Nieuwenhuijzen 1997), and the nebulae of stars like VY Canis Majoris (VY CMa; Smith et al. 2001; Smith 2004; Decin et al. 2006; Humphreys et al. 2005, 2007). If the dense circumstellar material (CSM) from these outbursts still surrounds the star when it explodes, it would provide a dense obstacle for the SN blast wave to overtake.
This brings us back to the likely progenitors of Type IIn SNe. Judging by their dense CSM resulting from episodic mass ejection, LBVs are likely to appear as SNe IIn if they explode within ≲103 yr after a major outburst (Smith et al. 2007, 2008; Gal-Yam et al. 2007). This defies current stellar evolution models, however, which predict that at solar metallicity, stars massive enough to make LBVs should end their lives as WR stars after shedding their H envelopes (e.g., Heger et al. 2003; Meynet et al. 1994; Maeder & Meynet 1994; Woosley et al. 1993). Possible exceptions are the lower-luminosity LBVs that are post-RSGs (Smith et al. 2004).
Because mass-loss rates in steady line-driven winds are inadequate to shed the star's H envelope, Smith & Owocki (2006) have argued that the mass deficit must be shed in LBV eruptions, or if not, that the star will explode as an LBV with much of its H envelope intact (see also Smith 2007; Smith et al. 2007, 2008; Gal-Yam et al. 2007). As emphasized elsewhere (Smith 2008; Smith et al. 2007), continually mounting observational evidence suggests that LBVs or LBV-like stars may explode (Smith & Owocki 2006; Smith et al. 2007, 2008; Gal-Yam et al. 2007; Vink et al. 2008; Kotak & Vink 2006). The recent Type IIn events SN 2006gy and 2006tf were spectacular examples of this phenomenon (Smith et al. 2007, 2008). Gal-Yam et al. (2007) identified an LBV-like progenitor of an SN IIn, and postulated that essentially all SNe IIn mark the explosions of LBVs.
There are other less contentious candidates for SNe IIn progenitors, however, which remain to be considered in detail. The essential requirement for a Type IIn progenitor, as emphasized by Smith et al. (2008), is extreme mass loss with H-rich material shortly before explosion. The most likely alternatives to LBVs, all with dense CSM, are: the most extreme RSGs like VY CMa (Smith et al. 2001), yellow hypergiants like IRC+10420 (Humphreys et al. 1997, 2002; Davies et al. 2007), or B[e] supergiants (Zickgraf et al. 1996).
In this paper, we examine the dense circumstellar environment of VY CMa as it compares to that of a more standard RSG like Betelgeuse. We have chosen to use the low-excitation fundamental vibration-rotation band-head lines of the R-branch of 12CO at ∼4.6 μm as a tracer of the densest gas in the CSM. We selected three lines: 12CO 1–0 R1 46493.11 Å, 1–0 R2 at 46412.42 Å, and 1–0 R3 at 46332.76 Å (vacuum wavelengths). These lines were first detected in the spectrum of Betelgeuse by Bernat et al. (1979), who modeled them as scattered lines, and the detection of related CO lines in VY CMa was reported by Geballe et al. (1973). In both cases, CO was seen in absorption in the spectrum of the central star. Following a preliminary study of the 4.6 μm CO lines in emission in Betelgeuse (Ryde et al. 1999), we report a detailed study of spatially extended emission in the IR vibration-rotation lines around these stars. Spatially extended emission probes the CSM kinematics directly.
Both Betelgeuse and VY CMa also exhibit spatially resolved K i λ7699 emission in their nebulae, the details of which will be reviewed later. The CO lines we investigate here have several advantages over K i and other probes of the CSM. The interpretation of scattered atomic resonance lines like K i and Na i is complicated by subtle changes in the ionization state, atoms can be depleted by grain formation to an uncertain degree, and at visual wavelengths these lines can be strongly affected by extinction within dusty envelopes. Observing CO at longer infrared (IR) wavelengths mitigates these difficulties. Also, long-slit spectra at IR wavelengths with array detectors allow higher spatial resolution than is usually applied in molecular observations at mm wavelengths (e.g., Muller et al. 2007).
We present our new CO observations in Section 2. In Sections 3 and 4, for Betelgeuse and VY CMa respectively, we give some background of related previous observational work, and we discuss how the observed CO structure samples their CSM environments, particularly with regard to the K i emission. In Section 5, we summarize our results and speculate about the consequences if these objects explode as core-collapse SNe in their current states.
2. OBSERVATIONS
High-resolution (R≃75,000; ∼4 km s−1) IR spectra of α Ori and VY CMa were obtained on 2005 February 27 and 28, and 2006 December 1, respectively. The spectral range was centered on the 4.6 μm fundamental vibration-rotation band-head emission of CO, using the Phoenix spectrograph (Hinkle et al. 1998) on the Gemini South telescope. Phoenix has a 256 × 1024 InSb detector with a pixel scale of 0 085 × 1.8 km s−1 at a wavelength of ∼4.6 μm. Sky conditions were photometric, and the near-IR seeing was typically 05. Removal of airglow lines and thermal sky emission was accomplished by subtracting an observation of an off-source sky position far from the star immediately after each set of targeted observations.
HR 1713 (β Ori) and HR 2618 were observed with Phoenix on the same nights with the same grating settings in order to correct for telluric absorption and for flux calibration of the spectra of Betelgeuse and VY CMa, respectively. Absolute flux-calibration uncertainties are dominated by the alignment of the standard stars in the slit, and may be as high as ±25%, although relative uncertainties in the flux from one slit position to the next are much less. Telluric lines were used for wavelength calibration, using the telluric spectrum available from Hinkle et al. (1995). For both targets, intrinsic CO emission is redshifted out of the telluric CO absorption features. Velocities were calculated adopting a vacuum rest wavelength of 46412.42 Å for 12CO 1–0 R2. These velocities were then corrected to a heliocentric reference frame, with the uncertainty of ±1 km s−1 dominated by scatter in the dispersion solution for telluric lines.
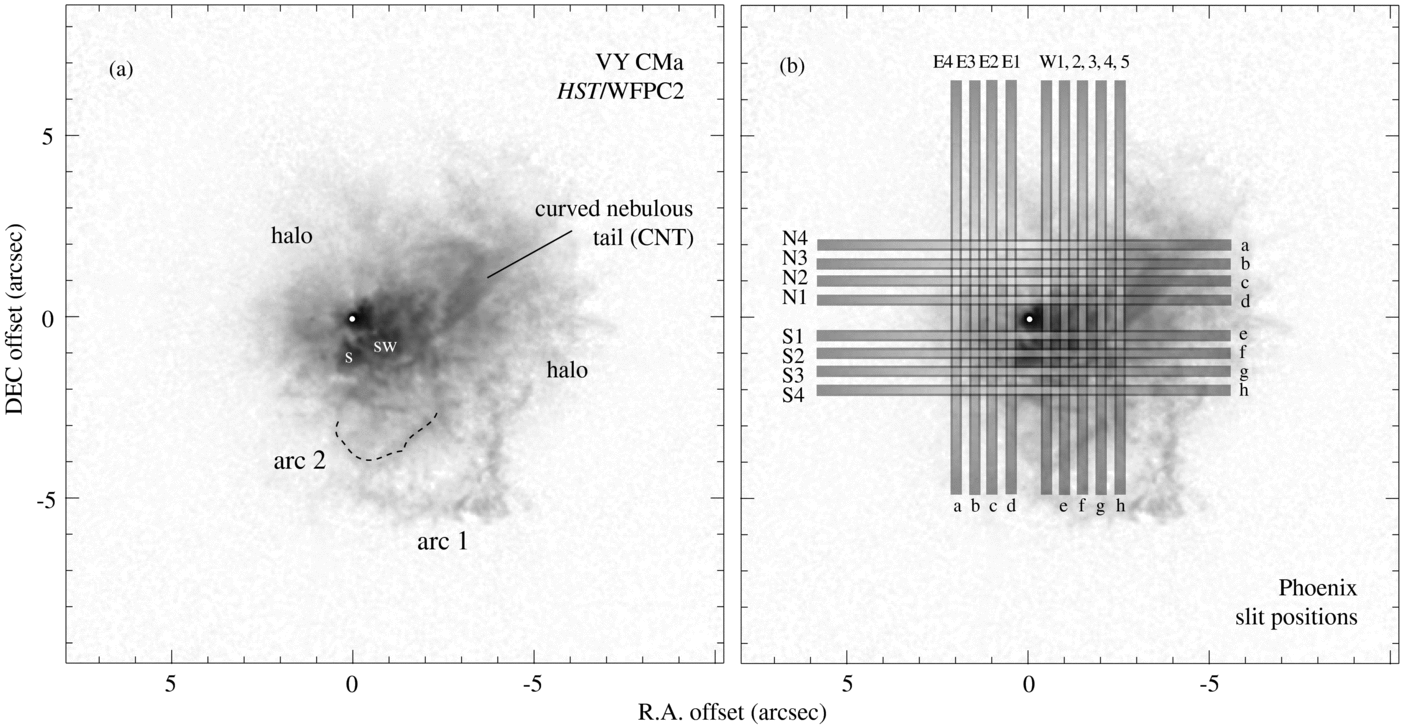
We used a 017 wide (2 pixel) long-slit aperture, except for the on-star spectrum of Betelgeuse for which we employed a Lyot Hartman mask to avoid saturation. For each source, the Phoenix slit was oriented at two different perpendicular position angles running north–south and east–west. To sample the kinematics across each nebula, the slit was positioned on the bright central star, plus several offsets stepped in increments of 05 in either direction perpendicular to the slit axis (Table 1). In order to show correspondence with features in the nebulosity, Figure 1 shows slit positions on a mid-IR image of Betelgeuse (Hinz et al. 1998), and Figure 2 shows slit positions on a visual-wavelength image of VY CMa (Smith et al. 2001) obtained with the Hubble Space Telescope (HST).

Figure 1. Mid-IR image of Betelgeuse with the placements of our eight individual Phoenix slit positions marked. The image is a 10 μm nulling interferometer image from Hinz et al. (1998; with permission), where north is rotated slightly left of vertical in their original image. Because of the technique used, this image emphasizes extended nebular dust emission, rather than photospheric emission. The lower-case letters for each slit position correspond to the individual panels in Figure 4.
Download figure:
Standard image High-resolution image
Figure 2. (a) Visual-wavelength image of VY CMa made with HST/WFPC2 (from Smith et al. 2001) with the same labels for features in the nebula given by Smith (2004). (b) Phoenix slit aperture positions superposed on the same image of the nebula. Slit placements are in increments of 05, beginning at 05 from the star in all four directions. The letters for each slit position correspond to the individual panels in Figures 8 and 9 (W1, positioned 05 west of the star, is not shown in any panel in Figure 8 because of saturation).
Download figure:
Standard image High-resolution imageTable 1. Phoenix Observation Log
| Date | Target | P.A. | Exp. Time | Offsets |
|---|---|---|---|---|
| 2005 Feb 28 | Betelgeuse | 0° | 30 s | Star (Lyot Hartman mask) |
| 2005 Feb 28 | Betelgeuse | 0° | 120 s | 10 E, 05 E, 05 W, 10 W |
| 2005 Feb 28 | Betelgeuse | 90° | 120 s | 10 N, 05 N, 05 S, 10 S |
| 2006 Dec 1 | VY CMa | 0° | 4 s | Star |
| 2006 Dec 1 | VY CMa | 0° | 120 s | 20 E, 15 E,10 E, 05 E, 05 W, 10 W, 15 W, 20 W, 25 W |
| 2006 Dec 1 | VY CMa | 90° | 120 s | 20 N, 15 N,10 N, 05 N, 05 S, 10 S, 15 S, 20 S |
Download table as: ASCIITypeset image
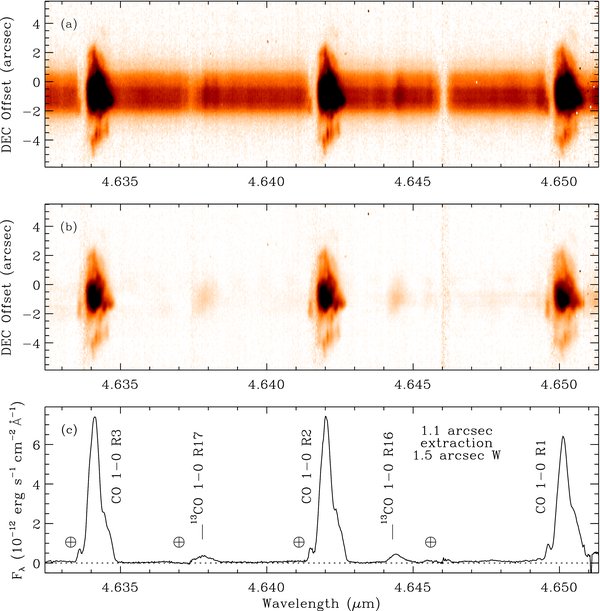
Because we aim to detect faint line emission near a bright star, our data reduction employed additional steps beyond standard spectral reduction in order to enhance the visibility of extended CO emission. After standard long-slit spectral reduction, we had a series of flux-calibrated two-dimensional spectra. An example of a single offset position for Betelgeuse is shown in Figure 3(a). This spectrum is dominated by the bright emission from the central star, including instrumental and atmospheric scattering of the direct stellar light, plus starlight scattered by circumstellar dust. CO emission lines can be seen in this spectrum, but are overwhelmed by starlight and are difficult to distinguish amid the complex spectrum of the star. We subtracted out the direct and scattered photospheric light with a model for each individual slit position by taking the directly observed one-dimensional spectrum of the central star, wherein circumstellar CO emission is negligible compared to the bright photosphere, and scaling it along each spatial pixel with a spatial sample of the intensity in a region of the spectrum free from CO band-head emission. The result of this subtraction is shown in Figures 3(b), and a one-dimensional tracing of the star-subtracted spectrum is shown in Figure 3(c). Figure 4 shows position–velocity plots of the star-subtracted 1–0 R2 line for all observed slit positions. Some positions close to the star were affected by saturation. We also show spectral and spatial tracings in Figures 5 and 6, respectively, and these will be discussed later.

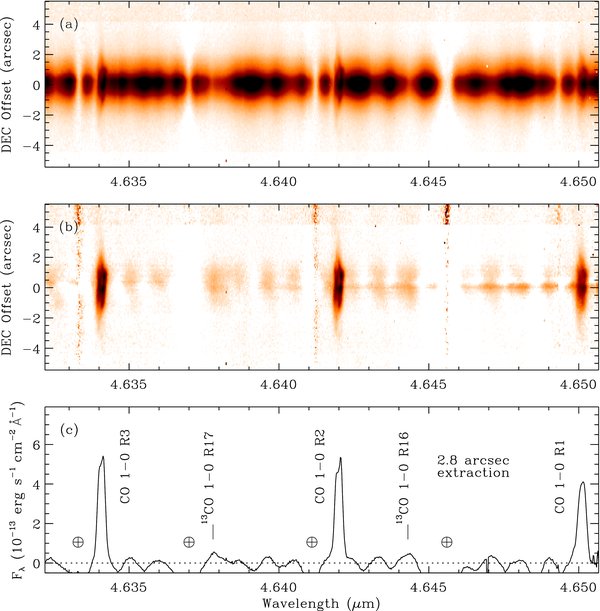
Figure 3. Phoenix spectra of Betelgeuse at one example slit position 1'' west of the star, demonstrating the typical appearance of the spectra over the full wavelength range. The top panel (a) shows the original two-dimensional long-slit spectrum. The middle panel (b) is the same as the top, but with the scattered starlight subtracted out by scaling the central star's spectrum to the spatial profile of scattered light at each pixel along the slit, leaving only intrinsic CO emission. The bottom panel (c) is a one-dimensional extraction of the bright inner part of the two-dimensional star-subtracted spectrum in panel (b) using a 28 × 017 extraction aperture. Places where strong telluric features left severe subtraction residuals are marked. Possible detections of 13CO 1–0 R17 and R16 are also marked.
Download figure:
Standard image High-resolution image
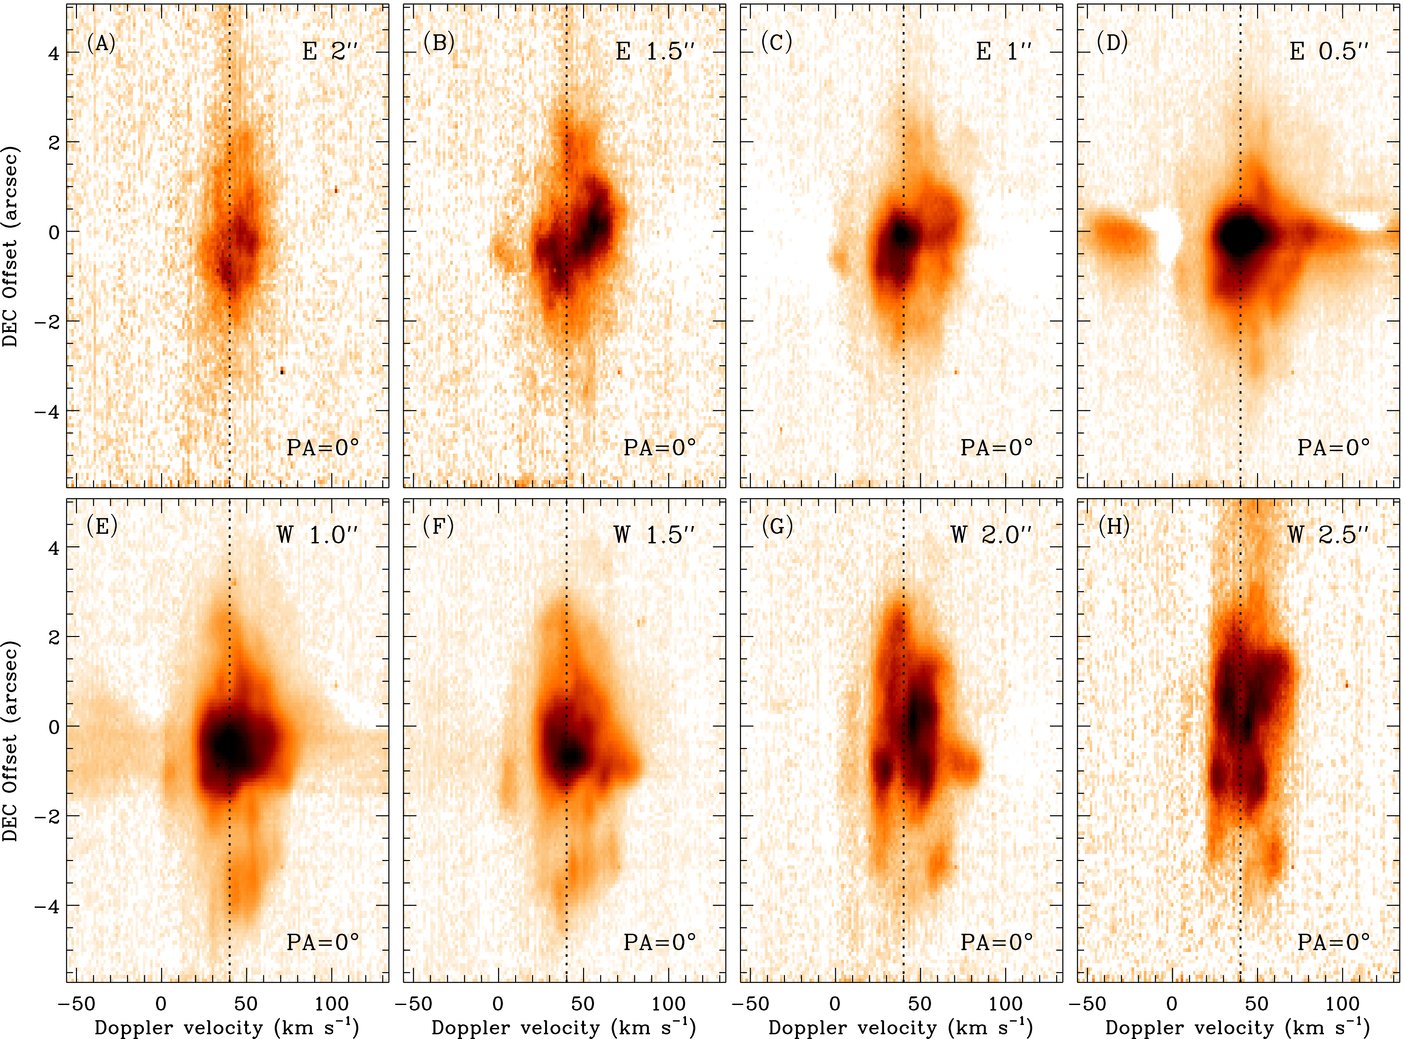
Figure 4. Spatial-kinematic structure of extended CO 1–0 R2 emission around Betelgeuse at several different Phoenix slit positions, taken from a section of star-subtracted spectra as in Figure 3(b). Slit position angles and offset positions from the star are indicated in each panel. Velocities are plotted as the heliocentric Doppler velocity, and the systemic velocity of +21 km s−1 is marked.
Download figure:
Standard image High-resolution image
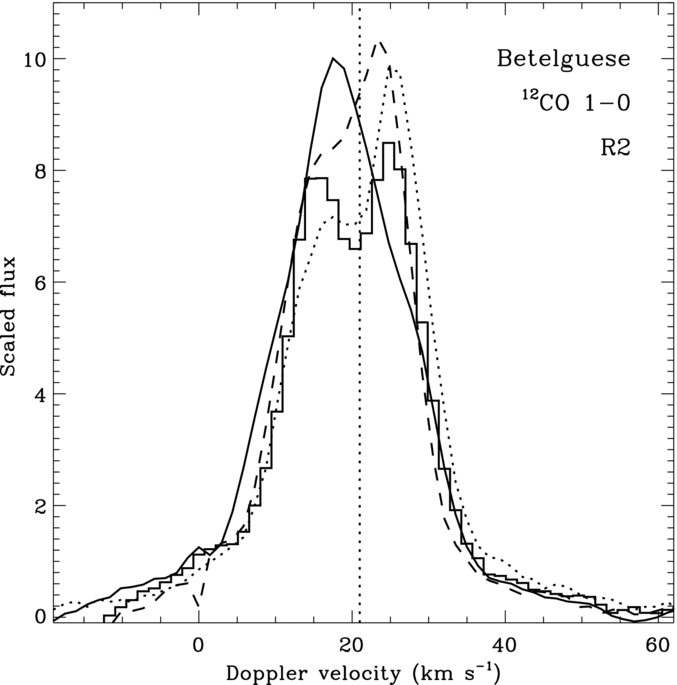
Figure 5. Spectral tracings of the 12CO 1–0 R2 emission line profile in the shell of Betelgeuse at a few representative positions: N 05 (solid), W 1'' (dotted), W 1'' N 05 (histogram), and W 1'' N 1'' (dashed).
Download figure:
Standard image High-resolution image
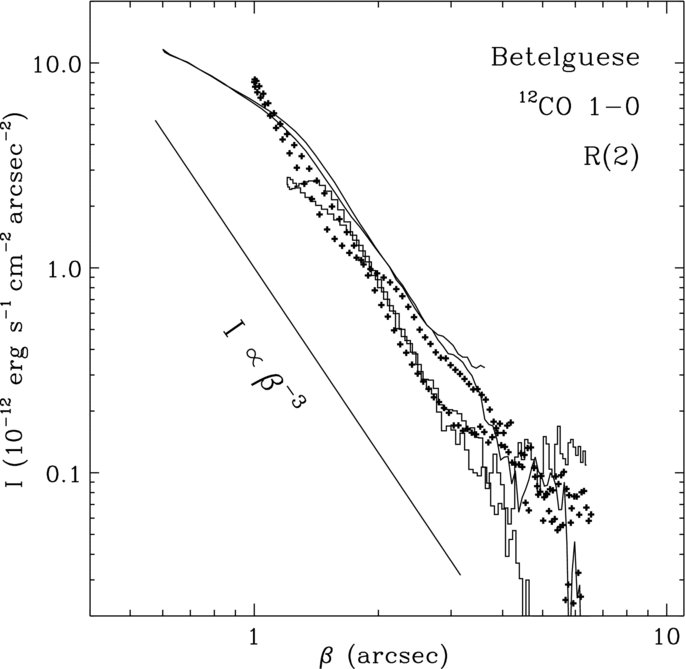
Figure 6. Plots of the line surface brightness for 12CO 1–0 R2 as a function of separation from the star β for Betelgeuse. The CO emission was summed over velocities of ±15 km s−1 compared to the systemic velocity, and intensity as a function of position along the slit was transformed to intensity as a function of separation from the star, taking into account the slit offset. Data for three example slit positions are shown: W 05 (solid line), W 10 (histogram), and S 10 (plus signs). Also, intensity proportional to β−3 is shown for comparison.
Download figure:
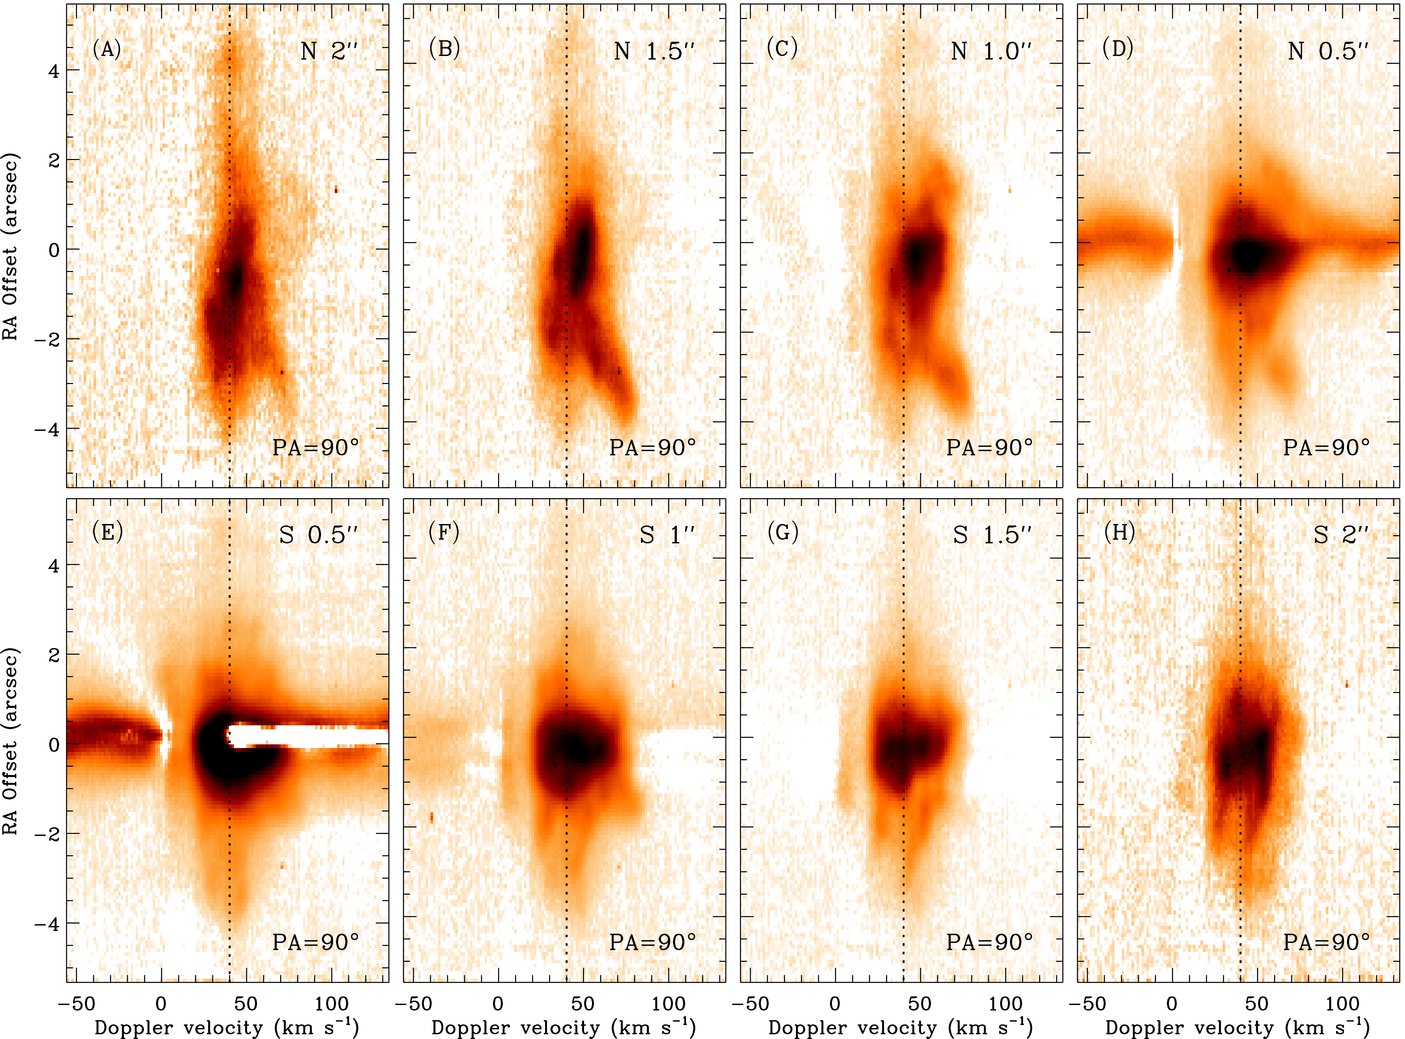
Standard image High-resolution imageWe performed the same type of scattered-light subtraction procedure for our VY CMa data, even though the CO emission is clearly seen even in the raw spectra. Examples of the two-dimensional spectra before and after subtracting scattered starlight are shown in Figures 7(a) and (b), respectively, and an example of one-dimensional tracing is shown in Figure 7(c). As for Betelgeuse, we produced a series of two-dimensional position–velocity plots of the star-subtracted 1–0 R2 line of CO for all slit offset positions. These are displayed in Figure 8 for the observations at P.A. = 0° offset to the east and west of the star, and in Figure 9 for P.A. = 90° offset north and south of the star's position. Spectral tracings of selected positions are plotted in Figure 10 and radial spatial intensity tracings are plotted in Figure 11.

Figure 7. Same as Figure 3 but for VY CMa, with the slit at P.A. = 0° positioned 15 west of the star. This is an example of one of several slit positions. In addition to the 12CO 1–0 lines, the 1–0 R17 and R16 transitions of 13CO are also clearly detected in these spectra, marked in the bottom panel.
Download figure:
Standard image High-resolution image
Figure 8. Same as Figure 4 but for VY CMa, for slits offset to the east and west of the star (see Figure 2) with the slit along P.A.=0°. Slit offset positions from the star are indicated in each panel. The systemic velocity of +40 km s−1 (from Smith 2004) is shown.
Download figure:
Standard image High-resolution image
Figure 9. Same as Figure 8, for slits offset to the north and south of the star (see Figure 2) with the slit along P.A.=90°. Slit offset positions from the star are indicated in each panel. Up is toward the east.
Download figure:
Standard image High-resolution image
Figure 10. Same as Figure 5, but for VY CMa. Example tracings of the CO line profile for 2'' south (amid the bubble outlined by "arc 2" in Figure 2), a bright clump 1'' south ("S" in Figure 2), a position in the "curved nebulous tail" (2'' west and 1'' north), a position 15 north of the star that is inconspicuous in visual images, and in the bright ejecta 1'' west of the star. VY CMa's systemic velocity of +40 km s−1 is shown with a dotted line. The blue wings of all profiles are truncated by self-absorption.
Download figure:
Standard image High-resolution image
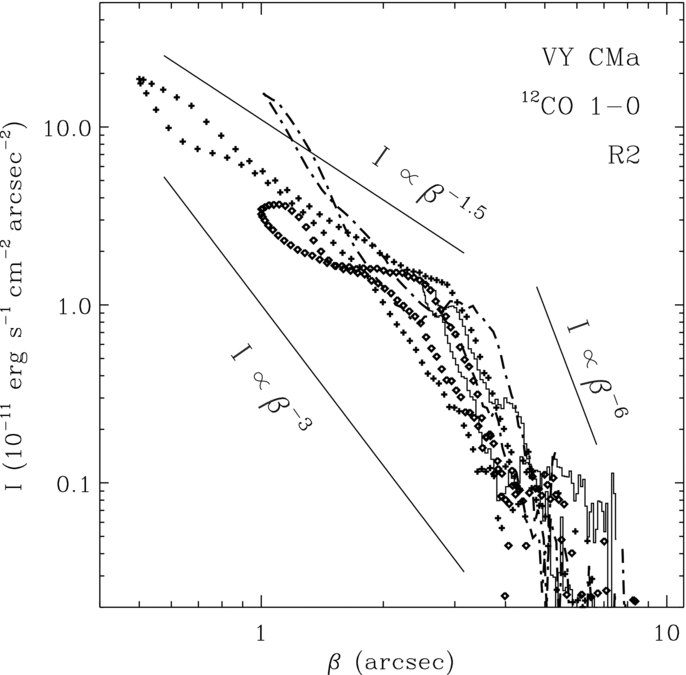
Figure 11. Same as Figure 6, but for VY CMa. The CO emission was summed over velocities of ±40 km s−1 from the systemic velocity. Data for four example slit positions are shown: W 10 (dot-dash), W 25 (histogram), N 05 (plus signs), and N 10 (diamonds). For comparison, intensity profiles proportional to β−3, β−1.5, and β−6 are shown.
Download figure:
Standard image High-resolution image3. BETELGEUSE, BETELGEUSE, BETELGEUSE
3.1. Background of Previous Observations
As the nearest and one of the brightest RSGs, Betelgeuse (α Ori, M1–M2 Ia-Iab; Keenan & McNeil 1989) is a prototypical object for studying RSG mass loss. Recent measurements suggest a distance of 197 ± 45 pc (Harper et al. 2008; see also Huggins 1987) that we shall adopt here, although this is larger than (but consistent with) the recently revised Hipparcos distance of 152 ± 20 pc (van Leeuwen 2007). A detailed and up-to-date discussion of the distance to Betelgeuse is given by Harper et al. (2008).
Because it is so nearby (and so cool and large), Betelgeuse has afforded astronomers the opportunity to spatially resolve stellar and atmospheric structure. Indeed, Betelgeuse was the first star to be spatially resolved interferometrically by Michelson & Pease (1921), with a diameter of about 44 mas. More recent imaging and interferometric techniques reveal that the apparent diameter of Betelgeuse is about 57 mas (Bester et al. 1996), corresponding to a radius of 5.6 AU or 1200 R☉. Because of variability, an average Teff for Betelgeuse is ∼3300 K (Harper et al. 2001).4 At a distance of 152–197 pc, the star's luminosity is roughly 0.9–1.5 × 10⁵ L☉, implying an initial mass of 15–20 M☉.
The size measured in the mid-IR by Bester et al. (1996) is about 10% larger than optical measurements (Wilson et al. 1992), due to either stronger limb darkening at shorter wavelengths or effects of molecular material above the photosphere (see Perrin et al. 2007). Several imaging and spectroscopic studies have suggested large-scale nonuniform "bright spots" on the star's surface (Buscher et al. 1990; Wilson et al. 1992; Josselin et al. 2007; Gray 2001, 2008), reminiscent of suggestions made by Schwarzschild (1975) that large RSGs may have only a few convective granulation cells with sizes comparable to the stellar radius. The chromospheric emission from Betelgeuse has been imaged in the UV with HST (Gilliland & Dupree 1996; Uitenbroek et al. 1998), suggesting that it is roughly two times larger in the UV than at visual wavelengths with interesting departures from spherical symmetry. High spatial resolution spectroscopy with HST shows asymmetric and time-variable infall and outflow across the star's disk (Lobel & Dupree 2001). Radio and Hα observations have also resolved structure within a few stellar radii (Hebden et al. 1986; Skinner et al. 1997; Lim et al. 1998).
The resolved structures most relevant to our 4.6 μm CO spectra are more extended mid-IR features imaged at 10–20 μm associated with warm dust within ∼5'' of the star (Hinz et al. 1998; Rinehart et al. 1998). These studies reveal mild asymmetries in the dusty circumstellar environment. The 10 μm nulling interferometer image from Hinz et al. (1998) is reproduced in Figure 1. This extended dust traces the same spatial region over which we detect extended 4.6 μm CO emission.
In addition to these small-scale structures that have been studied at high spatial resolution, Betelgeuse also exhibits extended detectable structure in its large-scale CSM. This is due to its mass-loss rate of  (e.g., Harper & Brown 2006; Harper et al. 2001; Glassgold & Huggins 1986). One of the most remarkable probes of this extended CSM is resonant-scattered atomic emission, such as K i λ7699 (Bernat & Lambert 1976; Bernat et al. 1978; Honeycutt et al. 1980; Mauron et al. 1984; Mauron 1990; Plez & Lambert 2002) and Na i D (Mauron & Querci 1990; Mauron 1990; Mauron & Guilain 1995). The recent study of K i λ7699 by Plez & Lambert (2002) has been the most instructive, revealing multiple thin shells of emission out to radii ∼55'' from the star. Although these data reveal local inhomogeneities associated with clumps and thin shells, they are consistent with basically spherical expansion of 10–15 km s−1 out to large radii. With vexp≃15 km s−1, emission within ∼55'' or 104 AU traces material ejected by the star in the past few thousand years. Betelgeuse's wind apparently collides with the surrounding interstellar medium at much larger projected radii ∼5' from the star (Noriega-Crespo et al. 1997; Ueta et al. 2003).
3.2. Results from the CO Spectra
Our 4.6 μm spectra of Betelgeuse reveal extended resonantly scattered CO emission about 05–3'' from the star (see the details of 1–0 R2 emission in Figure 4). This corresponds to separations from the star of roughly 100–600 AU, adopting a distance of 197 pc (Harper et al. 2008).5
From the same lines seen in absorption in the central star's spectrum, Bernat et al. (1979) identified two shells, called S1 and S2, with outflow speeds of 11 and 18 km s−1, respectively. Their true spatial extent has not been determined since then. We associate the brightest 4.6 μm CO emission that we detect out to ∼2'' from the star with the slower S1 shell. Fainter emission from the faster S2 shell may be present at larger radii, but the association of the CO emission with two separate and distinct shells is not clear from our data.
Our Phoenix spectra reveal extended CO emission at velocities ranging from +5 to +35 km s−1 (Figures 4 and 5), although most slit positions have emission associated primarily with slower gas (the S1 shell). The CO emission centroid is at a heliocentric velocity of +21(±1.5) km s−1 (the dashed line in Figure 4), or VLSR=+5(±1) km s−1. These values are roughly consistent with those given by Wilson (1953) measuring the star's photosphere, and with the centroids of CO emission at VLSR = +3.7 km s−1 (Kemper et al. 2003; Huggins 1987) or C i emission at +3.0(±1.3) km s−1 (Huggins et al. 1994).
From one slit position to the next, however, the peak and centroid can shift to positive or negative velocities by ±5 km s−1, and the profile shape can change. Some positions (i.e. Figures 4(a), (b), (g), and (h)) reveal clear departures from the intensity distribution one expects in a simple spherically divergent steady wind. Examples of extracted one-dimensional tracings of the line profiles for a few positions are shown in Figure 5. This spatial variation in CO emission profiles cautions that properties of the outflow deduced from absorption along our sight line, like the two discrete S1 and S2 shells, may not be representative of the global wind.
First, at several positions the peak CO emission has a net blueshift of −2 km s−1 up to −5 km s−1 compared to the systemic velocity. Second, at several positions we detect double- or multiple-peaked emission profiles with central reversals (Figures 4(h) and 5). Such profile shapes evoke properties associated with thin shells, arcs, and discrete clumps rather than a smooth and steady wind with ρ ∝ R−2. The total variations in intensity associated with these features, however, are typically quite small compared to the total emission—on the order of only ∼20% of the total flux.
Structures seen when the P.A. = 0° slit was positioned 1'' west of the star (Figure 4(h)) showed the most successful subtraction of stellar light, and reveal particularly intriguing structure worthy of follow-up observations. One can discern several loops or arcs: one with a distinct central paucity of CO emission centered roughly at the systemic velocity and with its spatial center offset ∼05 north of the star (and 1'' west), as well as two more distant loop structures that also appear to have central cavities but appear to have a net blueshift of roughly −5 km s−1.
From the spatial sampling of our data, however, it seems premature to describe these structures as organized, large-scale departures from spherical symmetry or discrete ejection events, although that surely remains possible. The data seem equally consistent with mild density enhancements of factors as much as ∼20% at certain positions, signifying a large-scale but mild and random clumping of the wind on size scales near our limiting spatial resolution of ∼50 AU. Future studies with better spatial sampling, perhaps with an integral field unit or Fabry–Perot instrument, might be able to clarify the structures seen here.
Overall, however, all CO emission features fall within a velocity range of ±15 km s−1 of the assumed systemic velocity of +21 km s−1 (heliocentric), consistent with the notion that the CO structures correspond to mild density enhancements in a globally spherical and nearly steady wind. Ignoring local intensity peaks, the overall intensity distribution falls roughly as β−3, where β is the projected separation from the star (or impact parameter). This is demonstrated in Figure 6, where we have taken intensity tracings along a few slit positions and translated those positions along the slit to values of β using β = (x2+y2)0.5, where x is the slit pointing offset, and y is the position along the slit for each pixel.
An intensity fall-off proportional to β−3 is the value one expects for a slice through an optically thin and steady wind with ρ ∝ R−2. From 1'' to about 35 from the star, the radial intensity distribution clearly follows β−3. Exterior to that point, the data are too noisy to provide useful constraints, but there does appear to be a drop in intensity inside of 1''. This may be due to higher optical depth, higher excitation levels, molecule formation/survival rates, or other properties.
With the observed absolute fluxes we can calculate the mass-loss rate from an analytic wind model, in which we assume a spherically symmetric and homogeneous wind with a constant mass-loss rate, a constant expansion velocity (both constant over a few hundred years), and an optically thin wind in the CO lines along the line of sight. The ratio of the wavelength-integrated, line-scattered intensity, ICO,i (erg s−1 cm−2 arcsec−2), and the line-scattering flux  (erg s−1 cm−2 cm−1) as seen by the scattering molecules averaged across the line width but measured at the distance d is

where fu←l = 6.1 × 10⁻⁶ (Kirby-Docken & Liu 1978) is the absorption oscillator strength of the CO R2 line, and  CO = 2.6 × 10⁻⁵ (Huggins et al. 1994) is the fractional abundance of CO molecules relative to H, i.e., N(CO)/N(H). We assume this to be constant throughout the envelope and that most oxygen is locked-up as CO molecules. Ni(CO) denotes the number density of CO molecules in the lower state, i,6 of the transition. As a mean, we assume that 30% of the CO molecules are excited to the J = 2 level, Ni(CO)/N(CO)≃0.3 (Ryde et al. 1999). Furthermore, μ is the mean molecular weight which we estimate to be 1.2, d = 197 pc is the distance to Betelgeuse, vexp = 13.6 km s−1 is the terminal expansion wind velocity, and β is the angular distance from the star on the sky in seconds of arc. The equation agrees well with the observed β−3 power dependence of the scattered intensity as a function of the impact parameter on the sky, β (see Figure 6). We see directly that the mass-loss rate is linear with the scattered intensity and expansion velocity by rewriting Equation (1) such that

where vexp is given in km s−1, d in pc, β in seconds of arc, ICO,i in erg s−1 cm−2 arcsec−2, and  in erg s−1 cm−2 μm−1. Thus, the mass-loss rate deduced from the measured intensity at 2'' away from the star can be written as

From Figure 6 we see that ICO(β=2'') = 1.0(±0.2) × 10−12 erg s−1 cm−2 arcsec−2, while Justtanont et al. (1999) measure a total 4.6 μm flux from Betelgeuse of  . We then get roughly 1.2 × 10⁻⁶ M☉ yr−1, with a likely uncertainty in this absolute value of a factor of 2 in either direction, given the number of different potential sources of error (real variations in ICO and calibration errors in ICO due to slit placement, uncertainty and time variability of
  , uncertainty in Ni(CO)/N(CO), etc). Despite these, this independent estimate of the mass-loss rate is not far from the value of 2–4 × 10⁻⁶ M☉ yr−1 given by Harper et al. (2001); it is about half the lower bound, but the two values are consistent given our likely uncertainties. We would expect a much larger discrepancy if our assumptions about the optically thin emission or other factors were systematically wrong.
CO emission lines in a steady homogeneous wind of Betelgeuse should be optically thin in the line of sight beyond

where  is in units of M☉ yr−1 and ve is in km s−1 (see Ryde et al. 1999, 2000). With
  , N(CO)/N(H) = 2.6 × 10⁻⁵ (Huggins et al. 1994), and vexp = 13.6 km s−1 (Loup et al. 1993), the impact parameter is pτ = 1 = 1.6–3.2× 1015 cm, which corresponds to 045–14 at a distance of 197 ± 45 pc. A radiative transfer model is needed for a more detailed interpretation (G. Harper et al. 2009, in preparation).
Thus, aside from density fluctuations of ±20%, the CO spectra of Betelgeuse are consistent with a basically spherical, optically thin wind with a steady mass-loss rate over the past few hundred years. VY CMa presents a quite different picture, as we discuss next.
4. RESULTS AND DISCUSSION FOR VY CMA
4.1. Background of Previous Observations
Like Betelgeuse, VY CMa (M2.5–M5e Ia; e.g., Wallerstein 1958) is bright and has been a favorite target of astronomers interested in RSG mass loss. We adopt a distance of 1.5 kpc (Herbig 1972; Marvel 1997), although there is still some disagreement in the literature regarding the distance to VY CMa. For example, Choi et al. (2008) give an estimate of 1.14 kpc.
VY CMa is distinguished from Betelgeuse in that it is intrinsically more luminous and has a much higher mass-loss rate. At 1.5 kpc, the integrated IR luminosity from 0.4 to 25 μm is 4.1 × 10⁵ L☉ or MBol=−9.3 mag (Smith et al. 2001), which is a minimum luminosity for the system because some optical luminosity may escape in directions away from our line of sight and may not be absorbed and re-radiated by dust. This suggests an initial mass of roughly 35 M☉ (Smith et al. 2001). (If the distance is as low as 1.14 kpc (Choi et al. 2008), then the implied initial mass would be ∼25 M☉.) VY CMa's current mass-loss rate has been estimated as 2–4 × 10⁻⁴ M☉ yr−1 (Danchi et al. 1994), about 102 times higher than Betelgeuse, although the star may have had an even higher mass-loss rate of ∼10−3 M☉ yr−1 during episodes in its recent history (Smith et al. 2001). VY CMa also has a faster wind speed of 30–40 km s−1 (e.g., Reid & Dickenson 1976; Reid & Muhleman 1978; Zuckerman & Dyck 1986), compared to ∼15 km s−1 for Betelgeuse. The slower speeds of Betelgeuse are more typical of RSGs.
Based on atmospheric models for the observed visual spectrum at spectral type M2.5 Ia, Massey et al. (2006) have recently suggested that VY CMa's effective temperature is around 3650 K, higher than previous claims.7 With the luminosity above, this implies a stellar radius roughly 30%–40% larger than that of Betelgeuse. Massey et al. (2006) pointed out that cooler temperature estimates in the literature would violate hydrostatic stability posed by the Hayashi limit. Yet, the observed variations from M2.5 to later spectral types and cooler temperatures are observed, so one could hypothesize that violating the Hayashi limit of hydrostatic and convective stability—at least for limited periods in VY CMa's variability cycle—might cause periods of enhanced episodic mass loss, spewing material toward random directions (Smith et al. 2001; Smith 2004; Humphreys et al. 2005, 2007). Thus, temporary violations of the Hayashi limit may be a clue to VY CMa's instability and mass loss. We will return to this later.
VY CMa is unusual among RSGs in that it displays a prominent asymmetric red reflection nebula ∼10'' in size, which has been known for almost a century (Perrine 1923) and can be seen even in small telescopes. Visual-wavelength imaging with HST revealed complex structure in the nebula, with many clumps and arc structures that do not adhere to any spherical symmetry or axisymmetry (Smith et al. 2001). HST imaging also revealed that the central star is highly obscured because its position moves with wavelength: blue/near-UV images see primarily reflected light, while red and near-IR wavelengths begin to penetrate the dust as the central point source shifts to the northeast (Smith et al. 2001; Kastner & Weintraub 1998). Color maps of the reflection nebula reveal a large-scale extinction gradient such that sight lines through the nebula northeast of the star tend to suffer considerably more reddening and extinction (Smith et al. 2001). This circumstellar dust absorbs most of the star's photospheric luminosity, re-radiating that energy at near- to mid-IR wavelengths. VY CMa's spectral energy distribution (SED) has been studied extensively at IR wavelengths, revealing a strong but apparently temporally variable IR excess, plus a variable 9.7 μm silicate feature (Gehrz et al. 1970; Gillet et al. 1970; Herbig 1970; Merrill & Stein 1976a, 1976b; Danchi et al. 1994; Le Sidaner & Le Bertre 1996; Monnier et al. 1998, 2000; Smith et al. 2001).
VY CMa is also an extended object in the IR. Near-IR images of the nebula presented by Monnier et al. (1999) showed remarkable structure very close to the obscured star (see also Monnier et al. 2004), some of which is hidden in visual HST images. Earlier near-IR images suggested that the central object was resolved and nonspherical on subarcsecond scales (Wittkowski et al. 1998; Bensammar et al. 1985), while fainter extended near-IR emission has also been detected out to ∼5'' from the star (Monnier et al. 1999; Smith et al. 2001). The central object appears elongated along an east/west axis at mid-IR wavelengths (Lipscy et al. 2005; Smith et al. 2001), which is different from the extension at shorter near-IR wavelengths where a "bubble" appears to extend 01–02 south from the central source (Monnier et al. 2004). All this suggests time-variable and direction-dependent ejection of material by the central star. Yet, there are some hints of a persistent north–south or northeast–southwest axis of symmetry (Monnier et al. 1999, 2004; Smith et al. 2001).
VY CMa is also a famous resolved OH, H2O, and SiO maser source (Wilson & Barrett 1968; Eliasson & Bartlett 1969; Snyder & Buhl 1975; Van Blerkom & Auer 1976; Rosen et al. 1978; Benson & Mutel 1979, 1982; Deguchi et al. 1983; Bowers et al. 1983, 1993; Marvel 1997; Zheng et al. 1998; Richards et al. 1998; Shinnaga et al. 2004). The results of these numerous studies are too complex and varied to review in detail here, but they paint a picture of a structured molecular outflow within ∼1000 AU of the star expanding at 30–40 km s−1. Maser motions also provide indications of possible axial symmetry, as we discuss below.
4.2. K i and CO Emission
Extended K i λ7699 emission has been seen in a number of other RSGs besides Betelgeuse, such as α Her and Mira (Mauron & Caux 1992; Gustafsson et al. 1997). However, VY CMa is the only Galactic RSG in which bright K i emission lines appear in the spectrum of the star itself. This was noted long ago by Wallerstein (1958), and the unusually strong K i emission lines—plus numerous other extremely unusual emission lines such as TiO, ScO, Ti i, Cr i, Rb i, Ba ii, etc—have been studied previously (Joy 1942; Wallerstein 1958, 1986; Hyland et al. 1969; Wallerstein & Gonzalez 2001).
The spatially extended nature of the K i emission around VY CMa was first noted by Smith (2004), who found that the resonant-scattered emission followed the spatial distribution of the visual reflection nebula, and could be used to trace its kinematics. Smith (2004) found that the kinematics gave strong evidence for asymmetric and episodic mass loss due to localized eruptions on the stellar surface through discrete ejection events in the past ∼1000 yr. Similar long-slit spectra of K i emission were presented subsequently by Humphreys et al. (2005), who confirmed these results and also emphasized the evidence for discrete ejection events from the kinematics of individual nebular features. More recently, these K i Doppler kinematics were combined with HST measurements of proper motions and polarization to disentangle the three-dimensional orientation of specific features and to estimate their true (deprojected) velocities and ages (Humphreys et al. 2007; Jones et al. 2007). These results underscored the importance of individual ejection events over the past 100–1000 yr, with no clear indication of axial symmetry.
This evidence for asymmetry seems to contradict several studies mentioned earlier. Molecular and maser studies at longer wavelengths generally point toward some degree of bipolar or toroidal symmetry in the nebula (Muller et al. 2007; Shinnaga et al. 2004; Richards et al. 1998; Bowers et al. 1983; Deguchi et al. 1983; Benson & Mutel 1982, 1979; Rosen et al. 1978), as well as the IR SED interpreted as a thick disk by Herbig (1970), the resolved IR structures near the star (Monnier et al. 1999, 2004), and the a large-scale extinction gradient across the nebula increasing from southwest to northeast (Smith et al. 2001). The kinematics of 4.6 μm CO emission we present below underscore the prevalence of episodic mass ejections in random directions inferred from K i Doppler shifts, visual continuum proper motions, and visual polarization. However, our CO kinematics also add new information, because at 4.6 μm, the CO emitting clumps suffer less line-of-sight extinction and are therefore less biased toward detecting features on the near side of the nebula. This turns out to be important, as we show next.
4.3. Results from the CO Spectra
Our new 4.6 μm spectra of the nebula of VY CMa reveal the kinematics and spatial distribution of CO gas with the highest combination of spatial and spectral resolution yet, and they are the first detection of extended emission in the IR vibration-rotation lines of CO. Figures 8 and 9 show detailed position–velocity plots of CO 1–0 R2 emission at radii ranging from 05 to 5'' from the star. In terms of spatial and spectral resolution, our study improves significantly upon recent efforts to discern the spatio-kinematic structure of VY CMa's molecular envelope, especially in CO, using mm wavelength observations (e.g., Muller et al. 2007).
Examining the long-slit spectra in Figures 8 and 9 leads to several qualitative comments regarding the observed structure (Figure 2(a) gives names of specific features):
-
1.The most important result is that in these 4.6 μm data, the nebula appears more symmetric than it does in optical and near-IR images (Monnier et al. 1999; Smith et al. 2001) or K i spectra (Smith 2004; Humphreys et al. 2005). Individual CO knots are distributed asymmetrically with no clear signs of axial or point symmetry (i.e. any individual condensation is not mirrored by a companion on the opposite side of the star), but the global distribution of CO condensations and diffuse emission is more isotropic, following the general trend of increasing isotropy with increasing wavelength (Smith et al. 2001). The CO emission is still brighter toward the S and W of the star, but the asymmetry is not nearly as severe as at visual wavelengths. We detect more redshifted emission than previous K i studies, as well as relatively brighter emission to the north and east of the star.
-
2.All slit positions show pervasive blueshifted P Cygni absorption at +15 km s−1 (heliocentric), indicating a relatively smooth and isotropic outflow at −25 km s−1 with respect to the star. This causes all line profile tracings to have a blunt edge on the blueshifted side. This absorption is intrinsic to the source—it is different from the atmospheric CO absorption at 0 to −10 km s−1 (heliocentric). This outflow speed of 25 km s−1 is slower than the usually adopted value of 30–40 km s−1 indicated by masers and the motions of dense condensations in CO (this work) and K i (Smith 2004).
-
3.There is some asymmetry in the character of the CO emission distribution. Namely, CO emission tends to be concentrated in more isolated clumps to the south and southwest of the star, and the structure seems smoother toward the east and north. This is especially apparent as one moves progressively from east to west in panels (a)–(h) in Figure 8.
-
4.The feature in images known as the curved nebulous tail (CNT) has CO emission that is predominantly redshifted, and shows Hubble-like flow with steadily increasing Doppler shift with separation from the star. Maximum Doppler shifts of +40 km s−1 with respect to the star (+80 km s−1 heliocentric) are attained at offsets 4'' west and a few arcseconds north. Like the Hubble flow seen in K i from arc 1 (Smith 2004), this is a clear indication that the structure formed as the result of an asymmetric and episodic mass ejection from the star. In CO spectra, the CNT is the most distinct feature in the nebula. Spectral tracings of line profiles for various nebular features in Figure 10 show that the CNT stands out as unique compared to other clumps in the nebula.
-
5.At positions several arcseconds south and 1–2'' west of the star, with north/south-oriented slits running through the large bubble known as "arc 1," little blueshifted CO emission is seen. This is in stark contrast to the kinematics seen in K i, where one sees a blueshifted Hubble-like flow increasing in speed to −30 km s−1 with respect to the systemic velocity (Smith 2004). This is one of the most prominent features in visual images of the nebula, and it appears to be absent in CO data. Our spectra missed the limb of arc 1, so perhaps the CO emission is concentrated at its edge, but the CO distribution must be different from that of K i, which fills the bubble's interior (Smith 2004).
-
6.In general, we find that reddened features (those with a high F1042M to F410M flux ratio in HST images; Figure 9(b) in Smith et al. 2001) have redshifted Doppler velocities. This includes diffuse emission northwest of the star, arc 2, clump southwest, and the CNT.
-
7.There is surprising redshifted CO structure located 1–2'' east and north of the star (examine Figures 8(e) and (f) with the slits oriented north/south, as well as Figure 9(d) with the slit oriented east/west), which is not seen in K i data (Smith 2004): Namely, on the back side of the nebula, dense clumps of CO-emitting material appear to be piling-up in a redshifted "ridge" of emission. This corresponds to the region of highest average reddening in the nebula, and may be related to a feature designated as arc 3 in visual HST images (see Smith et al. 2001). This feature is difficult to see even with HST because it is faint and reddened, and nearly overwhelmed by the glare of the central star. It is interesting to speculate that this putative "pile-up" on the E and back side of the nebula may be related to a density gradient in VY CMa's interstellar environment, since the molecular cloud L1667 is located a few arcminutes to the east of VY CMa.
Altogether, spectral intensity tracings of CO emission around VY CMa (Figure 10) reveal an environment that is quantitatively different from that of Betelgeuse (Figure 5). CO emission profiles around Betelgeuse show centrally peaked and nearly Gaussian profiles at all slices through the shell, with only minor fluctuations due to clumping at the 10%–20% level.
VY CMa, in contrast, has huge variation from one position to the next (Figure 10), including: (1) wide but centrally concentrated profiles in the dense environment close to the star (1'' west and 1'' south), (2) narrower and irregular multiple-peaked CO profiles (15 north and 2'' south), and (3) strong emission peaks offset far from the systemic velocity by up to 40 km s−1, as in the CNT. These are not the profiles one expects for slices through a steady wind, suggesting that the vast majority of 4.6 μm CO emission arises in the densest cloudlets rather than from material associated with an underlying homogeneous wind.
Similarly, spatial intensity tracings of VY CMa's CO emission are inconsistent with a steady optically thin wind. As noted above in the discussion of Betelgeuse, one expects the apparent intensity to vary as β−3 (where β is the projected angular separation from the star) for slices through a steady wind with density falling as R−2. Betelgeuse follows this trend (Figure 6), but VY CMa does not. Spatial intensity tracings of VY CMa are shown in Figure 11. Instead of I ∝ β−3, VY CMa shows a much shallower intensity drop out to ∼3'' from the star, and then a much steeper profile closer to I ∝ β−6 from 3'' to 5'' separations. Beyond 5'' the profile may return to I ∝ β−3, but the data become noisy.
The observed intensity variations with projected radius indicate strong variations in the mass-loss rate during VY CMa's recent history. This assumes optically thin 12CO emission, which we demonstrate in the following section by a comparison between 12CO and 13CO line profiles. The observed deviation of CO intensity from the normal β−3 profile in Figure 11 could, in principle, be caused by systematic changes in outflow velocity with a steady mass-loss rate. We find this unlikely, however. The enhanced emission at β≃3'' from the star, indicating higher densities than in a steady wind at the same projected radius, would require outflow speeds that are a factor of 5–10 slower than the normal wind, representing a systematic deceleration of VY CMa's wind to well below its escape velocity. This possibility is ruled out by the observed kinematics in our CO spectra, which show no trend of slow gas concentrated at these large radii. In fact, we see some indications of the opposite trend, with higher speeds at large radii. This therefore requires a surge of mass loss in VY CMa's recent past.
Assuming outflow at 35 km s−1, the steep I ∝ β−6 profile from 3 to 5'' implicates a sharp rise in the mass-loss rate ∼1000 yr ago that peaked about 600 yr ago, and gradually returned to its present state thereafter. To explain the observed change in CO emission intensity, the increase would have needed to be a factor of 5–10 above its current average mass-loss rate of 2–4 × 10⁻⁴ M☉ yr−1 (Danchi et al. 1994). This implies an average mass-loss rate 600–1000 yr ago of roughly 2 × 10⁻³ M☉ yr−1. This is in line with a previous estimate from bright dust condensations seen in the reflection nebula (Smith et al. 2001), indicating that the CO and reflecting dust trace the same dense condensations, and that these cloudlets contain most of the emitting mass in the nebula. Our conclusion of variable mass loss in the past is also in general agreement with recent results from theoretical modeling of unresolved mm-wavelength CO line profiles by Decin et al. (2006), who required a strong increase in the mass-loss rate about 1000 yr ago, with lower  before and after, in order to explain the multiple-peaked line profile shapes in VY CMa.
Our 4.6 μm CO spectra, however, spatially resolve individual features resulting from the enhanced mass loss, showing that it was not simply an increase in the spherical time-averaged wind  of the star, but rather, that the enhanced mass loss consisted of numerous discrete ejections from the star's surface. While 4.6 μm CO spectra reveal that the distribution of ejecta is nearly isotropic—or at least far less asymmetric than implied by visual-wavelength images suffering from extinction—we stress that the ejection of any individual condensation corresponding to an episodic event is highly asymmetric. Thus, the physics behind this type of mass ejection and the increased average mass-loss rate of VY CMa 600–1000 yr ago is likely connected to pulsational, convective, or magnetohydrodynamical activity in the outer layers of the star, rather than the physics of steady wind driving in the outer atmosphere. In this context, where VY CMa apparently suffers temporary episodes of increased mass loss and increased instability, its proximity to (and its possible violation of) the Hayashi limit for convective stability is perhaps not so surprising. In fact, increased instability and mass loss is the likely way a star would respond to being pushed past the Hayashi limit in order to re-establish equilibrium. The possible link between discrete mass ejection events and individual giant convection cells is intriguing.
4.4. 13CO in VY CMa
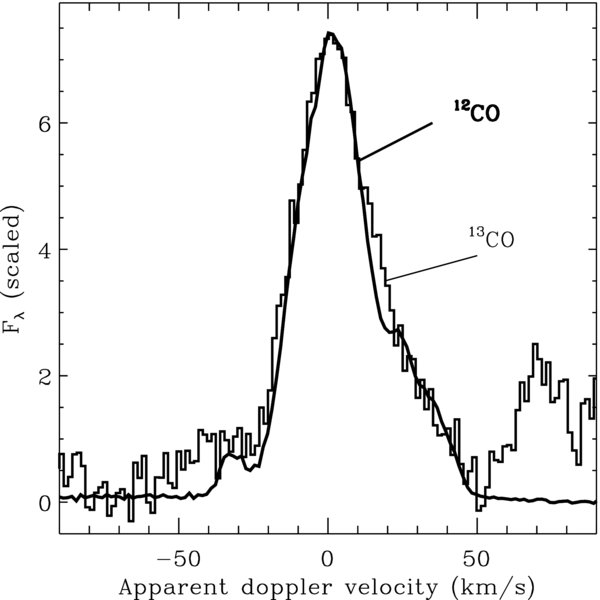
Our spectroscopy of VY CMa's nebula also provides clear detections of faint lines of 13CO emission (see Figure 7(c)). Comparing 12CO 1–0 R2 to the 13CO 1–0 R16 line yields a measured 12CO/13CO intensity ratio of roughly 16.4. Converting this observed intensity ratio to an intrinsic 12C/13C isotopic ratio requires a detailed model of the gas excitation temperature and observations of additional lines. However, we can place rough constraints on VY CMa's isotopic ratio by comparison to Betelgeuse, which has a well-established 12C/13C isotopic ratio of ∼7, and for which we observe an intensity ratio of no less than 19.0 for 12CO 1–0 R2 to 13CO 1–0 R16 from the spectrum in Figure 3. Assuming that the CO excitation temperatures in VY CMa and Betelgeuse are not wildly discrepant, this then implies that VY CMa has an intrinsic 12C/13C isotopic ratio of ≲6. This is far below the solar-system ratio of ∼90, showing that significant quantities of nuclear-processed material containing 13C have been dredged-up into VY CMa's envelope, as expected in a post-main-sequence star.
Figure 12 compares profiles of the 12CO and 13CO lines from the spectrum in Figure 7(c). The profiles of 12CO and 13CO match almost perfectly at all velocities. The only significant difference between the two lines is at velocities near −40 km s−1 (relative to the peak), where the 12CO line is more severely affected by telluric absorption. Given the very different strengths of the two lines, this similarity confirms that the 12CO emission is indeed optically thin, even for the brighter and slower gas closest to the star. This is important because it justifies our previous assumption (Section 4.3) of optically thin 12CO emission when diagnosing the mass-loss history of VY CMa.

Figure 12. Line profile of 12CO 1–0 R2 λ46412 (thick solid line) compared to that of the adjacent 13CO 1–0 R16 line (thin histogram). The intensity of the 13CO line is multiplied by a factor of 16.4 to match that of the 12CO line.
Download figure:
Standard image High-resolution image4.5. A Geometric Model for VY CMa's Nebula
How can we reconcile the obviously discrepant observational results where (1) visual/near-IR images and spectra of the densest features show a very asymmetric nebula with no clear signs of spherical or axial symmetry, and (2) maser and other molecular studies generally suggest axial symmetry with a preferred axis oriented NE/SW, with systematic extinction gradients along the same axis? The new CO spectra we present here may provide a useful bridge between these two, because while there is an overall sense of nearly isotropic outflow in terms of the speed and distance from the star, there is also clear evidence that each individual clump embedded in that outflow was the result of a highly asymmetric mass-loss event.
We propose the following basic picture for the outflow around VY CMa: a lower density and relatively slow "halo" (e.g., Smith et al. 2001) is punctuated with faster and denser CO/dust cloudlets that result from episodic mass ejections, as depicted schematically in Figure 13. Bernat (1981) found similar evidence for multiple ejections from CO absorption profiles in a number of RSGs.

Figure 13. Cartoon of the proposed schematic geometry and structure in the likely pre-SN environment around VY CMa consisting of individual asymmetric mass ejections embedded within a larger and axisymmetric slow envelope (see the text). An Earth-based observer is to the left, such that a region of relatively low density is tilted toward us and is seen primarily south of the star. Maser emission probably arises where the innermost ejections sweep into the dense "equatorial" zones.
Download figure:
Standard image High-resolution image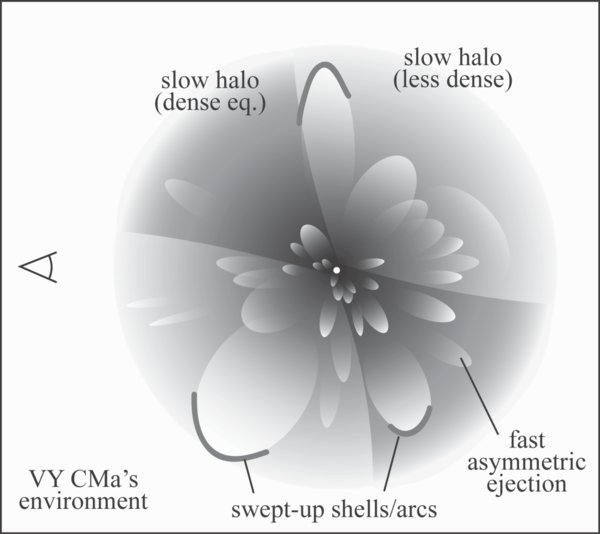
The halo is probably responsible for the ubiquitous 25 km s−1 outflow indicated by blueshifted CO absorption features. If it were to contain a mild sense of axial symmetry—perhaps the equatorial density enhancement with lower densities at the poles as favored for a number of reasons by previous authors (see Monnier et al. 1999, Smith et al. 2001, and references therein)—then it may also help account for the apparent axisymmetry inferred from molecular studies with lower spatial resolution as well as requirements from maser studies.
On the other hand, faster (40–60 km s−1) dense cloudlets moving through this halo are seen more easily at shorter wavelengths in reflected starlight and at high spatial resolution. Muller et al. (2007) envisioned a schematic geometry with three main components: a dense compact dusty component, a diffuse extended envelope, and a bipolar high-velocity component. Our spectra reveal, however, that the high-velocity component is made of cloudlets that are intermixed randomly with the halo, with no clear large-scale axis of symmetry.
The configuration in Figure 13 is such that the fast and dense cloudlets dominate images and spectra with sufficient resolution to see them. Denser condensations obviously emit and reflect more light than their less dense surroundings. Moving more quickly than their surroundings, they may leave relatively low-density and lower-extinction wakes that further enhance their illumination by the star. A favorably positioned observer looking through one of the larger cavities would have a more direct view of the star than we do. This geometric structure in Figure 13 would also be favorable for the production of strong K i emission lines following the mechanism outlined in the Appendix of Humphreys et al. (2005). It would favor the escape of net emission primarily on the near side of the nebula, since K i photons traversing from the far side would likely be resonantly scattered away before making it through. In this scenario, then, the K i emission arises primarily from the surface of last scattering on the boundaries of dusty molecular cloudlets. This could explain why the K i and 4.6 μm CO emission appear to be spatially and kinematically coincident in the nebula around VY CMa. They arise in very different regions in the smoother stellar wind of Betelgeuse, where calculations by Huggins et al. (1994) predict a clear stratification of atomic and molecular gas.
5. SUMMARY AND CONCLUSIONS: WHAT WILL WE SEE IF THESE STARS EXPLODE?
In order to use core-collapse SNe as probes of massive-star evolution in other galaxies at large distances, we must first be able to confidently map the various types of SNe to their likely progenitor stars. This is especially difficult for those with prodigious CSM interaction because of the wide diversity in SNe IIn. It is therefore instructive to take well-studied and spatially resolved examples of observable circumstellar environments around nearby evolved massive stars and ask what type of SNe we might expect in the event that they explode. One can make at least rough estimates of the level of CSM interaction and its qualitative appearance when the hypothetical SN blast wave strikes the observed environment.
5.1. A Betelgeuse Supernova
For Betelgeuse, our observations of spatially resolved 4.6 μm CO emission located at offsets of β≃05–5'' (roughly 100–1000 AU) from the central star show an intensity that falls as β−3. Density variations (either large-scale clumping or other inhomogeneities) are not more than about 20% of the average density on size scales of ≳50 AU. This indicates an environment shaped by a predominantly steady wind, with a constant outflow speed of VCSM≃15 km s−1 and mass-loss rate of roughly  over at least the past ∼300 yr.
If Betelgeuse were to explode in its current RSG phase, it would produce a Type II SN.8 If the blast wave from that SN expands at ∼15,000 km s−1, then it will reach a radius of 103 AU (5'') in 116 days. Thus, during the bright plateau phase of an SN II-P, for example, the shock will sweep directly through the portion of the CSM that is resolved in our 4.6 μm CO data.
All massive stars with winds will give rise to SNe with some level of CSM interaction, but would Betelgeuse's CSM interaction be strong enough to detect in typical SN observations? The wind density parameter  for Betelgeuse is roughly 8.5 × 10¹³ g cm−1. This is more than two orders of magnitude below typical estimates of w for SNe IIn (e.g., Chugai & Danziger 1994) and four orders of magnitude below overluminous SNe IIn like 2006tf (Smith et al. 2008). The total CSM mass contained within 5'' of Betelgeuse (out to radii of 1000 AU, lost in the past ∼320 yr) is only about 10−3 M☉. This is vastly lower than the expected mass of SN ejecta (probably well over 1 M☉), so all the CSM we detect around Betelgeuse does not have enough inertia to substantially decelerate the blast wave or tap into its kinetic energy. Hence, the fast shock is not likely to be radiative during the main peak of the light curve, so the CSM interaction will not substantially enhance the visual continuum luminosity and cannot give rise to substantial narrow Hα emission from the post-shock gas. In other words, it would not be classified as an SN IIn and would appear instead as a normal SN II-P or II-L.
What about emission from the photoionized pre-shock CSM? The average density in Betelgeuse's wind at a projected radius of 2'' is nH≃1125 cm−3. Even if all the pre-shock CSM mass within 1000 AU were photoionized by the SN, the resulting Hα luminosity would be only about 0.4 L☉. In order to be clearly detected in the spectrum during the main peak of an SN IIn, narrow Hα lines from the photoionized CSM typically have LHα≳105 L☉ (e.g., Salamanca et al. 1998, 2002).
In the unique case where Betelgeuse itself were to explode, it would be close enough that the CSM interaction region (a few arcseconds) could actually be spatially resolved from the SN photosphere and might therefore be observable as an extended X-ray and optical emission-line source. If a star like Betelgeuse exploded at typical distances of nearby SNe (more than 10 Mpc), however, the CSM interaction would be much harder to detect with typical data quality because it would be drowned in the photospheric light of the SN.
These arguments above apply to visual-wavelength radiation during the first ∼100 days of the light curve when the SN is bright, because that's when an SN would be classified as a Type II-P, II-L, or IIn. Detecting signs of CSM interaction at later times and other wavelengths is a different story. After the underlying SN II-P photosphere fades, signs of late-time CSM interaction may be visible in emission (Chevalier & Fransson 1994) or absorption (Chugai et al. 2007). CSM interaction from a Betelgeuse-like SN might be detectable in X-rays and radio emission. For example, Pooley et al. (2002) measured X-rays from SN 1999em that led them to infer a progenitor mass-loss rate of 1–2 × 10⁻⁶ M☉ yr−1. This is similar to Betelgeuse's mass-loss rate, so SN 1999em being a prototypical SN II-P reinforces our conclusions above that Betelgeuse cannot produce an SN IIn. Progenitor mass-loss rates of 10−6 to 10−5 M☉ yr−1 are typical for normal SNe II-P (Chevalier et al. 2006).
5.2. A Supernova from VY CMa
The case of VY CMa is different, because its current mass-loss rate is 100 times higher than that of Betelgeuse, and its CSM is very inhomogeneous. Our 4.6 μm spectra reveal a locally inhomogeneous but globally isotropic distribution of CO-emitting gas, resulting from a series of episodic mass ejections over the past 1000 yr that have built up a dense shell environment like that depicted in Figure 13. This sketch of the CSM is complicated, but is needed to accommodate the seemingly discrepant observations as noted earlier (see also Humphreys et al. 2005, 2007; Smith 2004; Smith et al. 2001; Monnier et al. 1999, 2004). Most of the visible mass is contained in cloudlets that are either ejected bullets or swept up arcs and shells, or both. VY CMa's current average mass-loss rate has been estimated as 2–4 × 10⁻⁴ M☉ yr−1 (Danchi et al. 1994), which we attribute to the smoother and slower wind between clumps. Our 4.6 μm CO data and the intensity of scattered starlight (Smith et al. 2001) suggest that between a few hundred and 1000 yr ago, VY CMa had a higher mass-loss rate of 1–2 × 10⁻³ M☉ yr−1 attributed mainly to the mass in dense clouds.
With these parameters, the total mass ejected by VY CMa in the past ∼1000 yr is a little over 1 M☉. Unlike Betelgeuse, this may be enough to substantially decelerate the forward shock (depending on the mass and density law in the SN ejecta), and thereby tap into the available reservoir of its kinetic energy to power a display of CSM interaction.
There are basically two components in VY CMa's wind: if we assume that (1) the slow "halo" expanding at 25 km s−1 corresponds to the current average mass-loss rate of 3 × 10⁻⁴ M☉ yr−1, and that (2) dense cloudlets moving at 35 km s−1 produced the higher mass-loss rate of 2 × 10⁻³ M☉ yr−1, then the wind density parameter  for VY CMa is roughly (1–3) × 1016 g cm−1 (bear in mind that there may be localized clumps with significantly higher density than the average). If most of the mass is in the clumpy wind, then a value near 2 × 10¹⁶ g cm−1 is conservative.
Unlike Betelgeuse, VY CMa's value of w is entirely consistent with typical values inferred for moderate-luminosity SNe IIn. The maximum luminosity that can be generated by CSM interaction (LCSM), assuming 100% efficiency in converting kinetic energy into visual-wavelength radiation, is given by

where VSN is the speed of the forward shock sweeping through the CSM. Adopting VSN=5,000 km s−1 for the decelerated forward shock speed, CSM interaction in a VY CMa-like SN could yield a luminosity potentially as high as 3 × 10⁸ L☉ at early times when the conversion of kinetic energy to light is efficient. This could at most double the peak continuum luminosity of a normal SN II-P at early times, but would likely dominate the appearance of the spectrum with strong and relatively narrow Hα emission. Thus, an exploded VY CMa would likely appear to a distant observer as a bona fide SN IIn. The ongoing CSM interaction would also dominate the luminosity at late times (after ∼1 yr). With VSN=5000 km s−1, the ∼1 M☉ residing within 7500 AU of the star can be overtaken by the forward shock by 6–8 yr after the SN. Thus, while VY CMa is unlikely to produce an extremely luminous SN IIn like SN 2006tf (Smith et al. 2008), it probably will produce a moderately luminous and long-lasting SN IIn like SN 1988Z, which had detectable CSM interaction for over a decade after explosion (Turatto et al. 1993; Chugai & Danziger 1994; Aretxaga et al. 1999).
In fact, both the qualitative depiction in Figure 13 and our quantitative estimates for VY CMa's CSM provide a surprisingly good match to the CSM that Chugai & Danziger (1994) envisioned for SN 1988Z's progenitor. Chugai & Danziger (1994) interpreted SN 1988Z as having a lower-mass (8–10 M☉) progenitor star than VY CMa, but the inferred values of w = 5 × 10¹⁶ g cm−1 and  for the clumpy progenitor wind are very close to those of VY CMa. In particular, the two-component clumpy wind required to enhance the emissivity of intermediate-width post-shock Hα emission lines of SN 1988Z is realized in the circumstellar nebula of VY CMa (Figure 13).
This enhanced episodic mass loss by VY CMa apparently just turned on about 1000 yr ago, judging by the outer extent of its visible reflection nebula (Smith et al. 2001) and the steep fall off of β−6 at 5'' (7500 AU) for 4.6 μm CO emission (Figure 11). Thus, after a few years we might expect the enhanced luminosity from CSM interaction to shut off when the blast wave overruns the outer boundary of the nebula. This too is reminiscent of some SNe IIn. For example, a sharp drop in visual luminosity was attributed to the forward shock overtaking a similar outer boundary of a dense shell in the case of the SN IIn 1994W (Chugai et al. 2004), while a sharp change in pre-SN mass loss has also been inferred for SNe 1980K and 1988Z from an analogous drop in radio emission (Montes et al. 1998; Williams et al. 2002).
As an extreme RSG, VY CMa is valuable in that it provides a well-studied example that LBVs are not necessarily the only candidates for the progenitors of SNe IIn, which has been suggested recently (see Section 1). An important point, though, is that VY CMa's unusually dense CSM is not the product of a steady RSG wind, but instead, resulted from an episode of enhanced eruptive mass ejection in just the past 1000 yr. Thus, whether LBVs or extreme VY CMa-like RSGs are the progenitors of SNe IIn, eruptive rather than steady pre-SN mass loss is apparently an essential ingredient for sufficient CSM interaction. This may be a critical clue for understanding the final stages of evolution for massive stars.
This only applies if VY CMa will explode soon. There is, of course, considerable uncertainty as to the true fate of VY CMa, since the late evolution of massive stars is still poorly understood and depends sensitively on the mass loss. Will VY CMa explode in its current extreme RSG state, or will it evolve blueward to become a yellow hypergiant with a dense environment (like IRC+10420), or a blue supergiant with a dense shell nebula in a post-RSG LBV phase (Smith 2007; Smith et al. 2004)? Or instead, will it voyage all the way to the WR phase, producing an SN Ib with a distant wind-swept shell?
VY CMa is admittedly a rare and extreme example, even among the most luminous RSGs, and has the most prodigious mass loss among stars with initial masses 20–40 M☉. We can infer one of two possibilities: either (1) only a small fraction of SNe from stars of initial mass 30–40 M☉ will ever have dense enough CSM to yield SNe IIn, or (2) since VY CMa's unusually high mass loss just "turned on" about 1000 yr ago, it may be symptomatic of the brief enhanced mass loss inferred for pre-explosion evolution of many SNe IIn (e.g., Chugai et al. 2004; Smith et al. 2008). In the latter case—where we really are witnessing the "last gasps" of VY CMa (Monnier et al. 1999)—G. Wallerstein's gamble in the 1960s to continue monitoring VY CMa until it explodes (see Wallerstein & Gonzalez 2001) may yet pay off.
We thank Graham Harper for interesting discussions about the Betelgeuse data and interpretations, and for helpful comments on the manuscript. We also thank Phil Hinz for permission to use the IR image of Betelgeuse that appears in Figure 1. This work was based on observations obtained at the Gemini Observatory, which is operated by the Association of Universities for Research in Astronomy, Inc., under a cooperative agreement with the NSF on behalf of the Gemini partnership: the National Science Foundation (US), the Particle Physics and Astronomy Research Council (UK), the National Research Council (Canada), CONICYT (Chile), the Australian Research Council (Australia), CNPq (Brazil), and CONICET (Argentina). The observations were obtained with the Phoenix infrared spectrograph, which was developed and operated by the National Optical Astronomy Observatory. N.R. is a Royal Swedish Academy of Sciences research fellow supported by a grant from the Knut and Alice Wallenberg foundation. The spectra were obtained as part of programs GS-2005A-C-8 (P.I.: Harper) and GS-2006B-DD-1 (P.I.: Hinkle).
Footnotes
-
*
Based on observations obtained at the Gemini Observatory.
-
4
-
5
Caveat: when interpreting the position–velocity plots in Figure 4, one must note that the stated offset slit position (commands given to the telescope) may not match the true offset position exactly due to potential pointing errors at the 0
1–02 level, or real differences between the optical and IR centroids of the source. This error is difficult to quantify, but it is presumably the explanation for why the offset positions at 05 south and 05 east are more severely contaminated by starlight than positions ostensibly located at the same offsets on the opposite sides of the star. Alternatively, Figure 1 shows that the star's centroid position is offset slightly to the south and east of the mid-IR centroid. -
6
In the case of the CO R2 1–0 line this is the 12CO (v'' = 0, J'' = 2) level.
-
7
Note, however, that the lower luminosity of 6 × 10⁴ L☉ suggested by Massey et al. conflicts with the observed total IR luminosity (Smith et al. 2001). Also, see comments by Humphreys (2006) regarding the possible effects of spectral-type variation (M2.5 vs. M4–5) and heavy mass loss on the Teff determination.
-
8
However, its luminosity suggests an initial mass of 15–20 M☉, much like that of the progenitor of SN 1987A. Thus, Betelgeuse could enter a blue loop and explode as a BSG after ∼104 yr.