


ABSTRACT
SONYC—Substellar Objects in Nearby Young Clusters—is a survey program to investigate the frequency and properties of substellar objects with masses down to a few times that of Jupiter in nearby star-forming regions. Here, we present the first results from SONYC observations of NGC 1333, a ∼1 Myr old cluster in the Perseus star-forming complex. We have carried out extremely deep optical and near-infrared imaging in four bands (i', z', J, K) using Subaru Prime Focus Camera and Multi-Object InfraRed Camera and Spectrograph (MOIRCS) instruments at the Subaru telescope. The survey covers 0.25 deg2 and reaches completeness limits of 24.7 mag in the i' band and 20.8 mag in the J band. We select 196 candidates with colors as expected for young, very low mass objects. Follow-up multi-object spectroscopy with MOIRCS is presented for 53 objects. We confirm 19 objects as likely brown dwarfs (BDs) in NGC 1333, seven of them previously known. Nine additional objects are classified as possible stellar cluster members, likely with early to mid M spectral types. The confirmed objects are strongly clustered around the peak in the gas distribution and the core of the cluster of known stellar members. For 11 of them, we confirm the presence of disks based on Spitzer/Infrared Array Camera photometry. The effective temperatures for the BD sample range from 2500 K to 3000 K, which translates to masses of ∼0.015–0.1 M☉, based on model evolutionary tracks. For comparison, the completeness limit of our survey translates to mass limits of 0.004 M☉ for AV ≲ 5 mag or 0.008 M☉ for AV ≲ 10 mag. Compared with other star-forming regions, NGC 1333 shows an overabundance of BDs relative to low-mass stars, by a factor of 2–5. On the other hand, NGC 1333 has a deficit of planetary-mass objects: based on the surveys in σ Orionis, the Orion Nebula Cluster and Chamaeleon I, the expected number of planetary-mass objects in NGC 1333 is 8–10, but we find none. It is plausible that our survey has detected the minimum mass limit for star formation in this particular cluster, at around 0.012–0.02 M☉. If confirmed, our findings point to significant regional/environmental differences in the number of BDs and the minimum mass of the initial mass function.
Export citation and abstract BibTeX RIS
1. INTRODUCTION
The origin of the stellar initial mass function (IMF) is one of the major issues in astrophysics. The low-mass end of the IMF, in particular, has been the subject of numerous observational and theoretical studies over the past decade (see Bonnell et al. 2007). While higher mass stars exhibit the well-known Salpeter shaped mass function (dN ∝ m−αdm, with α = 2.35 Salpeter 1955), the power-law slope becomes significantly shallower below ∼0.5 M☉ (Kroupa 2001; Chabrier 2003). In the substellar regime, the coefficient α is mostly found to be around 0.6 (e.g., Moraux et al. 2003; López Martí et al. 2004; Moraux et al. 2007; Caballero et al. 2007). While the higher mass domain is thought to be mostly formed through fragmentation (e.g., Padoan & Nordlund 2002) and/or accretion onto the protostellar core (e.g., Bonnell & Bate 2006), in the low-mass and substellar regime additional physics is likely to play an important role, e.g., dynamical interactions (Bate et al. 2003; Bate 2009), turbulence (Padoan & Nordlund 2004), photoerosion in the radiation field of bright stars (Whitworth & Zinnecker 2004), or tidal shear in the gravitational potential of a stellar cluster (Bonnell et al. 2008).
To continue collapsing, an object or region has to cool as quickly as it is being heated by the conversion of gravitational into thermal energy. As radiative cooling is related to the opacity, this condition defines the opacity limit of fragmentation, which translates into a minimum mass for star-like sources, predicted to be between 0.001 and 0.01 M☉ (e.g., Low & Lynden-Bell 1976; Rees 1976; Boss 2001; Bate 2005; Whitworth & Stamatellos 2006). Thus, isolated substellar objects in star-forming regions can have planetary-like masses. Furthermore, current numerical simulations of star formation build a significant fraction of brown dwarfs (BDs) by fragmentation in protostellar disks and subsequent ejection from the disk (Bate et al. 2003; Stamatellos & Whitworth 2009). Thus, a fraction of the substellar population may have a similar origin to massive planets. Hence, using the term "isolated planetary-mass object" (IPMO or planemos; see Basri & Brown 2006) for objects with masses below the deuterium-burning limit (∼0.015 M☉) makes some physical sense, as this is the mass regime where star and planet formation overlap.
The frequency and physical properties of the objects at the extreme low-mass end of the spectrum are poorly known. Following the discovery of BDs (Rebolo et al. 1995; Nakajima et al. 1995), surveys of star-forming regions, young clusters, and the field have revealed a rich population of substellar objects, triggering a wealth of follow-up studies to characterize their physics (see Basri 2000). Populations of planetary-mass objects have been identified with masses down to 0.005–0.01 M☉ (e.g., Zapatero Osorio et al. 2000; Lucas & Roche 2000). So far, there is no evidence for a cutoff in the mass function, or in other words, the opacity limit has not been observed yet.
As of today, however, only two regions have been systematically surveyed down to masses significantly below the deuterium-burning limit: σ Orionis cluster and the Orion Nebula Cluster (ONC). At a distance of ∼400 pc, any follow-up for planemos in Orion beyond photometry and very low resolution spectroscopy is challenging. A few more objects in the same mass regime have been identified based on mid-infrared detections from Infrared Space Observatory (ISO) or Spitzer (Testi et al. 2002; Luhman et al. 2005; Allers et al. 2006; Luhman & Muench 2008). This approach, however, will by definition only find sources with circumstellar material and thus yield incomplete results. The unbiased census for the members of the Chamaeleon I (ChaI) star-forming region is currently complete down to ∼0.01 M☉ (Luhman 2007), and has yielded a handful of planetary-mass members.
SONYC—Substellar Objects in Nearby Young Clusters—is a new, unbiased attempt to establish the frequency of low-mass BDs and planetary-mass objects as a function of cluster environment and to provide the groundwork for detailed characterization of their physical properties (disks, binarity, atmospheres, accretion, activity). The project is based on extremely deep optical and near-infrared imaging and follow-up spectroscopy using 8 m class telescopes, aiming to detect the photospheres of the objects, which is a prerequisite for an unbiased survey. The observations are designed to reach limiting masses of 0.003 M☉, and thus are meant to probe the opacity limit of star formation (see above). In each region, we aim to cover at least ∼1000 arcmin2.
In the first paper for this project, we report on the survey in the cluster NGC 1333, part of the Perseus star-forming complex, carried out with Subaru Prime Focus Camera (Suprime-Cam) and Multi-Object InfraRed Camera and Spectrograph (MOIRCS) at the Subaru telescope. With an age of ∼1 Myr, a distance of 300 pc (de Zeeuw et al. 1999; Belikov et al. 2002), and moderate extinction, it is feasible to reach completeness limits of I = 25 mag and J = 21 mag, corresponding to masses for cluster members of about 0.003 M☉, according to the COND03 evolutionary tracks (Baraffe et al. 2003). Furthermore, the cluster is compact and can thus be covered efficiently.
Near-infrared surveys in NGC 1333 have been carried out, among others, by Strom et al. (1976), Aspin et al. (1994), and Lada et al. (1996), establishing the presence of an embedded stellar cluster and a site of ongoing star formation with more than a hundred YSOs down to K = 14.5 mag. More recently, Wilking et al. (2004) have identified at least nine substellar objects based on near-infrared imaging over 133 arcmin2 with a limiting magnitude of K = 16 mag and follow-up spectroscopy. They find a disk frequency of 74% and an upper limit to the mass function exponent of α ⩽ 1.6 in the substellar regime, consistent with previous studies. Building upon this work, Greissl et al. (2007) have carried out deeper Hubble Space Telescope (HST)/NICMOS observations of a limited area (3 arcmin2), probing for the first time the planetary-mass regime. The near-infrared survey by Oasa et al. (2008) is similarly deep (K = 18 mag) and covers 25 arcmin2, but does not include follow-up spectroscopy. In addition, NGC 1333 has been covered by numerous X-ray, mid-infrared, submillimeter, and millimeter surveys, for example in the framework of the Spitzer "Cores to Disks" Legacy Program, resulting in detailed studies of the cloud and cluster structure as well as accretion and outflow activity (e.g., Getman et al. 2002; Preibisch 2003; Enoch et al. 2006; Jørgensen et al. 2006; Walsh et al. 2007; Gutermuth et al. 2008).
This paper is structured as follows: we present our observations and data reduction procedures for photometry and spectroscopy in Section 2. In Section 3, we discuss the photometric selection and spectroscopic verification of very low mass (VLM) objects in NGC 1333. The properties of our sources, including evidence for youth, are analyzed in Section 4. The low-mass end of the IMF based on our new findings is discussed in Section 5. We give our conclusions in Section 6.
2. OBSERVATIONS AND DATA REDUCTION
2.1. Optical Imaging and Photometry
We observed NGC 1333 in the Sloan Digital Sky Survey (SDSS) i' and z' filters using the Suprime-Cam wide-field imager (Miyazaki et al. 2002) on 2006 November 17. The conditions were photometric with typical seeing ranging from 0 45 to 063. Suprime-Cam is a mosaic camera which utilizes 10 CCDs arranged in a 5 by 2 pattern giving a total field of view of 34' × 27'. As NGC 1333 is quite compact, the entire cluster was observed in a single pointing. A 10 point dither pattern was carried out to eliminate gaps between the CCDs and to correct for bad pixels. We observed this pattern in each filter six times, where the individual images have exposure times of 60 s, for a total integration time of 3600 s in each band.
A standard reduction was performed for each individual CCD chip. Routines from the Suprime-Cam data reduction software package SDFRED (Yagi et al. 2002; Ouchi et al. 2004) were used for overscan subtraction and flat fielding. In both filters, the images show significant extended structure from the molecular cloud emission. Sky subtraction was performed by fitting a Gaussian to the peak of a histogram of pixel brightnesses and subtracting the centroid. Additional routines from SDFRED were used for distortion correction, bad pixel masking and image combination. Only one of the 10 CCD chips (w67c1) showed noticeable fringing. To reduce each chip consistently, and because the 10 point dither pattern mostly removes the fringes, we did not carry out a fringe correction. The world coordinate system was calibrated against sources from the Two Micron All Sky Survey (2MASS) point-source catalog (Cutri et al. 2003) with J ⩾ 13 using the msctpeak program from the IRAF package MSCRED.5 The typical fitting residuals were of order 025.
Sources were identified from each CCD chip using the Source Extractor (SExtractor) software package (Bertin & Arnouts 1996). For object extraction, we required at least 5 pixels to be above the 3σ detection limit. SExtractor automatic aperture fitting photometry routines were used to calculate the flux of each source. We rejected objects within a few pixels of the edge of the image, elongated objects (a/b>1.2) and objects that were not present in both the i' and z' source lists. The rejection criteria were chosen conservatively, to minimize the number of spurious detections in the photometry database. We visually checked the detection algorithm and confirmed that the number of point sources that are missed as well as the number of spurious sources that are included is minimal. The final optical catalog has 7757 objects.
We measured the chip-to-chip zero-point offsets from the median fluxes of domeflat images. The absolute zero point for the mosaic was derived from observations of the SA95 standard field, which contains SDSS secondary standards (Smith et al. 2002). To avoid saturation, the images of standard fields were defocused. The fluxes of five standard stars were extracted using aperture photometry with 50 pixel radius. We derived a mean zero point of 27.80 ± 0.01 in i' and 27.12 ± 0.02 in z' band. These values agree with the zero point measured by Miyazaki et al. (2002) within 0.12 mag in i' and 0.07 in z'. The air-mass difference between standard fields and science fields was ±0.1, i.e., the differential extinction is negligible.
From the histogram of the magnitudes (see Figure 1 for the i'-band data) we derived completeness limits of our survey: in the i' band, we are complete down to 24.7 ± 0.2 mag, in z' band down to 23.8 ± 0.2 mag. These limits are robust against changes in color, as demonstrated in Figure 1. The limiting magnitudes of our survey are about 26.5 mag in i' and 25.5 mag in z', which are close to the sensitivity limits determined during the Suprime-Cam commissioning phase (Miyazaki et al. 2002).

Figure 1. i '-band histogram of the objects in our photometric catalog with i'- and z'-band data. The peak at 24.7 mag indicates the completeness limit of the survey. The faintest objects in the survey are found at i>26 mag. The dashed and dash-dotted lines show the histogram for equally sized samples of blue and red objects, illustrating that the completeness limit does not significantly change with color, although we are slightly more sensitive to red objects.
Download figure:
Standard image High-resolution image2.2. Near-infrared Imaging and Photometry
NGC 1333 was observed with the MOIRCS mounted on the Subaru telescope, in the MKO broadband filters J and Ks, during the nights of 2008 December 4–6. MOIRCS uses two CCDs providing a total field of view of 4' × 7' with a spatial resolution of 0.117 arcsec pixel−1. NGC 1333 was covered in 24 pointings in both filters, using a six- or eight-point dither pattern. In the J band, the typical exposure time per pixel was 600 s, in the K band 300 s. In addition, the center of NGC 1333 was covered in a smaller series of 13 s short exposures, to obtain photometry for the brightest sources that saturate in the deeper exposures.
Data reduction was performed using a modified version of the SIMPLE-MOIRCS package,6 which is written in IDL7 and uses SExtractor. Background subtraction, flat-field correction and distortion correction were performed on individual images, before the images were co-added. The world coordinate system was calibrated against the 2MASS point-source catalog. Initial source identification is performed using SExtractor, requiring at least 3 pixels to be above the 3σ detection limit. Source rejection was performed based on saturation and elongation. After running the identification and rejection routines, the sources were visually verified for each field. Photometry was performed using a fixed-aperture extraction routine in IDL. To account for variable seeing between fields, an aperture correction factor is determined for each individual field. To correct for difference in sensitivity between detector 1 and 2, a flux offset factor is determined from the average level of the sky flux in both images, and applied to detector 2 for each individual field.
The final near-infrared catalog has 2360 sources. Calibration of the absolute zero-point magnitude is performed by comparing the full catalog of extracted sources to the 2MASS point-source catalog. The mean zero point is derived to be 25.08 ± 0.03 in J band and 24.3 ± 0.04 mag in K band. Completeness limits in each band are derived from the number distribution of the magnitudes (see Section 2.1). The imaging is complete down to 18.0 mag in K band and 20.8 mag in J band.
2.3. Multi-object Spectroscopy
We used MOIRCS again to carry out multi-object spectroscopy (MOS) for 53 sources in NGC 1333, 36 of them selected based on the photometry in the four bands i', z', J, K (see Section 3). The targets are covered in six multi-slit masks; the number of objects per mask was 5–13. Pre-imaging for the masks in the K band was obtained in 2008 September. We used slits which are 09 wide and 9''–12''long, except for a few longer slits, used to observe standard stars. The spectroscopy run was carried out in three nights on 2008 December 4–6. For each mask we integrated in total 50–60 minutes with the grism HK500, split in shorter exposures of 5 or 10 minutes, depending on conditions. Between the single exposures, the mask was moved so that the targets shifted by 25 along the slit (nodding), to facilitate sky subtraction. The seeing during the science integrations was stable at 05–07. Before and after the NGC 1333 masks, we observed A0 stars through one of the science masks for flux calibration and extinction correction; these exposures required defocusing to prevent saturation. For each mask, we obtained series of domeflats with lamp-on and -off for calibration purposes.
The MOS data were reduced following standard recipes for near-infrared spectra. In a first step, we subtracted the pairs of nodded exposures, which removes the sky background and the detector bias. These images were divided by a normalized flat field, which is the difference between the averaged lamp-on and lamp-off domeflats. Frames from the same nodding position were co-added. This gives us two final images for each chip and mask. In these frames, the signal-to-noise ratio for the spectra ranges from 20 for the faintest to 1000 for the brightest sources. These values have been measured in the central parts of the H and K band, in regions without strong skyline residuals.
For the extraction of the spectra we used the apall routine within IRAF. All objects from our photometric candidate list are well detected. For wavelength calibration we additionally extracted the spectra from the unreduced frames, which contain plenty of telluric OH lines. As the wavelength solution depends slightly on the position of the slit on the chip, the fit was done for each object separately. For the HK grism, a second-order polynomial fit covering about 20 skylines gave a typical rms of 2–3 Å, well below the resolution. All spectra are smoothed with a ±25 Å boxcar average and binned to 40 Å pixel−1. The two nodded spectra for the same object were co-added. The standard star spectra were treated in exactly the same way as the science frames.
Near-infrared spectra show strong effects of the atmosphere—broad absorption features, mostly between the J/H and H/K bands, as well as sharp OH emission lines. In our data, subtracting the nodding exposures reduced the strength of the OH lines by 95% or better. The residuals are removed in the background subtraction which is part of the extraction. The corrections for telluric extinction and instrument response are usually done in one step, based on observations of a standard star with known spectral energy distribution. Our A0 standard star spectra were divided by a library spectrum of an A0 star (Pickles 1998), obtained from the ESO website.8 To remove residuals of the hydrogen absorption features seen in A0 spectra, we linearly interpolated from 1.54 to 1.78 μm and from 2.09 to 2.34 μm, regions that are mostly free from additional telluric absorption bands.
All science spectra were divided by one of these modified standard spectra observed at similar air mass. Typically, the air-mass difference is <0.1. Still, we find that the correction of atmospheric correction is not optimum. We attribute this mainly to the duration of our science exposures: while the standards were observed within a few minutes, the science exposures cover 1–2 hr. Variable sky conditions, as they have been present during the observations, hamper a good extinction correction. For our analysis we therefore focus on the spectral regions least affected by telluric absorption, i.e., 1.5–1.75 μm in the H band and 2.1–2.3 μm in the K band.
3. SELECTION OF NEW SUBSTELLAR MEMBERS IN NGC 1333
3.1. Optical Color–Magnitude Diagram
The goal of the project is to identify new VLM members of NGC 1333. Due to their pre-main-sequence status, plus extinction, these sources are expected to occupy a distinct area in optical/near-infrared color–magnitude diagrams, on the red side of the broad cumulation of background main-sequence stars. In Figure 2 we show the (i', i'–z') diagram, which we used to identify the initial list of candidates. The cumulation of non-members around i'–z' = 1.0 mag is clearly seen. Previously identified VLM members of NGC 1333 with spectroscopic confirmation from the papers by Wilking et al. (2004) and Greissl et al. (2007) are marked.

Figure 2. Color–magnitude diagram in (i', i'–z') constructed from our deep Suprime-Cam observations. The selection box for follow-up spectroscopy is shown with dash-dotted lines. Objects chosen for spectroscopy (plus) and confirmed or possible M-type members of NGC 1333 (cross, see Tables 1 and 2) are marked. Spectroscopically confirmed BDs from the surveys by Wilking et al. (2004) and Greissl et al. (2007) are marked with diamond and triangle symbols, respectively.
Download figure:
Standard image High-resolution imageBased on the locus of known members, we construct a selection box for this diagram, which encompasses the color–magnitude range where we expect cluster members with lower masses to be found (dash-dotted lines). The position of the box is chosen based on the colors of known substellar cluster members in the diagram. Apart from this empirical constraint, we aimed to select candidates with a broad range in colors, to maximize our chances of covering the cluster population. In particular, the choice of the selection box is independent from models. At the bright end, the box is limited by the onset of saturation at i' ∼ 17.3 mag. The box extends down to our limiting magnitude of i' ∼ 26.5 mag. The selection box contains 196 objects with reliable photometry in i' and z' bands. From this initial sample, we select a representative list of 36 sources for follow-up spectroscopy, marked with + signs in Figure 2. This sample includes 19 objects from the sample from Wilking et al. (2004), six of them previously spectroscopically confirmed as members.
In the selection of candidates for spectroscopy, we ignore the bright end of the selection box i' ≲ 18.5 mag, which contains about one third of the candidates. Cluster members with such magnitudes are likely to have masses around or above the substellar limit, and are therefore of less interest to us. Apart from that, we aim to sample the full range of colors and magnitudes in the box, to account for the uncertainties in estimating the location of the cluster members in this diagram. Thus, the "spectroscopic" sample does not show any bias in terms of colors or magnitudes in comparison with the full photometric candidate sample. In addition, there is no bias in spatial distribution: the full photometric sample shows a clear clustering around the cloud cores in NGC 1333, thus our spectroscopy fields are also distributed in this area (see Section 4.4). Since the density of young sources is higher in the regions close to the cloud cores, the contamination with field objects is expected to be larger further away from the cores. Thus, focusing on the cores is reasonable for minimizing contamination as well.
3.2. Near-infrared Color–Magnitude Diagrams
We used the near-infrared photometry to verify the initial candidate selection. In particular, we aim to ensure that our candidates show the colors expected for reddened VLM members of NGC 1333. In Figure 3, we show the color–magnitude diagram constructed by combining the Suprime-Cam i'-band photometry with the MOIRCS J-band data. The diagram shows all objects with data in both bands, but objects selected for spectroscopy and the 28 objects confirmed by the spectroscopy (Section 3.3) are marked. A few of the confirmed objects are not in our near-infrared catalog due to saturation; for them we use 2MASS data instead.

Figure 3. Color–magnitude diagram in (J, i'–J) constructed from our MOIRCS and Suprime-Cam observations. The candidates selected for spectroscopy from the optical diagram and the confirmed M-type objects (see Tables 1 and 2) are marked with plusses and crosses, respectively. For comparison, we overplot model isochrones for 1 and 10 Myr and the photometry for the substellar objects in σ Ori (Caballero et al. 2007), shifted to the distance of NGC 1333. For the models and the σ Ori objects the Cousins-I photometry was shifted to the Sloan-i' band using the transformation given by Jordi et al. (2006).
Download figure:
Standard image High-resolution imageFor comparison, we overplot the BCAH98, COND03, and DUSTY00 evolutionary tracks for 1 and 10 Myr from Baraffe et al. (1998, 2003) and Chabrier et al. (2000) and the photometry for the substellar population in the σ Ori cluster (Caballero et al. 2007). In both cases, we converted the Cousins I-band data to the Sloan i'-band using the transformation given by Jordi et al. (2006). In principle this requires knowledge of the R−I color, which is not always available for the σ Ori sources. We assumed an average R − I = 2.0 in these cases; the individual (i'–J) colors for σ Ori objects may therefore be incorrect by about ±0.2. Inconsistencies between the Suprime-Cam i' band with the standard bandpass may cause additional uncertainties. The σ Ori photometry was shifted to the distance of NGC 1333, assuming a differential distance modulus of 0.7, consistent with recent estimates. σ Ori is a cluster with little extinction; we expect these objects to be mostly free from reddening.
The plot demonstrates that the spectroscopy candidates cover the color space that is limited on the blue side by models and the σ Ori sources. This is as expected, since the cloud cores in NGC 1333 have significant and variable extinction so the population of young cluster members as well as background objects should be scattered toward the red side. Apart from reddening, there is no systematic offset between our sample and the comparison data. Thus, we confirm that our selection of candidates covers the color space expected for VLM members of NGC 1333.
The intrinsic near-infrared color J − K of late-type objects is mostly independent of spectral type and luminosity; thus it can be used to estimate the extinction for the suspected cluster members. This is done only for the objects confirmed as having spectral type M or later (Section 3.3). We assume here an intrinsic color of J − K = 1.0 mag. Within ±0.2 mag, this is consistent with the empirical values for main-sequence dwarfs and giants with spectral type M (Bessell & Brett 1988), with the predictions from the evolutionary tracks COND03 (for 0.003–0.1 M☉), BCAH98 (for 0.03–0.5 M☉), and DUSTY00 (for 0.006–0.1 M☉), and with the colors of BDs in the 3 Myr old σ Ori star-forming region down to 0.013 M☉ (Caballero et al. 2007). For young objects with masses below the deuterium-burning limit there are some indications that the J−K color increases to 1–1.5 (Lodieu et al. 2006; Caballero et al. 2007); this may lead to an overestimate of the extinction by as much as 2.5 mag for the lowest mass objects.
For the extinction estimate and throughout this paper, we use the extinction law from Mathis (1990), with RV = 4. In Figure 4 we plot the (J, J − K) color–magnitude diagram with the solid line indicating the reddening path and the dotted line showing the assumed intrinsic color. For the 28 objects with spectroscopic confirmation (listed in Tables 1 and 2), we plot our photometry (crosses) or 2MASS data (plusses), as well as the dereddened J-band photometry (circles). For the optical extinction in our confirmed sample, we obtain AV = 0 − 13, i.e., we are probing deeper into the cloud than Wilking et al. (2004, AV ⩽ 7). The results for AV are given in Tables 1 and 2.

Figure 4. Near-infrared color–magnitude diagram for the 28 objects listed in Tables 1 and 2. The plusses show the MOIRCS photometry, crosses are 2MASS values for the cases not covered by our data, the circles the dereddened values, assuming intrinsic colors of J − K = 1.0 mag (dotted line). The solid lines illustrate the reddening path.
Download figure:
Standard image High-resolution imageTable 1. Probable Substellar Members of NGC 1333
| Number | α(J2000) | δ(J2000) | i' (mag) | z' (mag) | J (mag) | K (mag) | AV | Teffa | SpTb | Notesc |
|---|---|---|---|---|---|---|---|---|---|---|
| 1 | 03 28 47.66 | +31 21 54.6 | 23.540 | 21.343 | 17.55 | 15.24 | 6.9 | 2800 | MBO139 | |
| 2 | 03 28 54.93 | +31 15 29.1 | 21.040 | 18.922 | 15.99 | 14.22 | 4.1 | 2600 | M6.5 | exd,e |
| 3 | 03 28 55.25 | +31 17 35.4 | 19.386 | 17.602 | 15.09 | 13.43 | 3.5 | 2900 | ASR38d | |
| 4 | 03 28 56.50 | +31 16 03.1 | 22.999 | 21.233 | 18.17 | 16.73 | 2.3 | 2500 | e | |
| 5 | 03 28 56.94 | +31 20 48.6 | 19.417 | 17.935 | 15.48 | 13.92 | 3.0 | 2900 | M6 | MBO91, ex |
| 6 | 03 28 57.11 | +31 19 12.0 | 21.157 | 19.545 | 17.24 | 15.34 | 4.8 | 2700 | M8 | MBO148, ex |
| 7 | 03 28 58.43 | +31 22 56.7 | 19.230 | 17.856 | 15.21 | 13.54 | 3.5 | 2800 | M6.5 | MBO80, ex |
| 8 | 03 29 03.39 | +31 18 39.9 | 20.059 | 18.199 | 15.85 | 14.03 | 4.3 | 2600 | M8.5 | MBO88, ex |
| 9 | 03 29 05.56 | +31 10 13.7 | 21.288 | 19.425 | 16.91 | 15.76 | 0.8 | 2600 | M8 | |
| 10 | 03 29 05.64 | +31 20 10.7 | 20.080 | 18.842 | 17.11 | 15.49 | 3.3 | 2500 | MBO143, exd,e | |
| 11 | 03 29 07.17 | +31 23 22.9 | 22.989 | 21.187 | 17.87 | 15.62 | 6.6 | (2600) | MBO141e | |
| 12 | 03 29 09.33 | +31 21 04.1 | 22.553 | 20.336 | 16.33 | 13.29 | 10.7 | (2500) | MBO70, exe | |
| 13 | 03 29 10.79 | +31 22 30.1 | 19.483 | 17.778 | 14.96 | 13.05 | 4.8 | 3000 | M7.5 | MBO62 |
| 14 | 03 29 14.43 | +31 22 36.2 | 18.104 | 16.960 | 14.55 | 13.02 | 2.8 | 2900 | M7 | MBO66 |
| 15 | 03 29 17.75 | +31 19 48.1 | 19.091 | 17.326 | 14.80 | 12.99 | 4.3 | 3000 | M7.5 | MBO64, exd,e |
| 16 | 03 29 28.16 | +31 16 28.4 | 16.934 | 15.808 | 13.22 | 12.53 | 0.0 | 2600 | M7.5 | Random |
| 17 | 03 29 33.88 | +31 20 36.1 | 20.383 | 18.848 | 16.47 | 15.37 | 0.5 | 2500 | M8 | MBO140 |
| 18 | 03 29 35.71 | +31 21 08.5 | 22.633 | 21.089 | 18.50 | 16.94 | 3.0 | 2500 | Blue, ex | |
| 19 | 03 29 36.36 | +31 17 49.8 | 22.528 | 20.716 | 17.91 | 16.38 | 2.8 | 2700 |
Notes. aEstimated by comparing the spectra to models. Uncertain fit results are in brackets. bEstimated using the spectral index and calibration from Allers et al. (2007), if applicable. c"ex" means mid-infrared color excess, ASR and MBO object id's are candidates from Wilking et al. (2004). dNear-infrared photometry from 2MASS. eTemperature estimate changed after visual inspection, see Section 3.3.
Download table as: ASCIITypeset image
Table 2. Possible Stellar Members of NGC 1333
| Number | α(J2000) | δ(J2000) | i' (mag) | z' (mag) | J (mag) | K (mag) | AV | Teffa | SpTb | Notesc |
|---|---|---|---|---|---|---|---|---|---|---|
| 20 | 03 28 43.23 | +31 10 42.6 | 21.864 | 19.606 | 15.37 | 12.03 | 12.3 | 3400 | exd,e | |
| 21 | 03 28 47.34 | +31 11 29.9 | 21.626 | 19.330 | 15.48 | 12.70 | 9.4 | 3100 | d | |
| 22 | 03 28 50.97 | +31 23 47.9 | 20.380 | 18.418 | 14.66 | 11.24 | 12.7 | 3500 | MBO26d | |
| 23 | 03 29 02.16 | +31 16 11.1 | 17.197 | 16.245 | 14.53 | 13.57 | 0.0 | 3900 | ASR03, giant?d | |
| 24 | 03 29 08.32 | +31 20 20.3 | 19.376 | 17.809 | 14.80 | 12.48 | 7.0 | 3100 | MBO44e | |
| 25 | 03 29 11.64 | +31 20 37.5 | 20.544 | 18.738 | 15.43 | 12.67 | 9.3 | 3400 | MBO58e | |
| 26 | 03 29 16.75 | +31 23 25.3 | 15.42 | 13.58 | 4.4 | 3800 | MBO79, ex, giant?d,e | |||
| 27 | 03 29 22.36 | +31 21 36.8 | 21.407 | 20.197 | 17.71 | 15.89 | 4.3 | 3300 | MBO177, blue | |
| 28 | 03 29 33.50 | +31 17 56.5 | 22.926 | 21.477 | 18.52 | 16.27 | 6.6 | 3700 | Blue |
Notes. aEstimated by comparing the spectra to models. Uncertain fit results are in brackets. bEstimated using the spectral index and calibration from Allers et al. (2007), if applicable. c"ex" means mid-infrared color excess, ASR and MBO object id's are candidates from Wilking et al. (2004). dNear-infrared photometry from 2MASS. eTemperature estimate changed after visual inspection, see Section 3.3.
Download table as: ASCIITypeset image
This range of optical extinctions is in good agreement with the extinction maps as derived from submillimeter continuum observations (Enoch et al. 2006). Converting a 1.1 mm map to an extinction map results in AV < 17 mag for 5' resolution for NGC 1333. Our extinction estimates for individual objects are all in this range, perhaps with the exception of object 12 (see discussion in Section 3.3). The comparison also indicates that we do not miss a significant number of additional objects at even higher extinctions. Note that the maximum extinction is lower when derived from 2MASS near-infrared data or from 13CO observations, mainly because these indicators do not trace the densest regions of the cloud well.
The main error sources in the extinction estimates are (1) uncertainties in the estimate of the intrinsic colors and (2) possible excess emission due to disks and accretion. As pointed out above, except for the lowest mass objects, the intrinsic colors are likely to be accurate within 0.2 mag, which causes errors in AV of <1 mag. At the lowest masses, the error may be larger. The disk fraction in NGC 1333 is high (83%; Gutermuth et al. 2008), hence a substantial fraction of cluster members may show enhanced K-band flux due to excess emission from dust in the disk, which leads to a systematic overestimate of the extinction. On the other hand, accretion-induced hot spots can enhance the J-band as well as the K-band flux (Folha & Emerson 1999). Prior to a more detailed characterization, these effects are difficult to take into account. We conservatively estimate that our typical uncertainty in AV is 2 mag; larger errors are possible in individual cases. The extinction values will be used in the spectral fitting in Section 3.3.
3.3. Spectroscopy
With the MOS described in Section 2.3 we obtained low-resolution spectra for 53 objects in total. The sample of objects with spectra includes 36 candidates from the primary photometric sample discussed in Section 3.1. In addition, we have spectra for nine objects that are slightly bluer in optical colors than our primary candidates sources, to verify the validity of the optical color criterion (called "blue" objects in the following). Among our spectroscopy sample are nine confirmed young M dwarfs from the sample published by Wilking et al. (2004), six of them also in our own photometric candidate sample. Finally, we included five random objects in our MOS fields. We had 12 additional slits on objects that are not well detected and did not allow a reliable extraction. All these undetected sources have been included as either blue or random objects, and do not come from our photometric sample.
Our goal is to identify young members of NGC 1333 with substellar masses, i.e., with spectral types later than M5. In addition to these young BDs, our sample may contain embedded stellar members of NGC 1333 and reddened background stars with spectral types earlier than M5, and (less likely) late M- and early L-type field objects in the foreground. We show some examples of the expected shape of the spectra for reddened young BDs, derived from model spectra, in Figure 5.

Figure 5. Reddened model spectra from the AMES DUSTY series (Allard et al. 2001) for log g = 3.5, corresponding to pre-main-sequence ages. Shown are three different temperatures (from top to bottom: 3000 K, 2400 K, 1800 K), each with three different extinctions AV = 0, 5, 10 mag as solid, dotted, dashed lines. The H-band peak and its dependence on temperature is clearly visible. The relative strength of H and K band is strongly affected by extinction. The dash-dotted lines show the spectral range in our observations used for classification.
Download figure:
Standard image High-resolution imageThe low resolution of the spectra does not allow us to measure narrow atomic features. Instead, we focus on the broadband appearance, i.e., the shape of the H and K band as well as the relative intensity in these two bands. We benefit from the fact that the overall shape of the near-infrared spectrum changes distinctly at early/mid M spectral types. While earlier type stars show a broadband spectrum which is monotonously decreasing toward longer wavelength, this is not the case for >M5 objects, due to the appearance of strong H2O absorption features at 1.3–1.5 μm and 1.75–2.05 μm. Most notably, this causes the H-band spectrum to have a distinct and broad peak centered on 1.68 μm, in contrast to earlier type objects, which increases in strength toward L-type objects. This fundamental change is discussed in detail in the literature, see for example Cushing et al. (2005). As demonstrated in Figure 5, the H-band peak is dominant for temperatures lower than 3000 K. While the strength and shape of the H-band peak is primarily determined by temperature (and gravity, see Section 4.2), there is an additional effect of extinction—high extinction (see Section 3.2), will make the H-band peak slightly sharper. As can be seen in Figure 5, this is clearly a minor effect and is only apparent when comparing over a wide range of extinctions.
All spectra were examined visually to look for the typical signature of water absorption, mainly the characteristic peak in the H band. The sample clearly falls into two groups, where 28/53 objects (53%) show an indication of a peak while the others do not. In this classification, we erred on the side of caution, and therefore also included objects with only tentative evidence of water absorption. This sample of 28 objects is the "confirmed" sample of Figures 2–4 and is listed in Tables 1 and 2, together with the photometric and spectroscopic properties. All objects without a clear H-band peak are most likely stars with spectral types significantly earlier than M5. Our spectra do not permit definitive classification of these sources. Out of the 28 confirmed objects, 21 come from our photometric candidate sample. All nine objects from Wilking et al. (2004) with spectral types M2–M8 are correctly classified as having an H-band peak. The "peak" objects exhibit other spectral features of late-type sources, most notably the CO bandheads at > 2.29 μm. We do not find evidence for CH4 absorption at 1.6–1.8 μm, typical for late L and T dwarfs.
We compared the 28 spectra with the H-band "peak" with the latest version of the spectra from the AMES DUSTY model atmospheres (Allard et al. 2001), which are based on the PHOENIX stellar atmosphere code. In contrast to the NEXTGEN spectra from the same code, DUSTY spectra include dust formation in the convective envelope and dust opacities. The more recent DUSTY models also include more complete H2O and TiO line lists. To probe if the specific treatment of dust is relevant, we compared the DUSTY spectra with the DRIFT PHOENIX series (Schmidt et al. 2008), which include a dust model and consistently treat cloud formation and its feedback on the atmosphere. For the resolution and wavelength coverage comparable with our observed spectra, there is no significant difference in the temperature regime >2200 K. For lower temperatures, the dust treatment becomes critical and alternative models need to be considered (Helling et al. 2008).
We used the DUSTY model spectra with temperatures of 1800–3900 K in steps of 100 K and the lowest available log g (3.5 or 4.0). The model spectra were binned and smoothed in the same way as the science spectra. All spectra are scaled to a flux of 1.0 at 1.7 μm. Each object spectrum was then compared with the model series, reddened with the optical extinction derived in Section 3.2. The quality of the match was judged by calculating the χ2 aided by visual inspection. To avoid being misled by excess continuum due to disks or accretion and uncertainties in the extinction, we put emphasis on matching the H-band shape, rather than the overall spectrum.
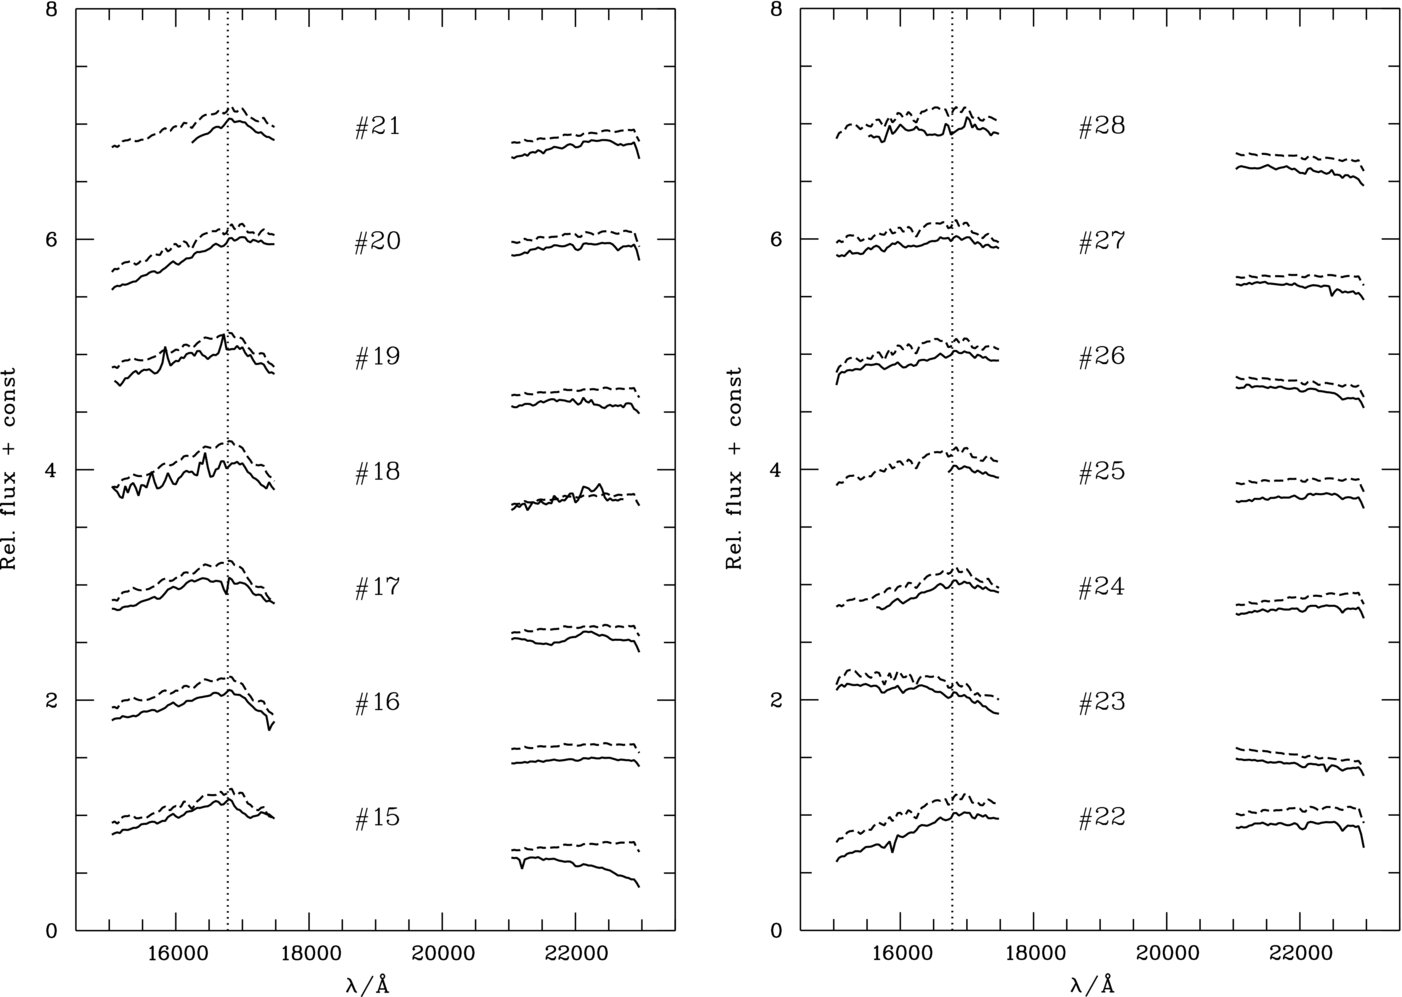
In Figures 6 and 7 we show all 28 object spectra with H-band peak (solid lines) and their best-fit model spectrum (dashed lines). The ID numbers are the same as in Tables 1 and 2. The best match temperatures are given in the tables. For 18 out of 28 objects, this procedure yields a minimum χ2 of <0.5 and a well-matched spectrum, without further adjustments. Four more objects (4, 10, 20, 24) fulfill the same criteria after minor changes to the extinction value (ΔAV ⩽ 2 mag). Object 26 requires increasing the extinction from AV = 4.4 to 8 mag, to obtain a good match, which results in T = 3800 K. As argued in Section 4.1, the status of this object is unclear; it may be a red giant in the background of the cluster. Object 12 shows steeply increasing flux levels in the K band and all signs of strong reddening. We obtain a good match between model and observed spectrum by increasing the extinction to AV = 18 mag. The source is only partially covered in the H band, therefore the temperature estimate is preliminary. Based on the slope of the H-band spectrum, the best estimate is T = 2200–2800 K. Two objects (8, 18) agree well with the model in the H band, but show continuous excess emission in K band with respect to the best-fitting model. Both sources are found to have mid-infrared color excess due to the presence of circumstellar material (Section 4.5), which could explain the K-band excess.

Figure 6. Spectra of late-type objects in NGC 1333 (solid lines) in comparison with models (dashed lines), first part. The running number is the same as in Tables 1 and 2. Shown is the best-fit model with the effective temperature as given in the tables. Objects 1–19 are probable substellar members of NGC 1333.
Download figure:
Standard image High-resolution image
Figure 7. Spectra of late-type objects in NGC 1333 (solid lines) in comparison with models (dashed lines), second part. The running number is the same as in Tables 1 and 2. Shown is the best-fit model with the effective temperature as given in the tables. Objects 1–19 are probable substellar members of NGC 1333.
Download figure:
Standard image High-resolution imageThus, for 26 out of 28 objects we obtain a decent match between the model and observed spectra. In Figure 8, the typical uncertainty of the fitting procedure is illustrated by comparing the observed spectra for three objects from Table 1 with models for various effective temperatures. The χ2 values used to select the best-fitting model are listed as well. As can be seen in the figure, the procedure often does not allow us to distinguish reliably between two models with ΔT = 100 K. However, for ΔT ≳ 200 K there are discernible differences, particularly in the H-band peak, between model and observation, combined with a clear increase in χ2. Thus, a conservative estimate for the typical uncertainty in Teff is ±200 K. For all >M5 objects, the spectral types—either from Wilking et al. (2004) or from the spectral index, see below—are consistent with the temperatures from model fitting within ±200 K or ±1 subtype (using the temperature scale from Luhman et al. 2003). Temperatures of >3500 K have to be treated with caution, as our model grid is limited at 3900 K.

Figure 8. Illustration of the spectral fitting process: each panel shows the spectrum of a probable BD in NGC 1333 from Table 1 in comparison with model spectra for a range of effective temperatures. For clarity, the models are offset by 0.05 units. For each comparison, we give the effective temperature of the model and the χ2 of the fit. From the χ2 values we infer a conservative uncertainty of ±200 K for the effective temperature. The plot demonstrates that larger offsets in Teff lead to visible discrepancies between model and observation, particularly in the shape of the H-band peak. Note: for object 4, the photometrically determined extinction of AV = 2.3 mag gives χ2 ⩾ 0.37; much better results are achieved with a slightly lower AV. We use here AV = 1 mag.
Download figure:
Standard image High-resolution imageThe two objects with unsatisfactory results in the fit are 11 and 15. For 15, the H-band spectrum is well matched with a temperature of 3000 K which is consistent with the spectral type: M6.5 from Wilking et al. (2004) and M7.5 from our spectrum, see below. The literature K-band spectrum shows a flux increase from 2.1 to 2.3 μm, as expected for a mid/late M-type object. Thus, we consider the temperature estimate of ∼3000 K to be reliable. Our K-band spectrum declines with wavelength, indicative of a significantly higher temperature, which prevents us from obtaining a good fit. The object also has a mid-infrared color excess, indicative of circumstellar material (Section 4.5). Source 11 exhibits strong emission at 2.12 μm, consistent with the 1–0 S(1) line of molecular hydrogen at 2.122 μm, seen in protostellar outflows. At λ>2.25 μm, the flux decreases sharply, which is not reproduced by any models or literature spectra in this temperature domain. Based on the H-band peak, our best estimate for the effective temperature is 2600 K, but this has to be treated with caution.
As a complementary approach, we computed the spectral index proposed by Allers et al. (2007) for spectral classification of young BDs, applicable from M5 to L5. This index has two distinct advantages compared with the variety of other index schemes in the literature, as it is gravity insensitive and does not require wavelength coverage in regions heavily affected by telluric water absorption. The spectral types from this index confirm the Wilking et al. (2004) spectral types for the seven >M5 objects within ±1.1 subtypes. Where applicable, we use this index as an additional indicator for the spectral type of our objects (see Table 1).
3.4. Summary of Substellar Member Selection
In summary, from our 36 photometrically selected candidates, we confirm 21 as M-type objects. In addition, three out of nine bluer objects and one out of five random objects are classified as M-type sources. Nine cluster members from Wilking et al. (2004) are confirmed by our spectroscopy, seven of them overlapping with our photometrically selected sample. In total, we have 28 confirmed objects with an H-band peak, indicative of spectral type M. In this confirmed sample are 19 objects with spectral types >M5 or effective temperatures of ⩽3000 K, which would qualify them as BDs, if they are in fact young members of NGC 1333 (see Section 4.2). This subsample is summarized in Table 1, the remaining nine objects in Table 2. For completeness, we note that four photometric candidates reported by Wilking et al. (2004) do not show the H-band peak, i.e., are not classified as M-type sources: MBO 39, 59, 76, 109. These objects may still be cluster members with earlier spectral types.
4. CHARACTERIZATION OF CONFIRMED LATE-TYPE OBJECTS
4.1. Effective Temperatures
We have determined effective temperatures for the sample of late-type objects in Tables 1 and 2 by fitting the observed to model spectra. Out of 28 sources, 19 have temperatures between 2500 and 3000 K, for the other nine we obtain higher values. In addition, we have already derived extinctions, based on the J−K colors, and dereddened J-band magnitudes (see Section 3.2, Figure 4).
We use the dereddened J-band photometry to obtain an alternative estimate of effective temperatures by comparing with the BCAH98 evolutionary tracks BCAH98 (Baraffe et al. 1998) for the typical cluster age of 1 Myr. This relies on the assumption that the objects are in fact young members of the cluster NGC 1333, for which we adopt a distance of 300 pc, consistent with the estimates by de Zeeuw et al. (1999) and Belikov et al. (2002). The J band is the wavelength regime that is normally assumed to be least affected by accretion, disk excess, and magnetic activity. It is found that the BCAH98 temperature versus J-magnitude relation is well approximated by a fourth degree polynomial. Applying this function to the dereddened J-band photometry yields "photometric" temperatures from 2100 to 3400 K.
For 15 objects, the photometric and spectroscopic temperatures agree within ±200 K, confirming our assessment of Teff given in Section 3.3. Four objects (23, 26–28 in Table 2) have photometric temperatures 800–1200 K lower than the ones from the spectroscopy, which can be explained with being background objects. Assuming intrinsic colors for dwarf stars from the 1 Gyr isochrone in the BCAH98 model tracks puts their distances at 360–950 pc. The remaining objects have offsets of 200–500 K between the two values, and in most cases the photometric temperatures are too low. One possible explanation is an age spread in the cluster. As shown by Winston et al. (2009), the members of NGC 1333 are significantly dispersed in the H–R diagram, possible indicating an age spread from <1 Myr to several megayears. Furthermore, the model tracks have well-documented uncertainties in this mass and age regime (Baraffe et al. 2002).
For two objects, 23 and 26, there is a clear discrepancy between our spectroscopic temperatures of 3800 and 3900 K and the spectral types of M2.6 and M4.2 derived by Wilking et al. (2004), which would imply temperatures of only 3500 and 3300 K, respectively. As pointed out above, these are likely to be background objects. The K-band index for spectral typing used by Wilking et al. (2004) gives significantly earlier spectral types for giants than for dwarfs (about M0 or earlier for these two objects). These types would be consistent with our effective temperatures. Thus, these two objects could be red giants in the background of NGC 1333. However, assuming the intrinsic giant colors from Bessell & Brett (1988), this would put them as an unreasonably large distance of 30 kpc for spectral type M0. A significantly earlier spectral type is at odds with our spectroscopy. Thus, the nature of these objects remains uncertain.
4.2. Cluster Membership
For the likely BDs in our sample (see Table 1), the best evidence for youth and thus cluster membership is given by the shape of the H-band peak in the spectra. For substellar objects, the H-band peak appears to be gravity sensitive. Low gravity and thus youth is signified by a distinctly sharp peak, as opposed to the more rounded peaks seen in old objects (Kirkpatrick et al. 2006). The same characteristic is also seen in the available model spectra (Allard et al. 2001).
All 19 sources with effective temperatures of 3000 K or lower listed in Table 1 show a sharp peak. As an example, we show four of them in comparison with published spectra for field dwarfs of similar spectral type from the NIRSPEC Brown Dwarf Spectroscopic Survey (McLean et al. 2003) in Figure 9(left panel). The difference in the shape of the H-band feature is obvious. Particularly, the slope on the red side of the peak is significantly steeper in our objects. On the other hand, our spectra agree well with those of young BDs in Taurus, taken from Muench et al. (2007), as shown in Figure 9 (right panel).

Figure 9. Spectra of VLM objects in NGC 1333 from Table 1 (solid) in comparison with spectra of field dwarfs from the NIRSPEC Brown Dwarf Spectroscopic Survey (left panel; McLean et al. 2003) and with young BDs in Taurus (right panel; Muench et al. 2007). The field dwarfs are from bottom to top Wolf 359 (M6), VB 10 (M8), LHS 2065 (M9); the Taurus BDs are from bottom to top MHO 4 (M7), KPNO 1 (M7.5), and KPNO 5 (M8.5). The objects in NGC 1333 have a significantly "sharper" peak than the field dwarfs, but are well matched by the young Taurus BDs. To account for the higher extinctions in NGC 1333, the literature spectra have been reddened to AV = 5 mag.
Download figure:
Standard image High-resolution imageStatistically, we do not expect a significant contamination with late field M dwarfs in our sample in Table 1. According to the data compiled in Caballero et al. (2008), the space density of M6–7 dwarfs is 4.9 × 10⁻³ pc−1 and drops steeply to 1.3 × 10⁻³ pc−1 for M8–9. Our sample covers an area of about 200 arcmin2 which corresponds to ∼1.5 pc2 at the distance of NGC 1333. In a cone with this footprint and 300 pc height we expect about one M6–M9 field dwarf. Thus, for the M6 or later objects in Table 1 the contamination by field objects is negligible.
We conclude that the >M5 objects identified in this survey ("probable" members in Table 1) are in fact young substellar members of the cluster NGC 1333. For the earlier type stars ("possible members" in Table 2), significant contamination by field dwarfs or giants is more likely, as their space density is larger and the H-band signature of youth is less pronounced. Further evidence for youth comes from the fact that many of our objects show mid-infrared color excess indicative of the presence of circumstellar material, as discussed in Section 4.5, and from the spatial clustering around the main cloud core in NGC 1333, see Section 4.4.
4.3. Masses
We estimate the masses of the probable BDs in our sample by comparing the effective temperatures and the dereddened J-band photometry with the theoretical model tracks for an assumed age. Considering the uncertainties in model tracks and object ages, we refrain from deriving masses for individual objects. Instead, we focus on establishing the approximate mass limits in our sample.
The range of effective temperatures in this sample is 2500–3000 K. Comparing directly to the 1–3 Myr tracks from BCAH98 yields masses of 0.02–0.1 M☉. The result is very similar for the COND03 and DUSTY00 tracks. If some objects are younger than 1 Myr, they will be slightly more massive for a given temperature. Taking into account 200 K uncertainty in our temperature estimate, the lowest mass limit becomes 0.012–0.015 M☉, according to the COND03 and DUSTY00 tracks. Based on the dereddened J-band photometry, the mass range in our BD sample is 0.006–0.1 M☉ for the 1 Myr isochrones, or 0.012–0.2 M☉ for the 5 Myr isochrones. Note that the latter values are not significantly affected by uncertainties in the distance to NGC 1333. The most recent distance estimates agree fairly well at ∼300 pc with an uncertainty of about 30 pc (de Zeeuw et al. 1999; Belikov et al. 2002), corresponding to ±0.2 mag or about 10% in object mass.
There are two reasons why we put more trust in the mass estimates obtained from the temperatures. (1) Luminosities depend much more on age than temperatures on the pre-main-sequence, thus the mass estimates based on temperatures are more robust against age spread, which may be significant in this cluster (Winston et al. 2009). The Lyon evolutionary tracks are known to underestimate object masses derived from fluxes. For example, for the young BD eclipsing binary in ONC (Stassun et al. 2006) the BCAH98 tracks predict a mass of 0.055–0.075 M☉ based on its J-band magnitude (assuming a distance of 435 ± 55 pc); the actual system mass is 0.09 M☉. More indirectly, Mohanty et al. (2004) find that the models predict BDs to be too bright in J band at a given mass, by up to 1 order of magnitude. Both tests indicate that the masses from the model tracks, when inferred from luminosities, may systematically underestimate the actual masses by a factor of up to 2.
Based on the comparison of effective temperatures with the three model tracks, we conclude that the lowest mass limit in our BD sample is 0.012–0.02 M☉. At the high mass end, the mass range of the objects in Table 1 extends across the substellar boundary into the stellar regime. Thus, a few of these objects may turn out to be VLM stars, instead of BDs.
4.4. Spatial Distribution and Binarity
In Figure 10, we show the position of our photometric candidates and the confirmed members of NGC 1333 in relation to the gas in the cloud and other samples of cluster members. As already pointed out in Section 3.1, the photometric candidates show a strong clustering toward the center of the cloud. On one side, this can be explained with the increasing extinction, causing background objects to appear heavily reddened. On the other hand, as seen in the plot, YSOs candidates selected from Spitzer mid-infrared excess (Gutermuth et al. 2008) show the same strong clustering, indicating that the distribution of members is very compact and does not extend to the edges of our survey field. Our spatial coverage thus fully encompasses the extent of the cluster. The small number of photometric candidates in the outer region is also evidence for the lack of contamination in our sample, as argued in Section 4.2.

Figure 10. Spatial coverage of our survey and distribution of objects. Crosses are all candidates selected from optical photometry with i'>18.5 mag (Section 3.1), diamonds the spectroscopically confirmed objects, triangles the confirmed BDs from Wilking et al. (2004). The plusses are YSO candidates selected from Spitzer data without spectroscopic confirmation from Gutermuth et al. (2008). The underlying contours show the distribution of 13CO from the J = 1 − 0 map by Ridge et al. (2006). The dotted and dashed lines show the area covered in our optical and near-infrared survey, respectively.
Download figure:
Standard image High-resolution imageAll our spectroscopy fields were located within ±0.1 arcmin of the cluster center, an area which contains the majority of known cluster members. As discussed in Section 3.3, the "success rate" in finding late-type sources is 58% (21/36) in the photometrically selected sample, indicating a substantial rate of contamination among the remaining photometric candidates. Due to our limited spatial coverage in the spectroscopy, we cannot give constraints on the nature of the (few) candidates outside the cloud core. Since the surface density of members drops rapidly with increasing distance from the center, we expect most of the outlying candidates to be foreground or background sources.
The very compact distribution of BDs agrees with the more detailed analysis for the distribution of stars in NGC 1333 provided by Gutermuth et al. (2008), who report a steep decline of the density of members for cluster radii larger than 0.3 pc (0 06 at 300 pc). Gutermuth et al. (2008) also identify clear asymmetry in the distribution, attributed to the structure of the underlying cloud. This all suggests that the cluster has experienced only limited dynamical evolution and most of the population in the core is in fact very young. Ages ranging from less than 1 Myr to 3 Myr have been inferred from H–R diagram fitting for the objects concentrated in the molecular cloud gas (Winston et al. 2009).
We visually checked the deep i'- and z'-band images for companions within a radius of 30 of each of our spectroscopically confirmed M-type sources. The lower separation limit for the detection of companions is set by the seeing and the rejection criterion for elongated objects (see Section 2.1); we determine this to be at ∼10 (Section 2.1), corresponding to a separation range of 300–1000 AU for the distance of NGC 1333. No companions were found. For substellar objects in NGC 1333 (Table 1) this gives a 2σ upper limit for binarity in the given separation range of 19%.
A number of recent studies clearly show a dearth of wide binaries in the VLM regime. In the central parts of the Cha I star-forming region, for example, a binary fraction of 11% is found for separations >20 AU (Ahmic et al. 2007), and zero systems with separations larger than 50 AU. Our result in NGC 1333 is consistent with these findings (for a review on VLM binarity see Burgasser et al. 2007).
4.5. Spitzer Photometry
The NGC 1333 cluster is part of the Perseus star-forming complex and thus has been covered by the Spitzer Legacy Program "From Cores to Disks" (C2D, PI: Neil Evans). From the C2D source catalogs (version S13, full Perseus catalog) we obtained the Infrared Array Camera (IRAC) and MIPS fluxes from 3.6 to 24 μm for all objects in Tables 1 and 2. Out of 28 sources, 16 are well detected with error bars <0.2 mag in all four IRAC bands. The standard IRAC color–color diagram is shown in Figure 11. The color range for Class II objects is indicated. Eleven objects clearly show IRAC color excess, and thus are likely to be surrounded by circumstellar material. Ten of them are also safely detected at 24 μm, with magnitudes >2 mag larger than at 8 μm. This confirms youth and thus membership to NGC 1333 for a large fraction of our sample. Objects with mid-infrared color excess are marked with "ex" in Table 1. The disk fraction in our (small) sample is ∼70%, consistent with previous findings for stars (83%; Gutermuth et al. 2008) and BDs (74%; Wilking et al. 2004).

Figure 11. IRAC color–color diagram for the 16 objects from Tables 1 and 2 which have error bars <0.2 mag in all four bands. The approximate locus of the Class II objects is overplotted as a dashed square (Allen et al. 2004). Typical photospheric colors for late-type objects are around zero. Eleven objects have colors consistent with color excess due to circumstellar material.
Download figure:
Standard image High-resolution imageThe C2D data have recently been analyzed in detail by Gutermuth et al. (2008). In this survey, all 11 objects with disks in our sample are classified as Class II sources. Two more objects in our sample (23 and 25) are Class II objects with disks according to Gutermuth et al. (2008), but their IRAC errors are too large to be considered for Figure 11.
5. THE MASS FUNCTION IN NGC 1333
5.1. Ratio of Stellar to Substellar Members
Combining our survey with the ones by Wilking et al. (2004) and Greissl et al. (2007) there is now a substantial sample of spectroscopically confirmed BDs in NGC 1333. We use this to improve the constraints on the ratio of low-mass stars to BDs, a number recently measured for a range of other star-forming regions. We identify 19 objects as young M6 or later sources. Seven of them have previously been confirmed by Wilking et al. (2004). Their survey has found nine more objects with M6 or later spectral type, which we consider to be good candidates for BDs. The study by Greissl et al. (2007) has limited spatial coverage (3 arcmin2), but finds five more objects in this spectral regime. All these objects are located close to the cluster center, which points to a high likelihood of being members. Thus, the current total census of likely BDs in this cluster is 33. As there are a number of additional photometric candidates in the cluster region (see Figure 10) that lack spectroscopic confirmation, this number should be treated as a lower limit; on the other hand, as pointed out in Section 4.3, some of these objects may be slightly above the substellar boundary.
To constrain the number of stellar members in NGC 1333, we use the Spitzer selected sample by Gutermuth et al. (2008), which identifies 137 likely YSOs in the cluster, 93 of them also have 2MASS near-infrared magnitudes. From these, 91 are in our survey area. We dereddened the photometry for these objects based on the J−K color, using the procedure discussed in Section 3.2. Comparing the dereddened J-band magnitude with the BCAH98 evolutionary track allows us to select objects in a given mass range. In this sample, 38 sources are likely to have masses between 0.08 and 1 M☉. Based on the spectroscopic follow-up by Winston et al. (2009), this sample is unlikely to have significant field star contamination. Spitzer only finds objects with disks; in fact, the cluster is known to harbor a significant population of disk-less T Tauri stars (Winston et al. 2009). Assuming a disk fraction of 83% (Gutermuth et al. 2008) gives a total number of ∼50 stellar cluster members in this mass regime. Taking into account the uncertainties in our mass cuts, this number may be inaccurate by up to 20%.
Although the Spitzer sample of stars has been identified in a way not comparable to our own BD survey (and the two other ones in the literature), we are confident that it gives a robust estimate for the number of stars in this mass range in the cluster. The range of extinctions and the spatial distribution are similar in the Spitzer sample and the BD sample. Moreover, the disk fraction among the BDs is similar to the one seen in stars (Section 4.5). Thus, in terms of evolutionary state and spatial coverage the stellar sample is representative.
From these numbers, we estimate the ratio of (low-mass) stars (0.08 < M < 1.0 M☉) to BDs (0.015 < M < 0.08 M☉) in NGC 1333 to be 50/33, i.e., 1.5 ± 0.3. This can directly be compared with the literature. In an IMF analysis for seven different star-forming regions (not including NGC 1333), Andersen et al. (2008) find this ratio to be 3.3–8.5 depending on the region, with the lowest values measured in the ONC, NGC 2024, and Chamaeleon. Taking into account the 1σ uncertainty in their values, the minimum ratio becomes 1.9 in Chamaeleon. These numbers are still significantly higher than the ratio in NGC 1333, pointing to an overabundance of BDs in NGC 1333 by a factor of 2–5.
This result is consistent with the previous findings for this cluster. Wilking et al. (2004) derived a ratio of stars (0.08 < M < 1.0 M☉) to VLM objects (0.04 < M < 0.1 M☉) of 1.1 ± 0.80.4, and considered this to be a lower limit, i.e., fully comparable with our result. (This would become 2.0, if they assume an age of 1 Myr instead of 0.5 Myr.) Including their lower mass BDs, Greissl et al. (2007) find a value of 0.64 ± 0.38 for this ratio. Although these numbers are not fully comparable with our estimate, due to the slightly different mass ranges, they are all clearly lower than the respective ratios in other regions. Thus, the mass function of NGC 1333 has a clear anomaly with an overabundance of BDs relative to low-mass stars.
5.2. The Minimum Mass in NGC 1333
The depth and large spatial coverage of our survey allows us to put meaningful limits on the abundance of planetary-mass objects in NGC 1333 in comparison with other regions. Recapitulating, the coolest objects in NGC 1333 have effective temperatures of 2500 K, corresponding to masses of 0.012–0.02 M☉. That means that there is no planetary-mass object in our spectroscopically confirmed sample. In the following, we will compare with the mass completeness limits in our survey and the frequency of planemos in other star-forming regions. Given the considerable uncertainties in the model evolutionary tracks in this age and mass regime, we will follow two guidelines. (1) Conversion from effective temperatures to masses is more reliable than from luminosities (or magnitudes) to masses, see the discussion in Section 4.3. (2) We prefer to base the arguments on relative comparisons consistently using the same model tracks, and do not place strong emphasis on the absolute mass values.
Our coolest and lowest mass objects in the spectroscopic sample have Teff = 2500 ± 200 K, i.e., we rule out the presence of objects with 2200 K or cooler in this group of objects. The five faintest confirmed BDs have 22.5–23.5 mag in the i' band with extinctions AV ≲ 10 mag. Our completeness limit is 24.7 mag in i' band, i.e., 1.2–2.2 mag deeper than the faintest confirmed objects. Based on the 1 Myr isochrones from COND03 and DUSTY00, an object that much fainter than one with 2500 K has 0.006–0.01 M☉, with Teff of 2000–2200 K, i.e., for AV ≲ 10 mag we are complete down to ∼0.008 M☉. For AV ≲ 5 mag the limit becomes ∼0.004 M☉ or 1800 K. Thus, our survey is complete to masses significantly below the low-mass limit of the confirmed objects. In fact, six objects with i' magnitude >23.5 mag have been observed spectroscopically and turned out not to have an H-band peak, indicative of low temperatures.
As discussed in Section 1, previous surveys with comparable depth (in terms of masses) have been carried out in the σ Ori cluster, the ONC, and the Chamaeleon I star-forming region (Cha I). The most recent census of the substellar population in σ Ori, published by Caballero et al. (2007), lists 34 objects with 0.015 < M < 0.08 M☉ and 12 with lower masses. In their mass scale, the planetary-mass objects have spectral types M9 or later, indicating that they exhibit lower temperatures (and thus lower masses) than the coolest objects in NGC 1333. The numbers of BDs and planemos in σ Ori are robust against the particular choice of evolutionary tracks and uncertainties in age, distance, and reddening. According to Caballero et al. (2007), the census is expected to contain ∼6 contaminating foreground dwarfs, ∼4 of them in the planemo regime. Thus, the best estimate for the planemo versus BD ratio in σ Ori is 8/32 or 25 ± 98%. This is a lower limit, as the survey does not show any cutoff of the mass function down to 0.006 M☉, their completeness limit. According to recent adaptive optics observations in the core of σ Ori (Bouy et al. 2009) the survey by Caballero et al. (2007) might miss a number of objects with planetary masses close to the bright central star.
In the ONC, the highly variable extinction makes an unbiased census difficult. In the largest spectroscopic survey in the substellar regime to date, Weights et al. (2009) have confirmed ∼38 objects with masses at or below the hydrogen-burning limit. According to their mass estimates, 17 objects in this sample have 0.015 < M < 0.08 M☉ and 20 objects have even lower masses. The masses are based on a comparison of the observed H–R diagram with evolutionary tracks (including COND03 and BCAH98, as used in this paper) and thus rely partly on spectroscopic temperatures, comparable to our estimates in NGC 1333. Deriving the mass limits from the dereddened H-band photometry, as given by Weights et al. (2009), yields 15 objects with 0.015 < M < 0.08 M☉ and 14 below (assuming a distance of 450 pc). Their analysis of the mass function thus supports the presence of a planetary-mass population in the ONC.
There are two alternative estimates for the frequency of planemos in the ONC in the literature: according to Lucas et al. (2006), 7.5% (1%–14%) of the total population in the cluster have a mass of 0.003–0.015 M☉, where the wide range of possible values is mostly a reflection for age uncertainty. Lucas et al. (2005) find a drop by factor 2 in the mass function at the deuterium-burning limit, a deviation from a flat mass function in the substellar regime. Their upper limit for the fraction of planemos in the total cluster population is 10%–13%.
For Cha I, the most up-to-date unbiased census by Luhman (2007) yields a total cluster population of 226 objects, among them 28 BDs, and four sources with masses below the deuterium-burning limit. Based on these numbers, the planemo fraction is 2% relative to the total population and the planemo versus BD ratio is 17%. In this region, however, the census is complete only down to ∼0.01 M☉. The mass function is flat in the substellar regime and does not show indications for having reached the minimum mass (Luhman 2007). Thus, the total number of planemos may be twice as high, depending on the cutoff of the IMF. In fact, Luhman & Muench (2008) published one more source in the planetary-mass regime based on a Spitzer mid-infrared detection.
Based on these literature findings, we can estimate the expected number of planemos in NGC 1333. This is illustrated in Figure 12. In our survey area, we find 19 BDs, seven of them previously identified by Wilking et al. (2004). In addition, the area covers 14 more substellar objects from other sources (see Section 5.1). With one exception, all these BDs exhibit optical extinctions <10 mag. For this extinction value, our survey is complete down to ∼0.008 M☉. The number of confirmed planetary-mass objects in the survey limits is zero. Based on the total sample covered in our spectroscopic observations, the 1σ upper limit for this non-detection is about two objects.

Figure 12. Mass distribution of BDs in NGC 1333 (hatched histogram) and the deficit of planetary-mass objects. The three labeled data points show the predicted number of planemos in NGC 1333 based on the surveys in σ Ori, the ONC, and in ChaI. The error bars correspond to 1σ. The x-values for these three data points roughly correspond to the completeness limits in the literature surveys for these regions. The non-detection of planetary-mass objects points to a deficit of objects in this mass regime compared with other clusters. The dotted lines refer to our detection limit for Av = 5 and 10 mag.
Download figure:
Standard image High-resolution image
Assuming the planemo versus BD ratio as seen in the σ Ori cluster, we would expect to find 8 ± 3 planemos in NGC 1333, which has to be considered a lower limit, given the fact that the bottom of the mass function has not been found yet in σ Ori. The ONC survey by Weights et al. (2009) predicts a number of planemos roughly comparable with the number of BDs, i.e., ∼33 for NGC 1333. Based on the two other estimates, and assuming a total cluster population of ∼150 in NGC 1333 (Gutermuth et al. 2008) we would expect <20, most likely ∼10 planemos in the cluster. Based on the mass function in Cha I, we expect 6–12 planemos in NGC 1333. Thus, all estimates for the expected number of planetary-mass objects are as high as or higher than the 2σ limit derived from our survey in NGC 1333. We conclude that NGC 1333 likely shows a deficit of planemos compared with all other star-forming regions where comparable survey depth has been reached.
We arrive at essentially the same conclusion when we use temperatures instead of masses: the coolest object in our survey has an effective temperature of 2500 K, corresponding to a spectral type of M9 (Luhman et al. 2003). In σ Ori, there are 12 objects known with later spectral types (Barrado y Navascués et al. 2001; Martín et al. 2001); a significant fraction of the low-mass population is not spectroscopically confirmed. The ONC survey by Weights et al. (2009) gives 17 sources with >M9 and effective temperatures <2500 K, about half of their total sample of substellar objects. In the ChaI census, the four objects with planetary masses all have spectral types later than M9. In summary, working with the maybe more robust effective temperatures instead of masses does not change the expected numbers of planetary-mass objects in any significant way.
Our result is similar to one of the conclusions by Greissl et al. (2007): although they were sensitive to objects fainter than those surveyed previously by Wilking et al. (2004), they did not detect lower mass objects, only sources with higher extinction. We confirm this finding based on a much larger survey with a factor of ∼300 more area coverage, encompassing the full extent of the cluster. This result is even more remarkable when we take into account that the number of BDs in NGC 1333 is unusually high, as pointed out in Section 5.2.
The best explanation for this outcome is a significant drop in the mass function in NGC 1333 around the deuterium-burning limit, corresponding to effective temperatures below 2500 K in this cluster. Compared with other clusters like σ Ori and the ONC, the mass function of NGC 1333 does not extend down to planetary masses. As our survey is deeper than previous work in other regions and covers a substantial sample of objects with follow-up spectroscopy, this is the best evidence so far for a cutoff in the mass function at VLMs. It is plausible that our survey has detected the minimum mass limit for star formation in this particular cluster, at around 0.012–0.02 M☉.
With the currently available sample, this is a 2σ result and thus needs further verification. If confirmed, it would point to strong environmental dependences in the mass function, particularly the minimum mass of star formation. In all other regions surveyed with comparable depth, the mass function extends well below 0.01 M☉, while the spectrum is truncated at ∼0.012–0.02 M☉ in our target cluster NGC 1333.
At this point it is not clear what could cause a change in the minimum mass by a factor of 2 or more. Compared with regions as diverse as σ Ori, the ONC, and ChaI, there is no evidence that NGC 1333 is different in any significant way in terms of initial conditions, dust properties, or metallicity. Based on the currently available census, the object density in NGC 1333 is slightly higher than in Cha I and significantly higher than in σ Ori. While the number of low-mass members in all three regions is probably comparable and in the range of 150–250 objects, the radii of their distribution are 0.3 pc in NGC 1333, 0.5–0.7 pc in Cha I, and 3–5 pc in σ Ori (Sherry et al. 2004; Luhman 2007; Gutermuth et al. 2008). Bonnell et al. (2008) recently suggested that BDs in clusters form through the gravitational fragmentation of infalling gas. This could explain the overabundance of substellar objects in the denser NGC 1333, but would also predict a higher number of planetary-mass objects. On the other hand, the differences in density in those three regions are, as explained in Section 4.5, most likely a consequence of progressing dynamical evolution and thus a difference in age, and not necessarily in initial conditions. Thus, a consistent interpretation of our findings in terms of the formation process is currently lacking.
6. CONCLUSIONS
We present the first results of the SONYC project, short for "Substellar Objects in Nearby Young Clusters." We have obtained deep optical and near-infrared observations of the NGC 1333 cluster using the Subaru 8 m telescope. From the photometry in the i', z', J, and K band, we have selected BD candidates. Follow-up infrared spectroscopy, also obtained at Subaru, is used to verify their nature. In the following, we summarize the most important findings of this survey.
-
1.In our large-scale, optical+near-infrared imaging survey, we reach completeness limits of 24.7 in i' band, 20.8 in J band, and 18.0 in K band. In terms of object masses for members of NGC 1333, this corresponds roughly to mass limits of 0.008 M☉ for AV ≲ 10 mag and 0.004 M☉ for AV ≲ 5 mag, based on the COND03 and DUSTY00 evolutionary tracks. The spatial coverage of our survey is 0.25 deg2 and includes all previously identified cluster members as well as the central cloud cores NGC 1333-A and -B.
-
2.From the optical photometry, we select 196 objects with i'–z' colors in the range as expected for substellar and planetary-mass cluster members, including a number of previously identified BDs. 36 of these objects are chosen for follow-up spectroscopy. This spectroscopic sample does not show any bias in spatial coverage or optical/near-infrared colors with respect to the full photometric candidate sample.
-
3.Using MOS in H and K band, we confirm 28 objects close to the cluster center as late-type sources, 21 of them from the sample selected from photometry. This is based on water absorption features in the H band. The extinctions, derived from the J−K color, for the 28 objects cover the range from 0 to 13 mag. Fitting model spectra to the observed ones, we find effective temperatures of 2500–3900 K with a typical uncertainty of ±200 K.
-
4.From the 28 confirmed late-type objects, 19 have effective temperatures of 3000 K or lower (and spectral types M6 or later). Combined with the clear indications for youth, this classifies them as probable substellar members of NGC 1333. Of this subsample, seven have been previously identified by Wilking et al. (2004). The remaining nine objects in the confirmed sample are possible stellar members, which likely exhibit significant contamination by field dwarfs/giants.
-
5.The confirmed objects are strongly clustered around the core of NGC 1333. The majority of them shows evidence for disks in Spitzer mid-infrared colors. Both findings additionally provide evidence for membership.
-
6.Combining our survey results with previous studies, the current census of spectroscopically confirmed BDs in NGC 1333 is 33. For comparison, the number of stellar members with masses between 0.08 and 1 M☉ is in the range of 50. This indicates a clear overabundance of BDs in NGC 1333; the ratio of substellar to stellar members with masses below 1 M☉ is 1.5 ± 0.3, lower by a factor of 2–5 than in all other previously surveyed regions.
-
7.The low-mass limit of the confirmed BDs in NGC 1333 is 0.012–0.02 M☉, but the completeness limits are at significantly lower masses. Thus, although being able to do so, we do not find a population of planetary-mass objects in this cluster. Scaling from literature results in other regions (σ Ori, ONC, Cha I), we would expect to find 8–10 "planemos," but we find none. This indicates a cutoff in the mass spectrum around the deuterium-burning limit in NGC 1333; we have possibly reached the minimum mass of the IMF.
-
8.If confirmed, these last two findings point to regional/environmental variations as a major factor in determining the number of VLM objects and the minimum mass of the IMF. It is particularly difficult to explain simultaneously the overabundance of BDs and the deficit of planetary-mass objects in NGC 1333. Thus, our results present a challenge for the current theoretical framework of star formation.
-
9.The mass spectrum in the BD and planetary-mass regime necessarily relies on evolutionary models. Although we have made every effort to derive robust conclusions, we cannot get around the fact that evolutionary models lack reliable calibrations at the lowest masses. This is particularly true at young ages, where initial conditions may affect mass estimates, for example. Thus, the lack of objects with T < 2500 K in NGC 1333 could in principle be a sign of an unusual mass function or unusual initial conditions, or both. On the other hand, testing and calibrating the models require that we first identify objects at these masses and ages. Making relative comparisons between substellar populations of different clusters could also help. Our SONYC project is an important step toward achieving these goals.
The authors thank the Subaru staff, specifically the supporting astronomer Ichi Tanaka, for assistance during the observations. We are grateful to Elaine Winston for making a preprint of her work available to us prior to publication. Our referee, Paul Clark, has provided a constructive and helpful report. The research was supported in part by grants from the Natural Sciences and Engineering Research Council (NSERC) of Canada and an Early Researcher Award from the province of Ontario to R.J.
Note added in Proof. Recently the first planetary mass objects have been identified in the Upper Scorpius star forming region (UpSco, age 5 Myr) by Lodieu et al. (2007, 2008), adding to the available observational constraints on the substellar IMF. While our target NGC 1333 is a compact cluster, UpSco is an extended OB association. Depending on the spectral type versus mass conversion, the number of spectroscopically confirmed PMOs is 8–16. Given that the number of confirmed BDs in UpSco is ∼70 (see Slesnick et al. 2006), the current value for the ratio of planemos versus BDs is 10%–22%. This is likely to be a lower limit, because the surveys are not complete at the low-mass end. Based on this ratio we would at least expect 3–8 planemos in NGC 1333. At face value, this confirms the PMO deficiency in NGC 1333 we have reported in this paper, but more work is required to assess completeness limits and mass ranges, before a firm conclusion can be made.
Footnotes
-
*
Based on data collected at Subaru Telescope, which is operated by the National Astronomical Observatory of Japan.
-
5
IRAF is distributed by the National Optical Astronomy Observatory, which is operated by the Association of Universities for Research in Astronomy, Inc., under cooperative agreement with the National Science Foundation.
-
6
-
7
Interactive Data Language.
-
8