
Abstract
The reliability of tropical cyclone intensity estimates for the western North Pacific is assessed in the context of wind–pressure relationships. Four best-track datasets compiled in the International Best Track Archive for Climate Stewardship (IBTrACS) are compared to assess the data consistency. Over the past 20 yr period (1991–2010), apparent interagency discrepancies in the archived tropical cyclone intensities are found. Heavy reliance upon operational wind–pressure relationships may reduce subjective biases at the cost of potential loss of tropical cyclone natural variability. Given that the intercomparisons are performed based upon a set of identical tropical cyclones, the differences in operational wind–pressure relationships and in the mapping of satellite tropical cyclone intensity classification for these relationships are presumably critical causes of the interagency discrepancies. This result calls for imperative refinement of current satellite-based tropical cyclone intensity estimates and reanalysis of historical tropical cyclone best-track archives for the basin.
Export citation and abstract BibTeX RIS
1. Introduction
Reliability of tropical cyclone (TC) intensity estimates has become a critical issue in understanding temporal trends in TC activity (Landsea et al 2006, Kossin et al 2007). The uncertainty of TC intensity estimates can arise from both inconsistent and changing measurement techniques as well as new operating practices over the years. The issue of data consistency is more complicated in the western North Pacific (WNP) in which TCs are frequently tracked by numerous agencies. Significant differences in TC intensity and temporal variability have been found among various best-track archives in the basin (Song et al 2010, Ren et al 2011). Interagency differences in operational practices have been claimed to be responsible for inconsistencies of intensity estimates to a certain extent (Kamahori et al 2006, Nakazawa and Hoshino 2009). Although the operational practices vary by agency, the Dvorak technique (Dvorak 1975, 1984) remains a fundamental method for determining TC intensity. The Dvorak technique is basically a method for assigning TC intensity classification based on cloud pattern recognition using visible and infrared satellite imagery. The intensity classification, which is termed as current intensity (CI) number, is then related to TC maximum sustained wind (MSW) speed and minimum sea level pressure (MSLP) using a CI–wind–pressure lookup table. Various CI versus MSW/MSLP tables have been developed to account for different averaging periods of winds and wind–pressure relationships (WPRs) over time. A comprehensive review of the technique and its evolution has been given by Velden et al (2006a, 2006b). In the absence of routine aircraft reconnaissance, operational agencies place heavy reliance upon Dvorak technique for estimating TC intensity. The Dvorak technique is inherently subjective because of the cloud image pattern recognition and empirically derived rules regarding the vigor and organization of convection surrounding the storm center. Forecaster judgment on pattern or rule interpretation can lead to discrepancies between different agencies estimating the same TC. Furthermore, the application of WPR has been inconsistent across the operational agencies in the WNP. The intensive dependency of these WPRs can also lead to discrepancies in intensity estimates. Given that implementation of the Dvorak technique can vary by agency, the interagency differences in reported best-track intensities need to be investigated and documented. This letter focuses on the interagency discrepancies in the context of the relationship between archived MSW and MSLP because it is the conjunction of the two parameters that virtually reveals the construction of TC intensity based upon the Dvorak technique and the associated WPR at each agency.
2. Data
The study utilizes the best-track archives compiled in the International Best Track Archive for Climate Stewardship (IBTrACS) to illustrate the interagency differences in the relationship between the MSW and MSLP for the WNP. The IBTrACS provides a comprehensive global best-track compilation dataset to facilitate intercomparisons among different operational agencies by collocating TC reports in time and position (Knapp et al 2010, Kruk et al 2010). The IBTrACS v03r03 version is used, in which the sources for best-track archives in the WNP are the JMA, CMA, HKO, and JTWC (see the appendix for abbreviations). TCs in the WNP were often tracked by as many as four agencies. In this study, interagency differences are analyzed by comparing MSW and MSLP records for identical cyclones for the period from 1991 to 2010, in which routine aircraft reconnaissance is not available for the WNP. A brief introduction to the best-track archives is given in the supplemental material (available at stacks.iop.org/ERL/7/024015/mmedia).
During the period from 1991 to 2010, 652 individual TCs were identified in the IBTrACS, of which 463 were co-tracking by all the agencies (table 1). Only the MSW and MSLP records carried by these co-tracking TCs are used in this letter. From the first decade to second decade, the numbers of records from each agency decrease consistently in response to a reduction of the reported TC number. It should be noted that interannual/decadal variability in TC numbers is a normal feature. Agencies report TC intensity differently from each other, and in some instances only MSW or MSLP was reported such that numbers for both MSW and MSLP records could be different. The MSW and MSLP records that were concurrently reported by all the agencies were then sorted out separately, and were further paired off based upon their reporting time. In the first decade, the JTWC was excluded in this data sorting process because the agency only reported MSW during the period. A total of 9485 pairs of MSW and MSLP records were eventually sampled from the 463 co-tracking TCs. The pairing of the maximum MSW and minimum MSLP at the peak strength of each individual TC were further sorted, from which 463 pairs of peak strength were obtained for each agency except for the JTWC. Although the JTWC did not report MSLP in their best-track archives before 2001, the MSLP at peak strength of each individual TC was tabulated in their Annual Tropical Cyclone Reports (ATCR). For the JTWC, only 219 pairs of peak strength were derived from the pairing records in 2001–10, while those for 1991–2000 were taken from the ATCR.
Table 1. Summary of the best-track data acquired from the IBTrACS. The allTC indicates numbers of all the TCs identified in IBTrACS, coTC indicates the numbers of co-tracking TCs. The nW and nP represent the numbers of reported records for MSW and MSLP, respectively. The coREC indicates the concurrent records in all four archives, and coPair indicates the pairing MSW and MSLP in coREC. See text for details.
| Year | TC number | JTWC | JMA | CMA | HKO | coREC | |||||||||||
|---|---|---|---|---|---|---|---|---|---|---|---|---|---|---|---|---|---|
| allTC | coTC | allTC | coTC | ||||||||||||||
| allTC | coTC | nW | nP | nW | nP | nW | nP | nW | nP | allTC | coTC | allTC | coTC | nW | nP | coPair | |
| 1991–2000 | 365 | 244 | 11958 | 0 | 9878 | 0 | 6047 | 9534 | 6039 | 9494 | 7836 | 7251 | 6614 | 6235 | 4896 | 5951 | 4896 |
| 2001–2010 | 287 | 219 | 7771 | 7694 | 6844 | 6819 | 5560 | 8508 | 5540 | 8432 | 7498 | 6941 | 5861 | 5577 | 4591 | 5426 | 4589 |
| 1991–2010 | 652 | 463 | 19729 | 7694 | 16722 | 6819 | 11607 | 18042 | 11579 | 17926 | 15334 | 14192 | 12475 | 11812 | 9487 | 11377 | 9485 |
3. Results
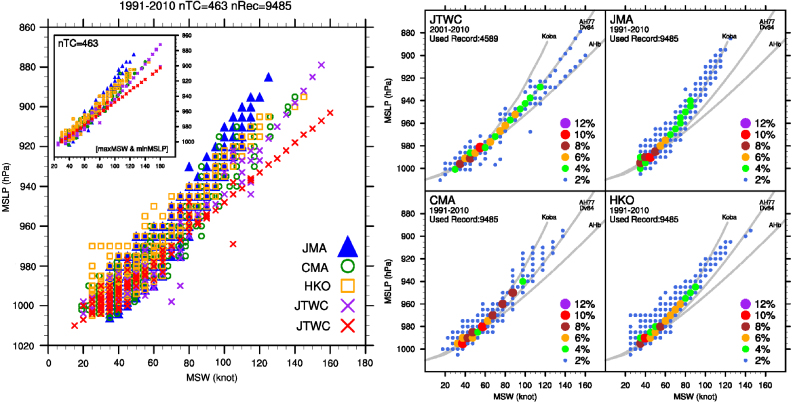
There are considerable scatters found in the archived MSW and MSLP data, and the scatter patterns differ among agencies (figure 1, left panel). The MSW and MSLP at the peak strength present similar distributions for each agency, suggesting that sampling of TC peak strength can also represent the full range of intensities given sufficient sample size. Significant interagency discrepancies are found in the stronger intensity range, given a particular MSLP value the JTWC tends to report a larger MSW whereas the JMA tends to report a smaller MSW. In general, MSW values derived from the CMA and HKO lie in between those from JTWC and JMA. Such discrepancies may be partly attributed to averaging period for winds: both the JMA and HKO report 10 min averaged MSW, while the JTWC and CMA report 1 min and 2 min averaged MSWs, respectively. By converting all non-ten-minute MSWs into 10 min MSWs, the large discrepancies in the stronger intensity range can be diminished to some extent, whereas the apparent interagency differences in the scatter patterns remain (see figure A1 in the supplemental material available at stacks.iop.org/ERL/7/024015/mmedia). Therefore, the differences in MSW averaging period are inadequate to fully account for the interagency discrepancies in the relationship between the archived MSW and MSLP.

Figure 1. (Left) Scatter plot of the MSW versus MSLP taken from the four best-track datasets. Sample includes 463 TCs with 9485 pairing records for every agency except that for JTWC, which comprises 219 TCs 4589 records. Data from JTWC were divided into two periods: 2001–6 and 2007–10, and are denoted by purple and red crosses, respectively. The inner sub-graph on the upper-left corner shows a similar scatter plot, but for the maximum MSW and minimum MSLP at the peak strength of each co-tracking TC. (Right) Scatter plots of the frequency of binned MSW and MSLP for each agency. The 9485 pairing MSLP and MSW were binning into 5 knot and 5 hPa bins and were then sampled in pairs for counting the occurrence. The frequency is the percentage of the occurrence of the paring MSLP and MSW at each bin. The color-filled circles indicate frequency spans as shown in the legend. Also shown are the operational WPRs derived by Atkinson and Holliday (1977), Dvorak (1984), Koba et al (1991); see supplemental material (available at stacks.iop.org/ERL/7/024015/mmedia) for further information. Shown in the plots are 10 min MSWs for both JMA and HKO, but 1 min and 2 min MSWs for JTWC and CMA, respectively.
Download figure:
Standard imageThe interagency differences in the scatter patterns are further demonstrated by the occurrences of the binned pairing of MSW and MSLP (figure 1, right panel). The higher frequencies of occurrences reveal that every agency closely follows its operational WPR for estimating TC intensity in most cases. A brief introduction of the WPRs implemented by these agencies is provided in the supplemental material (available at stacks.iop.org/ERL/7/024015/mmedia). The JMA has been using the Koba WPR since 1990 (Koba et al 1991). The JTWC applied the WPR derived by Atkinson and Holliday (1977; hereafter AH77) before 2007, and has been using a revised version of AH77 thereafter. The CMA seems to utilize the Dvorak WPR (Dvorak 1984) in most cases. The HKO appears to refer to the Koba WPR for TCs of weak to medium strength, whereas it tends to use the Dvorak WPR for stronger TCs. Given the monotonic relationship in these operational WPRs that assigns a unique value of wind for a particular pressure, the apparent spread of the archived MSW against MSLP for any given agency may be attributed to the flexibility in operational practices as well as the availability of auxiliary measurements. The scatter patterns of JTWC archives, however, express rather rigid adherence to the operational WPRs as compared with others.
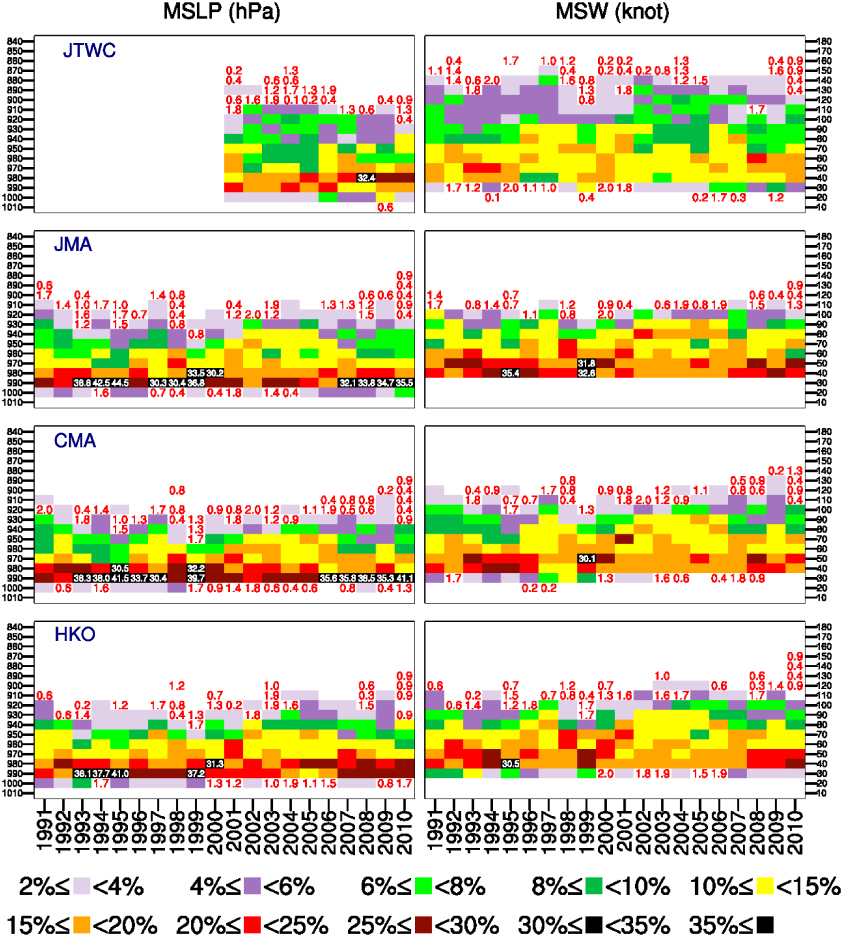
The next question thus arises as to whether the pairing MSW and MSLP records show interannual covariability for each best-track archive. The interagency differences in this context also need to be explored. To answer the queries, the annual occurrences of the archived MSW and MSLP are counted. In figure 2, the distributions of annual occurrences are illustrated by columns, and the interannual variations are portrayed by rows. For each year, distributions are skewed to the lower intensities as expected, indicating that lower intensities occur more frequently than intense strengths. Moreover, there is interannual covariability between the occurrences of archived MSW and MSLP in particular for lower intensities. Such covariability is again indicative of the heavy reliance upon operational WPR. Overall, similar features are found among the best-track archives. The first decades are characterized by high occurrences of low intensities almost throughout the period. However, reductions in the occurrences of these low intensities and increases in medium intensities are recognized in the first half of the second decade. This consistency among the four best-track archives is nevertheless suggestive of the robustness of the Dvorak-based implementation in all agencies. It is the variations in the higher intensities for each year (e.g. the records for which the frequencies of occurrence are less than 2%) that may yield interagency differences. Specifically for the second decade, the pairing MSW and MSLP generally present a consistent upward trend in high intensities for every agency except for the JTWC. For the JTWC, different variations in high intensities are found in MSW and MSLP. The inconsistencies between the trends of MSW and MSLP in high intensities are observed during the period from 2007 to 2010 when the JTWC was using the revised operational WPR. For this period, the interagency discrepancies between the JTWC and all the others can be attributed to a certain extent to the difference in operational practices.

Figure 2. Temporal variations in the frequencies of the MSLP (left) and MSW (right) for each agency in the period of 1991–2010. The pairing MSLP and MSW were binning into 10 knot and 10 hPa bins and were then sampled separately for counting their occurrence in each year. The frequency is the percentage of the occurrence of the MSLP or MSW at each bin in each year. The number indicates the percentage of the occurrence at each MSLP or MSW bin, and the color-filled square represents the frequency spans as shown in the legend. Here, the distribution of the occurrence in each single year is illustrated by each column, and the interannual variation in each bin is illustrated by each row.
Download figure:
Standard imageFigure 3 summarizes the aforesaid interagency discrepancies in TC intensities, as well as that in the interdecadal variations. Considering that the interagency differences in lower intensities are less distinguishable from that in intense TC strength, a new subset is compiled to avoid the statistics of the sample distribution toward the more frequently sampled lower intensities. The new subset comprises 3224 pairs of MSW and MSLP records that reach typhoon strength for each agency, of which the pairing records were also concurrently reported by all agencies. The new subset of JTWC only comprises 1759 pairs of records. Here, a record that reaches typhoon strength is defined as a pairing of MSW above 65 knot and MSLP below 975 hPa. Two statistics, namely the median and inter-quartile range, are used here to picture the sample distribution of each best-track archive. The inter-quartile range is the distance between the upper quartile (75th percentile) and the lower quartile (25th percentile). The means and standard deviations were also examined (not shown). For each individual archive, the means of MSW and MSLP are slightly above and below the corresponding medians respectively, indicating that the entire sample distribution is skewed to the higher intensities. The inter-quartile ranges, which comprise 50% of data samples, fall within the ranges of ±one standard deviation. This would ensure the avoidance of biases toward extremes of which the data uncertainties are presumably high.

Figure 3. Distributions of MSW plotted against that of MSLP from the four agencies in the first (left) and second (right) decades during the period from 1991 to 2010. The plot shows the median values (symbols) as well as the inter-quartile ranges (lines) both for MSLP and MSW. Vertical and horizontal lines represent the inter-quartile ranges of MSLP and MSW, respectively. The upper panels show the distribution of a subset of the 9485 pairing records that comprises records reaching typhoon strength (MSW > 65 knot and MSLP < 975 hPa), whereas the lower panels show the distribution of the peak strength of every individual TC that reaches typhoon strength. See text for details. Shown in the plots are 10 min MSWs both for JMA and HKO, but 1 min and 2 min MSWs for JTWC and CMA, respectively. For JTWC, the median value of MSLP in the first decade is given as the median value of the corresponding peak strength subset just for plotting purposes. .
Download figure:
Standard image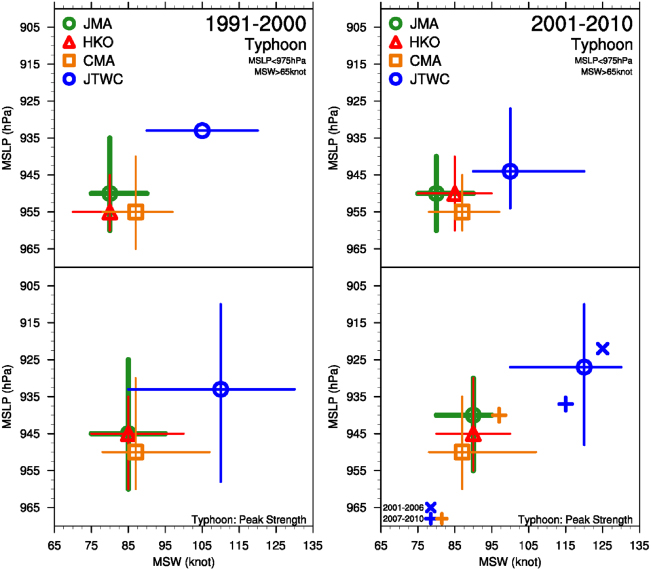
Apparently, the medians of the JTWC present highest intensities such that the archive is well distinguishable from others (figure 3, upper panels). The largest inter-quartile ranges are also found in the JTWC archived MSW and MSLP. The features are even more discernible as revealed by the peak strength (figure 3, lower panels). The skewness of data within inter-quartile ranges is less consistent among archives thus is omitted here for brevity. There are marked overlaps between the JMA and HKO, and a consistent underestimation of TC intensities both in terms of MSW and MSLP as compared with the JTWC. The distribution of MSWs from the CMA appears to lie in between those from the JTWC and the JMA/HKO. While the CMA provides 2 min averaged MSW, the agency tends to report MSWs that are much weaker than those from the JTWC. Indeed, the distribution of MSWs from the CMA is close to those of 10 min averaged MSWs from the JMA and HKO. Moreover, the CMA tends to report weakest TC intensities at the peak stage during the second decade as compared with the other agencies. Overall, no systematic difference can be found between the CMA and the JMA/HKO. Regarding the interdecadal variations in these archives, the inter-quartile ranges decrease in general for all agencies, and the medians for full-range records remain unchanged or just vary within a range of 5 knot or 5 hPa. It is noted that interannual/decadal variability in TC intensity is a normal feature and is beyond the scope of this letter.
Given that the operational WPR of JTWC has been changed since 2007, the statistics for subsets of periods 2001–6 and 2007–10 are also examined. Apparent differences in the median values between the two sub-periods are observed both for the JTWC and CMA. Therefore their median values are denoted as a cross sign and plus sign on the plot for the sub-periods 2001–6 and 2007–10 respectively. The medians of the first sub-period for CMA are about the same as the decadal medians therefore the cross sign for CMA is omitted on the plot. From the first half to the second half of the last decade, apparent decreases in TC intensities can be found in the JTWC archive, along with just small changes in inter-quartile ranges. The CMA archive, however, shows marked increase in TC intensities as indicated by the upward and rightward shift in the medians of MSLP and MSW. Given that the archives of JMA and HKO do not present similar TC intensity variations in the period, the alteration in operational WPR should account for the abrupt change in sample distributions of JTWC. However, the reasons for the variations in the CMA archive remain unclear.
The TC intensities, in terms of both MSW and MSLP, of the JTWC are generally stronger that those of the other agencies. The discrepancies between the JTWC and the others are very evident as revealed by the peak stage subsets. Both the availability of aircraft reconnaissance and the wind averaging period have been generally used for interpreting the apparent interagency discrepancies in MSW (e.g. Kamahori et al 2006, Kossin et al 2007, Nakazawa and Hoshino 2009, Song et al 2010, Ren et al 2011). The JTWC archive was further examined by converting the 1 min MSW into 10 min MSW, yet the discrepancies between the JTWC and others remain (see figure A3 in the supplemental material available at stacks.iop.org/ERL/7/024015/mmedia). While Knapp and Kruk (2010) have indicated that the interagency differences in the MSW speeds seem reconcilable as there are linear conversions among these archives, the present work indeed shows that wind speed conversion itself cannot fully account for the data inconsistency. Moreover, the interagency discrepancies in MSLP are also large and should not be attributed to the different wind averaging period used in these agencies. It is noted that in addition to the difference in the operational WPRs, the mappings of the satellite classification (i.e. the CI number) for the wind/pressure tables (WPRs) are also different by agency. For instance, in the original Dvorak table the values of MSLP assigned for the CI numbers of 4.5 and 6.5 are 966 hPa and 914 hPa, respectively. However, the corresponding MSLP values are given as 965 hPa and 926 hPa in the table of CI versus WPR used by JMA. These Dvorak tables can be found in the supplemental material (available at stacks.iop.org/ERL/7/024015/mmedia). As a result, the agencies could start from the same satellite classification but then use different mappings of the satellite classification for values of MSW/MSLP. Because the CI–MSW and CI–MSLP relationships are different, the resulting wind/pressure values will be apparently different. Such interagency discrepancies appear to be irreconcilable. Nonetheless, not until the operational intensity estimates at these agencies are fully documented can the aforesaid interagency discrepancies be completely interpreted.
4. Conclusion
The letter is aimed at estimating the reliability of TC intensity values for the WNP in the context of wind–pressure relationships. Four best-track archives compiled in the International Best Track Archive for Climate Stewardship (IBTrACS) are compared to assess the data consistency. Over the past 20 yr (1991–2010), apparent interagency discrepancies in the archived tropical cyclone intensities are found. While the wind speed conversions may reduce the data inconsistency to some degree, the differences in scatter patterns of MSW against MSLP remain. The TC intensities of the JTWC are generally stronger than those of the other agencies. This evident interagency discrepancy cannot be fully accounted for by the wind speed conversion given that MSLP is also a parameter to interpret TC strength. An abrupt decrease in the TC intensity is also found in the JTWC archive, the most widely used TC historical dataset, in the past decade. The value of MSW is almost never measured operationally. It is generally inferred from satellite using the Dvorak technique, and may be supplemented by other MSLP measurements when available. The use of operational WPR is thus critical for the estimate. The TC WPR implies coupling among TC structure and environment. Heavy reliance upon operational WPR may reduce subjective biases at the cost of potential loss of TC nature variability. Given the considerable scatters found commonly in archived TC wind–pressure data, both Knaff and Zehr (2007) and Holland (2008) have argued that the monotonic form of most existing WPRs is inadequate to account for the diversity of coupling between wind and pressure. Considering the intercomparisons are performed based upon a set of identical TCs, the differences in operational WPRs and in the mapping of satellite tropical cyclone intensity classification for these relationships are presumably critical causes of the interagency discrepancies. The result calls for imperative refinement of current satellite-based tropical cyclone intensity estimates and reanalysis of historical tropical cyclone best-track archives for the basin. Consistency of a best-track dataset is particularly important for detecting climate trends in TC activity (Landsea et al 2006, Kossin et al 2007). A more consistent historical tropical cyclone dataset will be a great benefit to the climate research and risk assessment study. Furthermore, incorporation of TC historical best-track information can also improve representations of TCs in the global reanalysis fields (Schenkel and Hart 2012).
Acknowledgments
The author acknowledges the IBTrACS team for constructing and providing the global TC dataset. This work was partly supported by the Postdoctoral Program of the National Central University, Taiwan. The author also thanks the three reviewers and an Editorial Board member for their comments that improved the clarity of this letter.
Appendix
List of acronyms
-
AH77Wind–pressure relationship derived by Atkinson and Holliday (1977)
-
ATCRAnnual Tropical Cyclone Report
-
CI
-
CMAChina Meteorological Administration's Shanghai Typhoon Institute
-
HKOHong Kong Observatory
-
IBTrACSInternational Best Track Archive for Climate Stewardship
-
JMAJapan Meteorological Agency (as a Regional Specialized Meteorological Center in Tokyo)
-
MSWMaximum sustained wind
-
MSLPMinimum sea level pressure
-
TCTropical cyclone
-
WNPWestern North Pacific
-
WPRWind–pressure relationship