


ABSTRACT
We report the detection of strong and compact molecular line emission (in the CO J = 3–2, 4–3, 6–5, 7–6, 13CO J = 3–2, HCN, and HCO+ J = 4–3 transitions) from a cometary-shaped object (Carina-frEGG1) in the Carina star-forming region (SFR) previously classified as a photoevaporating protoplanetary disk (proplyd). We derive a molecular mass of 0.35 M☉ for Carina-frEGG1, which shows that it is not a proplyd, but belongs to a class of free-floating evaporating gas globules (frEGGs) recently found in the Cygnus SFR by Sahai et al. Archival adaptive optics near-IR (Ks) images show a central hourglass-shaped nebula. The derived source luminosity (about 8–18 L☉), the hourglass morphology, and the presence of collimated jets seen in Hubble Space Telescope images imply the presence of a jet-driving, young, low-mass star deeply embedded in the dust inside Carina-frEGG1. Our results suggest that the true nature of many or most such cometary-shaped objects seen in massive SFRs and previously labeled as proplyds has been misunderstood, and that these are really frEGGs.
Export citation and abstract BibTeX RIS
1. INTRODUCTION
Massive stars have a profound effect on stars that subsequently form in their vicinity, thus significantly influencing the initial mass function (IMF), the star formation efficiency, and the total extent and mass of star clusters. In massive star-forming regions (SFRs), the ionizing radiation from OB stars can produce photoevaporating protoplanetary disks or proplyds, the most famous of which lie in the Orion Nebula (e.g., O'Dell et al. 1993; Ricci et al. 2008). This radiation can also progressively ionize dense knots of nearby molecular material, forming evaporating gaseous globules (EGGs; Hester et al. 1996).
A new class of tadpole-shaped objects was recently discovered near the Cygnus OB2 association (Sahai et al. 2012b, hereafter SMC12; Wright et al. 2012, hereafter Wetal12)—the most massive young association within 2 kpc of the Sun, located inside the Cygnus-X giant molecular cloud complex where considerable star formation is ongoing. The strong morphological similarity between these objects and proplyds led Wetal12 to conclude that these objects are "a unique class of photoevaporating, partially embedded, young stellar objects (YSOs)" and unlikely to be EGGs, from a comparison of the large fraction (about 70%) of these objects that appear to contain one or more young stars with the much lower value for M16 (15%). However, SMC12 concluded that Wetal12's argument is not compelling, as several unconsidered variables, including density and mass of parent cloud, and strength of radiation field and winds, can affect this fraction. In addition, the sizes of these objects (20,000–110,000 AU) are huge compared to the Orion proplyds (40–350 AU: Henney & O'Dell 1999). Recognizing the importance of these issues, SMC12 carried out molecular-line observations that reveal dense molecular cores associated with two of these objects (the Tadpole and the Goldfish), with total masses of cold (∼10–15 K) molecular gas exceeding 1–2 M☉, strongly favoring the EGG hypothesis. These data also conclusively rule out the proplyd hypothesis since a proplyd is highly unlikely to harbor such a substantial mass of molecular gas. To date, no dense molecular medium has yet been found toward any known proplyd, and the low Orion proplyd disk masses (0.003–0.07) M☉ (Mann & Williams 2010), derived from continuum observations of dust emission, imply even smaller masses for the circumstellar material being evaporated from them. Finally, the evaporated material is likely to be primarily atomic, not molecular.
SMC12 concluded that these tadpole-shaped objects are dense, star-forming molecular cores that originated in the Cygnus cloud and are now being photoevaporated by ultraviolet radiation from the Cyg OB2 No. 8 cluster located ∼10 pc to their northwest, and shaped by ram pressure of strong, nearby wind sources. Continuing observations of 13CO and 12CO lines, as well as high-density tracers such as the J = 3–2 lines of HCO+, HCN, HNC, and N2H+ in a sample of about 20 such objects have strongly supported the SMC12 hypothesis (Sahai et al. 2012a).
The discovery of these free-floating evaporating gas globules (hereafter frEGGs) raises a fundamental question for star and protoplanetary disk formation in massive SFRs: what fraction of the previously classified proplyd objects are really EGGs? The distinction between frEGGs and proplyds is quite important, because in the former case, star formation and protostellar accretion are still very much under way, whereas proplyd disks are in much later stages in which accretion no longer has a strong effect on the protostellar evolution, although planet formation may still be in progress. We have therefore begun a study of the molecular gas content of objects previously classified as proplyds with the goal of determining their true nature. Smith et al. (2003; SBM03) found many objects in the Carina SFR from ground-based optical emission-line images that closely resemble the proplyds found in Orion, and concluded that the former were proplyds as well in spite of their significantly larger (factor ∼5) sizes. In this Letter, we report single-dish molecular line observations of one such representative object from the set of 12 reported in SBM03, 104632.9-600354 (hereafter Carina-frEGG1), and show that our data rule out the proplyd hypothesis for this object and support its frEGG nature.
2. OBSERVATIONS & RESULTS
We observed Carina-frEGG1 (Figure 1) in the CO J = 3–2, 4–3, 6–5 and 7–6 lines, the 13CO J = 3–2 and the HCN and HCO+ J = 4–3 lines, and the continuum at 350 and 870 μm using the Atacama Pathfinder Experiment (Güsten et al. 2006) 12-m telescope4 during 2012 June 23–26. Pointing was checked on nearby η Car, and found to be generally accurate within 3''.

Figure 1. Images of Carina-frEGG1 at different wavelengths (a) Spitzer IRAC 8 μm, (b) HST F658N narrowband (F658N filter: Hα+[N ii]), and (c) VLT/NACO Ks (2 μm). The panels are 14 6 × 244, with north up (as shown). Inset at right-middle shows a schematic of the hourglass-shaped central nebula (two possible curves are shown for the southern lobe's poorly defined western periphery); inset at bottom-left corner shows an enlarged view (189 × 196) of the central source.
Download figure:
Standard image High-resolution imageThe dual-color receiver FLASH+ (Heyminck et al. 2006) with wideband (4 GHz width) sideband-separating (2SB) SIS mixers was used to map the CO J = 4–3 and 3–2 lines simultaneously in a regular raster with 10'' increments. Two XFFT spectrometers, each with a bandwidth of 2.5 GHz, but with 64 × 103 (32 × 103) channels for the low (high frequency) bands, were used to process a total intermediate frequency (IF) band of 4 GHz (with 1 GHz of overlap). The weaker 13CO(3–2), HCN, and HCO+(4–3) lines were observed toward the nominal center position only.
The dual-color heterodyne array receiver CHAMP+ (Kasemann et al. 2006), providing 2 × 7 beams, was used to map the CO J = 6–5 and 7–6 lines simultaneously, over a 40'' × 40'' region that was oversampled with 4'' spacing (with all seven beams of each sub-array covering a given grid position repeatedly). Two FFT spectrometers, each with a bandwidth of 1.5 GHz and 1024 channels, were connected to the individual beams, processing a total IF band of 2.6 GHz (with 400 MHz overlap). The observations took place during excellent weather conditions with zenith precipitable water vapor, PWV, of 0.7 (0.4) mm in the low (high) frequency band.
The spectra were taken with position-switching against an absolute reference position. Calibration was performed regularly every 10–15 min with a cold liquid nitrogen (LN2) load and an ambient temperature load. The data were processed with the APEX real-time calibration software (Muders et al. 2006). Beam sizes θb (FWHM) and main beam coupling efficiencies (ηmb) are given in Table 1.
Table 1. Molecular Line Observations of Carina-frEGG1
| Line | Tmba | TRb | VLSR | Line Width | Line Flux | ηmb | θb |
|---|---|---|---|---|---|---|---|
| (K) | (K) | (km s−1) | (km s−1) | (K km s−1) | ('') | ||
| CO(3–2) | 1.1 | 33.0 | −22.7 | 3.2 | 3.5 | 0.69 | 17.8 |
| 13CO(3–2) | 0.4 | 13.4 | −22.6 | 2.2 | 0.96 | 0.69 | 18.6 |
| CO(4–3) | 1.9 | 31.8 | −22.7 | 3.1 | 5.4 | 0.60 | 13.1 |
| CO(6–5) | 2.1c | 34.9 | −22.6 | 3.5 | 7.3c | 0.38 | 8.7 |
| CO(7–6) | 1.7c | 28.6 | −22.3 | 4.1 | 8.1c | 0.31 | 7.7 |
| HCO+(4–3) | 0.17 | ... | −22.6 | 2.0 | 0.37 | 0.69 | 17.3 |
| HCN(4–3) | 0.11 | ... | −22.8 | 1.8 | 0.21 | 0.69 | 17.4 |
Notes. aMain-beam line intensities. bSource brightness temperature derived by applying beam-dilution corrections. cDerived from peak position in map convolved to 131 resolution.
Download table as: ASCIITypeset image
We obtained continuum observations at 350 (870) μm using the bolometer array receivers LABOCA (SABOCA) (Siringo et al. 2009, 2010), with a spatial resolution of 78 (19'') on 2012 September 10 (September 11) and PWV ∼ 0.5 (0.3–0.4) mm. Data reduction was done with the BOA software (Schuller et al. 2009) following standard procedures, including iterative source modeling.
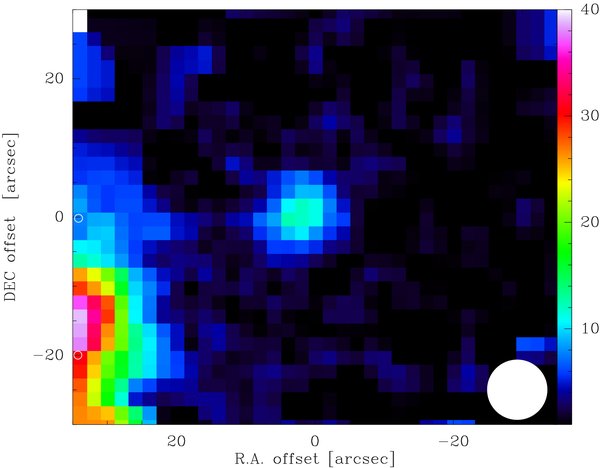
The CO maps show the presence of a compact molecular globule (Figure 2), that appears unresolved at our highest angular resolution of 77 in the CO J = 7–6 line. The line profiles (Figure 3(a)) show a central core and weak wings, extending to about ±6 km s−1 from the line center as seen in our highest signal-to-noise profile (J = 4–3), and suggesting the presence of an outflow. Gaussian fits to the line profiles result in a width (FWHM) of about 3.1 km s−1 in the 3–2 and 4–3 lines, and 3.5 and 4.1 km s−1 in the 6–5 and 7–6 lines, respectively, implying an increase in the wing contribution relative to the core for the higher excitation lines. The J = 4–3 and 3–2 maps show the presence of low-level extended background or foreground emission around the compact source seen in the J = 6–5 and 7–6 lines, but the contribution is small (≲10%).

Figure 2. Map of Carina-frEGG1 in CO J = 6–5 emission integrated over the central 5 km s−1 of the line profile, obtained with the APEX-12 m. White circle shows the 87 beam size (FWHM).
Download figure:
Standard image High-resolution image
Figure 3. (a) Molecular line emission from Carina-frEGG1 observed with the APEX-12 m. The line profiles have been rescaled and shifted vertically for clarity. Weak absorption features in the CO J = 4–3, 6–5 and 7–6 lines at Vlsr ∼ −11 to −16 km s−1 are due to emission in the reference position used for the position-switching. Intensities have not been corrected for main-beam efficiencies. (b) Observed radiation temperatures of CO lines from Carina-frEGG1 (filled black squares) with 20% error bars, and a two-component model fit (open black squares). The lower temperature, optically thick component at 40 K (red) fits only the 3–2 and 4–3 intensities; a second, hotter (∼150 K), optically thin component (blue) is needed to fit the low and high-J line intensities simultaneously.
Download figure:
Standard image High-resolution imageIn order to determine relative line intensity ratios, we convolved the CO 6–5 and 7–6 maps to the 4–3 map resolution, 131 (we chose not to convolve these maps to the larger 3–2 beam size because of possible contamination from the extended cloud to the east). Since the source is unresolved, the source's average brightness temperature in each line, TR, depends on its emitting area. Conservatively assuming that all CO lines come from the dark region within the (ionized) bright periphery seen in the optical image, which has an area of 11.7 arcsec2, we derive the radiation temperature, TR, for each of the observed CO lines (Table 1). Using the online tool for the non-LTE radiative transfer code (RADEX; Van der Tak et al. 2007) to model these, we find that the 4–3 and 3–2 data can be fitted with a column density N(H2) ∼ 1022 cm−2 and kinetic temperature Tk ∼ 40 K (assuming a CO/H2 abundance ratio fCO ∼ 10−4), but the 6–5 and 7–6 line intensities predicted by this one-temperature model are weaker than observed (Figure 3(b)), even with a model density high enough ( ∼ 106cm−3) to thermalize these lines, implying the presence of gas with Tk ≫ 40 K in the globule. The "excess" emission in the 6–5 and 7–6 lines requires a hotter (≳ 150 K) optically thin component assuming it has the same emitting area as the cooler component. The observed CO 6–5, 7–6 and HCO+ 4–3 line intensities imply the presence of high gas densities, ≳ 5 × 105 cm−3.
We derived the molecular mass in Carina-frEGG1 from its 13CO J = 3–2 flux, using Equation (5) of Thi et al. (2001), who used it to estimate protoplanetary disk gas masses from observations with the James Clerk Maxwell 15 m telescope (14'' beam). We modified this equation to account for the APEX-12 m's larger beam size. We estimate a "beam-averaged" 13CO J = 3–2 optical depth, τ13 = 0.56 from the 12CO/13CO line intensity ratio, assuming Tex(13CO) = Tex(12CO) = 40 K. Assuming a 13CO/H2 abundance ratio f13CO = 10−6 and distance 2.3 kpc (e.g., Smith et al. 2004), we find a molecular mass of Mmol = 0.35 M☉.
A 196 ± 65 mJy continuum source was detected at 350 μm, and an upper limit (40 mJy, 1σ) obtained at 870 μm. Assuming the 350 μm flux is due to optically thin thermal emission from dust at the same temperature as we derive above for the bulk of the gas (i.e., Td = Tk ∼ 40 K), a gas-to-dust ratio of 100, and a dust opacity κ(350 μm) = 10 cm2 g−1 (e.g., Miettinen et al. 2012), we derive a total mass of ∼0.1 M☉. The discrepancy between this value and the mass derived from CO emission is not significant, considering the uncertainties in the adopted values of Td, κ(350 μm) and f13CO.
3. ADDITIONAL MULTI-WAVELENGTH DATA
We have compiled multi-wavelength data on Carina-frEGG1 using optical (HST), near-IR (2MASS and ESO) and mid-IR (Spitzer) data archives. Carina-frEGG1 was imaged with the Advanced Camera for Surveys (ACS) in Hα as part of a large-scale survey of the Carina SFR (Smith et al. 2010), and shows a dark tadpole-shaped globule (of length ∼19,000 AU) with a bright periphery. The Hubble Space Telescope (HST) Hα (+[N ii]) image of Carina-frEGG1 shows a narrow, highly collimated jet (Figure 1(b))—Smith et al. (2010) discuss this jet (HH1006) and infer that the putative central star related to the jet is not detected, presumably as a result of being deeply embedded within dust in the object.
The Two Micron All Sky Survey (2MASS) images show a faint red compact source in the J, H, and Ks bands. Using two nearby field stars to register the ACS and 2MASS Ks images, we find that the source is located at R.A. = 10h46m32 97, decl. = −60°03m535, roughly in the middle of the dark waist. We also retrieved archival Ks images (ESO prog. ID 076.C-0874 (A)) toward Carina-frEGG1 taken with the NAOS+CONICA instrument on the ESO-VLT-U4 on 2006 January 10, with a total field-of-view 278 × 278. Using standard IRAF packages, we generated a flat-field from these images using median-averaging and applied it to each of the seventeen 30 s dithered exposures, which were then registered to a common reference frame and averaged. The angular resolution in the final image is about 01 as measured from radial intensity cuts of several neighboring field stars. We find an extended faint hourglass-shaped nebula with a bright central region (Figure 1(c)) with its symmetry axis aligned with that of the jet. The northern lobe is much brighter than the southern one, implying that the hourglass structure is tilted such that its northern lobe is closer to us. In the central region of the northern lobe, which has a wide-U shape with its apex located at the center of the hourglass (inset, Figure 1(c)), the brightest feature is a small spur (of length ∼50 AU) oriented at a position angle, PA ∼ 12°. The spur is located slightly west of the jet axis and is not aligned with the latter (which is oriented at PA ∼ −10°).
The Spitzer IRAC images (3.6–8 μm) show an elongated morphology similar to Carina-frEGG1's optical shape (but at much lower angular resolution). As in the Ks image, the shape is bipolar, with the northern half significantly brighter than the southern one. No central star can be seen in the Ks image or the IRAC images, implying that the former is deeply embedded within a dusty disk with very high line-of-sight extinction. In longer-wavelength Spitzer images (i.e., ⩾24 μm), no isolated source can be detected at the location of Carina-frEGG1 due to bright extended emission from foreground or background clouds in its vicinity.
We have determined the spectral energy distribution (SED) of Carina-frEGG1 from 1.25 to 870 μm. We carried out aperture photometry on the J- and H-band 2MASS images (since the 2MASS catalog gives only a Ks magnitude). Aperture photometry for IRAC (channels 1–4) and MIPS (channel 1) is provided by Povich et al. (2011; source PCYC 1173 in their catalog). Since no compact source can be seen in the MIPS 24 μm image at Carina-frEGG1's location, we treat Povich et al.'s measured 24 μm magnitude of 3 as an upper limit. The SED (Figure 4) continues to rise toward 350 μm—the longest wavelength for which we have a detection—indicating a substantial amount of emission from cool circumstellar dust in the far-IR range. For the source luminosity, we integrate the SED up to 350 μm to estimate L ≳ 8 L☉; a rough upper limit of 18 L☉ is provided by assuming flux values equal to the upper limits at 24 and 870 μm. The observed fluxes have been corrected using an interstellar extinction AV = 1.5, that is intermediate between the value (1.78) given by Smith et al. (2004) and that (1.3) computed from a numerical algorithm provided by Hakkila et al. (1997), which estimates the AV of a galactic source from its longitude, latitude and distance.

Figure 4. Spectral energy distribution of Carina-frEGG1. Errors in the photometry are taken to be ±15% for data from 1.24 μm to 8 μm, and ±30% at 350 μm; black triangles show upper limits. The black curve shows the best-fit YSO model assuming interstellar medium (ISM) extinction AV = 1.5 and distance 2.3 kpc, and the gray lines show subsequent good fits. The dashed line shows the stellar photosphere from the best-fit model in the absence of circumstellar dust (but including ISM extinction).
Download figure:
Standard image High-resolution image
We modeled the SED using an online tool that applies least-squares fitting to find the best models from a large set of pre-computed YSO models having accretion disks and infall envelopes with biconical outflow cavities (Robitaille et al. 2007). The ten best-fit models (Figure 4) have relatively low stellar effective temperatures (2660–3800 K), stellar masses (0.1–0.65 M☉) and total luminosities (stellar+disk-accretion: 6–10 L☉) and small ages (1100–3000 yr). These results support our inference of a deeply embedded YSO in Carina-frEGG1, but must be treated with some caution. Although the inferred inclination of the outflow to the line-of-sight, i = 18°, together with the large circumstellar extinction (AV ≳ 100), is qualitatively consistent with the strong asymmetry in the brightness of the bipolar lobes in the Ks image, the projected opening angle of the cavity, θproj = tan −1(tan θc/sin i) = 23°(θc ∼ 7°, is the intrinsic opening angle in these models) appears smaller than observed.
4. DISCUSSION
Our detection of a substantial mass of molecular gas in Carina-frEGG1 shows that it is a frEGG, not a proplyd (as classified previously). Since the discovery of proplyds in Orion, many studies have reported the finding of proplyds in other SFRs with massive stars (e.g., Balog et al. 2006; Koenig et al. 2008; Brandner et al. 2000). However, in light of this study and that in SMC12, it is likely that the true nature of many or all of these objects has been misunderstood, and that some (or even all) of the previously classified proplyds in Carina, especially those which are significantly larger in size than the Orion proplyds, are really frEGGs.
Both proplyds and EGGs are unique probes of the effects of the harsh UV radiation and strong stellar winds from massive stars on the formation of lower-mass stars in their vicinity, thus it is of fundamental importance to be able to distinguish between these two classes. EGGs are most likely the surviving high density concentrations in a cloud as the ionization front sweeps through it. The formation of a protostar in the EGG may be induced by the compression of the latter by the high-pressure environment of the ambient H ii region, supplemented by the even higher pressure at the high-density ionization front at the EGG surface. Photoevaporation sculpts out and exposes an EGG while the stellar object(s) in it is (are) still accreting mass, ultimately freezing the protostellar mass distribution at a relatively early stage in its evolution (e.g., Hester et al. 1996). FrEGGs like Carina-frEGG1 (where the presence of collimated jets, central hourglass structure, and low luminosity, all imply the presence of a jet-driving, young, low-mass star) or the Tadpole (SMC12) represent the early formation phase of low or intermediate-mass stars within a massive SFR. Proplyds may represent the endpoint of evolution of such frEGGs, or may form coevally with the OB stars in these SFRs. Whether other objects like Carina-frEGG1 are proplyds or EGGs has major implications for the star formation rate and the IMF in the massive SFRs where they are found. Outstanding questions that future research should address are the following: (1) do proplyds represent the evolutionary endpoint of frEGGs and (2) is the formation of stars that may form in frEGGs induced by the surrounding H ii region's compression or were such stars already in the process of formation in the relatively dense cloud cores that are susceptible to becoming frEGGs?
We thank F. Schuller, APEX, for his help with the LABOCA and SABOCA observations and data reduction. R.S.'s contribution to the research described here was carried out at JPL, California Institute of Technology, under a contract with NASA and partially funded through the internal Research and Technology Development program.
Footnotes
-
4
APEX is a collaboration between the Max-Planck-Institut fuer Radioastronomie, the European Southern Observatory, and the Onsala Space Observatory.