


Abstract
Influenza-like illness data are collected via an Influenza Sentinel Provider Surveillance Network at the state level. Because participation is voluntary, locations of the sentinel providers may not reflect optimal geographic placement. The purpose of this study was to determine the “best” locations for sentinel providers in Iowa by using a maximal coverage model (MCM) and to compare the population coverage obtained with that of the current sentinel network. The authors used an MCM to maximize the Iowa population located within 20 miles (32.2 km) of 1–143 candidate sites and calculated the coverage provided by each additional site. The first MCM location covered 15% of the population; adding a second increased coverage to 25%. Additional locations provided more coverage but with diminishing marginal returns. In contrast, the existing 22 Iowa sentinel locations covered 56% of the population, the same coverage achieved with just 10 MCM sites. Using 22 MCM sites covered more than 75% of the population, an improvement over the current site placement, adding nearly 600,000 Iowa residents. Given scarce public health resources, MCMs can help surveillance efforts by prioritizing recruitment of sentinel locations.
Controlling seasonal influenza is a major public health priority. In the United States alone, influenza causes an estimated 36,000 deaths annually (1). Influenza is not a nationally notifiable disease in the United States (2), but an influenza surveillance program does exist (3); one of its components includes tracking influenza-like illness. One major goal of influenza-like illness surveillance is to detect changes in influenza activity. Earlier detection, for example, can improve both clinical and public health responses.
Every week during influenza season, members of the Influenza Sentinel Provider Surveillance Network report the total number of patients they have seen, along with the number with influenza-like illnesses (i.e., a temperature of 37.8°C or higher and a cough and/or a sore throat without any other apparent cause). Members of this network are recruited from a pool of health care providers who routinely care for patients with influenza (e.g., pediatricians, internists, family practice physicians). Network members represent a conglomerate of individual health care providers, group practices, and hospital-based clinics. As voluntary participants, they are not compensated for their surveillance efforts.
In Iowa, recruitment and primary influenza-like illness data are coordinated at the state level. Because participation is voluntary, the surveillance sites may underrepresent or overrepresent different geographic regions (e.g., rural populations). As a result, the current locations of sentinel providers in Iowa and other US states may not reflect the optimal geographic placement of surveillance sites, leading to biased or simply incomplete information about influenza timing and activity.
Optimal location placement is a common problem encountered by commercial organizations. Such problems are usually called facility location problems; examples include the placement of new retail stores, bank branches, and warehouses (4, 5). Typically, the organization is seeking to maximize revenue or some other prespecified utility function while minimizing associated costs. There are a number of variations of this general problem. For example, in some formulations, a set of facilities already exists, and the goal is to determine the best location for additional facilities according to the prespecified metric. For instance, how does a firm situate an additional warehouse to minimize overall transportation and distribution costs? Another formulation, more pertinent to disease surveillance, maximizes the population within a certain fixed distance given a set number of facilities. Solutions to this particular problem variant, referred to as maximal coverage models, have been used by government agencies to develop infrastructure (e.g., systems for communication or for purification of drinking water) and even to determine the best location for new health care facilities (6). However, to our knowledge, this approach has not been used to assist with infectious disease surveillance.
In theory, increased influenza-like illness surveillance coverage will lead to more accurate and perhaps earlier detection of influenza activity. Thus, the overarching goal of this study was to use location-allocation modeling techniques to find better locations for influenza sentinel providers in the state of Iowa. In this paper, we explore 2 alternative formulations of the problem: a “de novo” formulation (N locations are selected starting from a blank slate) and an incremental formulation (N additional locations are selected to best complement M preexisting locations). Solutions to these problems yield near-optimal sets of influenza sentinel providers in Iowa and can also help improve other statewide surveillance networks (e.g., hospital- or laboratory-based groups).
MATERIALS AND METHODS
Data
The population in each zip code tabulation area (ZCTA) in Iowa was obtained from the 2000 US Census. ZCTAs are defined by the Census Bureau and correspond roughly to postal zip codes, but they have a more regular geographic shape; usually, but not always, zip codes map directly onto like-numbered ZCTAs. Moreover, zip codes may change from year to year, but ZCTAs do not. For this study, we assume that the entire population of a given ZCTA is concentrated at its geographic center.
We created a set of candidate sentinel sites from the physician licensure records of the Iowa Department of Public Health (IDPH) combined with the existing sentinel sites. This set was compiled by the IDPH epidemiologist responsible for coordinating influenza surveillance, and it included the addresses of all emergency medicine, family practice, general medicine, internal medicine, and pediatrics locations.
We used each of the 143 possible sites within unique zip codes as possible sentinel provider locations. Note that the 26 original sentinel locations in the 2006–2007 IDPH–influenza-like-illness network correspond to 22 unique surveillance locations (i.e., zip codes). Four duplicate zip codes were excluded from our analysis. (Because the current system is entirely voluntary, in some cases more than one sentinel site in the same location opted to participate.) Each of the resulting 143 candidate sentinel sites was then assigned to ZCTAs by using the latitude and longitude coordinates of the site's zip code.
Algorithm
We used a greedy algorithm to maximize the number of people in the state who are within a fixed prespecified distance, S, of at least one of the N surveillance sites (this problem is entirely equivalent to minimizing the population that is further than S from any of the N surveillance sites, making for a more straightforward mathematical formulation). The algorithm was proposed by Church and ReVelle (7) as a way to solve this class of maximal coverage location problems.
To find the best sentinel locations, we first constructed a matrix of inter-ZCTA distances using the Euclidean distance between ZCTA centroids. Next, we repeatedly selected additional surveillance sites, each time electing to add the candidate site that maximally increases population coverage within distance S. The algorithm stops when either 1) we have selected the prespecified number of sentinel locations, or 2) we have exceeded the prespecified coverage threshold, given in terms of a percentage of the total population. Note that the same algorithm can be used to solve the incremental version of the problem simply by presetting the selected sites to the original 22 IDPH surveillance sites and then using the greedy algorithm to select additional sites up to the stopping criterion. This algorithm was implemented in R, a statistical programming language (http://www.r-project.org/), which was used to produce all of the results given in this paper.
RESULTS
Figure 1A is a graphic representation of the population distribution in the state of Iowa (total: 2,926,324 people). Figure 1B shows the set of 143 candidate sites, including the 22 existing locations and the possible new sites.
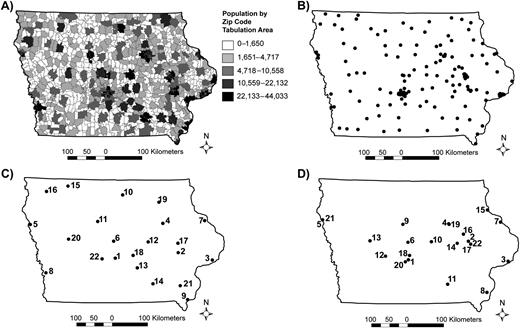
A) The population distribution for the state of Iowa. B) The 143 different possible locations for influenza-like illness sentinel sites. C) The 22 influenza-like illness sentinel locations (based on the 143 sentinel locations) chosen by the authors’ maximal coverage model. The numbers represent the order in which the sites were chosen by the model. D) The 22 Iowa Department of Public Health influenza-like illness sentinel locations for the 2006–2007 influenza season. The numbers represent the order in which the existing sites should have been chosen to maximize coverage.
Figure 1C shows the results obtained by our algorithm when 22 sentinel sites are selected based on a distance S = 20 miles (32.2 km) from 143 sentinel locations (the numbered labels correspond to the selection order). Figure 1D, shown for comparison, gives the locations of the 22 existing 2006–2007 IDPH sentinel surveillance sites. The first site selected by our algorithm covers 15% of the Iowa population; adding the second site brings this number to 25%. Additional locations provide more coverage, but with diminishing marginal returns, as shown in Figure 2.
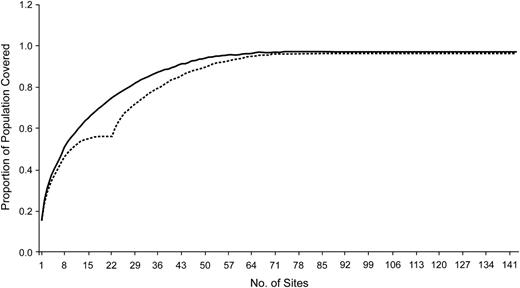
Population coverage (proportion) as a function of additional hospital surveillance units for a fixed, prespecified distance of 20 miles (32.2 km). The upper, solid curve represents the proportion of population coverage as each new surveillance site is added if the sites are selected de novo; the lower, dashed curve represents the proportion of population coverage when new surveillance sites are added incrementally to the 22 original 2006–2007 Iowa Department of Public Health–influenza-like illness surveillance locations.
The upper curve of Figure 2 shows the coverage obtained when the algorithm is allowed to run to completion, that is, when all possible sites are added even though they yield no increase in coverage. For the 143 candidate sites used, the first 52 selected yield a coverage of 95%; additional sites did not significantly improve coverage. Included for comparison (the lower curve) are the results obtained for the incremental problem, where the 22 2006–2007 IDPH sites are included as a starting set, and additional sites are then selected until no additional coverage is possible. The 22 2006–2007 IDPH sites cover 56% of the population, whereas the first 22 sites selected de novo achieve 75% coverage. Note that the first 10 sites selected de novo achieve the same population coverage as all 22 of the 2006–2007 IDPH locations.
The results described above consider the state of Iowa as a closed system. However, people living or working in neighboring states create an “edge effect” on the Iowa border, resulting in underestimated population coverage at the border. Thus, to account for the effect of the population living close to the borders of Iowa, we used the maximal coverage algorithm described above to find sentinel sites while considering all of the population within 20 miles of the 143 candidate sentinel surveillance sites (ignoring state borders, a total population of 3,911,774).
Figure 3 shows the results obtained by our algorithm when 22 sentinel sites are selected based on a distance S = 20 miles for the extended geographic model. The numbered labels correspond to the selection order. The first site selected by our algorithm covers 17% of the population (Iowa, including border populations); adding the second site brings this number to 29%. Additional locations provide more coverage, but with diminishing marginal returns.
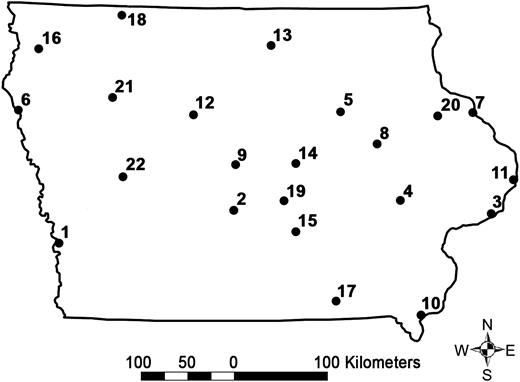
The 22 Iowa influenza-like illness sentinel locations chosen by the maximal coverage model when considering the border population in neighboring states. Numbers correspond to the selection order.
In Figure 4, we show the coverage obtained when the algorithm is allowed to run to completion. For the 143 candidate sites used, the first 58 sites selected yield coverage of 95%; additional sites did not improve coverage. When considering the border population, the 22 2006–2007 IDPH sites cover only 48% of the population, whereas the first 22 sites selected de novo achieve 77% coverage. Note that the first 5 sites selected de novo achieve the same population coverage as all 22 of the original IDPH locations.

Population coverage (proportion) as a function of additional health care provider surveillance units, for a fixed, prespecified distance of 20 miles (32.2 km), considering the population adjacent to Iowa's border. The upper, solid curve represents the proportion of population coverage as each new surveillance site is added if the sites are selected by the algorithm; the lower, dashed curve represents the proportion of population coverage starting from the 22 currently selected surveillance sites.
Finally, because some commercial firms use variations of maximal coverage models to decide where to locate retail outlets, we measured the population within 20 miles of the 45 Super Wal-Mart stores and the 18 Target stores within the state of Iowa. The 45 Super Wal-Mart stores cover 79% of the population of Iowa, with the 22 stores in the most populated ZCTAs covering 63% of the population; the 18 Target locations cover 61% of the population.
DISCUSSION
Surveillance is one of the cornerstones of public health practice. Without accurate information about disease activity, it is difficult to measure health needs, allocate resources, or design and implement effective interventions to improve public health. Because it is not obvious where an infectious disease such as influenza will start or where it will spread, covering a wider geographic area and more people will increase the probability of detecting the disease sooner and more accurately (i.e., measure the magnitude of seasonal activity), all else being equal. Disease surveillance is expensive and time consuming, however. Maximal coverage models provide a way for public health officials to maximize the population covered across geographic areas while minimizing the cost to public health agencies by controlling the number of surveillance sites used.
Recently, a great deal of attention has been devoted to modeling influenza epidemics and pandemics (8–13). However, our focus is significantly different. First, much of the current modeling work is designed to determine the effectiveness of policy and mitigation strategies. This work often does not directly apply to seasonal influenza and thus may not be applicable to everyday decision making for public health departments. Second, most of the recent influenza modeling work focuses on generating output from simulations. Our work specifically focuses on input: improving the quality of influenza surveillance data. Although reported nationally, several modes of influenza surveillance are coordinated at the state level. Currently, the only state-level data available across the United States are qualitative reports from the state and territorial epidemiologists summarizing weekly influenza activity (3). Different states have different mechanisms and approaches for influenza-like illness surveillance. For example, North Carolina tracks electronic medical records from emergency rooms across the state to augment influenza surveillance efforts (14). Iowa does not have such an electronic medical record collection system in place. Yet, regardless of resources and approaches, all states have public health budget constraints for collecting data.
Given scarce public-health resources in Iowa and other rural states, using a maximal coverage model will better target further recruitment efforts for new influenza-like- illness sentinel locations. For example, if one were allowed to select sites individually by using our algorithm, 22 sites would have covered over 75% of the population of Iowa versus the 56% of the population of Iowa actually covered during the 2006–2007 season. We also find that a goal of 80% coverage can be obtained by using just 27 appropriately selected sites. This number is surprisingly low, and it represents an easily attainable number of sentinel members. In practice, it may not be feasible or wise to turn reliable sentinel volunteers away from a network, but, unlike finding optimal locations for building warehouses, including additional volunteer members need not be expensive. Thus, our model can inform surveillance coordinators about where to add additional sites given a set of currently participating sites. This approach can guide the recruitment efforts for filling gaps in surveillance geographic coverage.
Although we produce a usable result that represents an immediate improvement over the status quo, some aspects of our approach merit careful consideration. First, we assume that 20 miles is the correct coverage distance. This is a convenient assumption and a reasonable starting point (in Iowa, almost everyone is within 20 miles of a health care provider), but in some areas this distance might be too large (urban areas); in others, it might be too small. To test our 20-mile assumption, we computed the coverage results obtained for different values of S (specifically, 15 miles (16.6 km) and 25 miles (40.2 km)). As expected, the coverage increases as S increases. We also find that the relation between the increases in coverage for each additional site is consistent across different values of S. In other words, the shape of the graphs in Figure 2 remain the same for different values of S.
Second, we used a Euclidian distance measure; although doing so is reasonable in Iowa given the state's unusually regular road and county structure, states with large lakes or mountain ranges may be better modeled by using road distance rather than Euclidian distance. Third, our initial modeling approach considered Iowa as a closed system. This approach tends to undervalue border communities, that is, cities in Iowa on the state border adjacent to other communities in neighboring states. However, these communities are epidemiologically connected despite their intervening state boundaries: for example, 2 of the “Quad Cities” are in Iowa and 2 are in Illinois. To adjust for this edge effect, we maximized the total population within 20 miles of the 143 candidate sites within Iowa, both inside and outside the state of Iowa. Unfortunately, this approach probably overcompensates for the influence of the cross-border population: people living across the border are certainly less likely to present to a sentinel site in Iowa. Neither solution—modeling the state as a closed system vs. including cross-border populations—is ideal.
Fourth, although having a large proportion of a state's population within a short distance of sentinel providers is clearly important, some sampling of low-population-density areas may also be important. Future work may consider a multicriteria objective that weights the success of the sentinel provider network in being close to a large proportion of the population of the state against the geographic balance of site placement. Finally, if our efforts are to provide a robust and useful tool for the public health community, we will also need to find and provide alternative providers for those locations where the selected providers opt not to participate. One simple approach would be to look for alternate providers in ZCTAs adjacent to the locations chosen by the maximal coverage model.
Many of the limitations described above could be addressed by incorporating data containing information on where patients live and where they seek care for influenza-related illnesses. Such information can be extracted from Medicare and Medicaid billing data. With such data, we could generate values of S that capture actual health-care-seeking behavior instead of choosing a constant value for people in both rural and urban areas. Furthermore, we could validate the results of our algorithm across different influenza seasons and measure the benefit of adding redundant locations in more urban regions. We could also calibrate our model to modify our placement algorithm to fit more specific utility functions, for example, placing sites to optimize the earliest detection of influenza activity.
From a computational standpoint, it is important to note that our algorithm greedily maximizes the coverage at each selection point, guaranteeing the best choice at each step; it cannot, however, guarantee the optimal solution overall. Computationally speaking, this problem is an example of an NP-hard problem, a problem in which the cost of computing the optimal solution grows exponentially with the number of sites to choose from (15). Such problems are considered intractable, so computer scientists and operations researchers instead compute approximate solutions that are close enough to the optimal solution to use effectively in practice (as we did in this paper).
Clearly, states can improve upon current influenza-like-illness surveillance and, with minimal additional effort, move beyond nontargeted recruitment of volunteers. The modeling approach is not difficult, and, at the state level, the computational resources needed are not excessive. Furthermore, in some states, it may be possible to just piggyback on the location-allocation work of commercial firms that have already implemented their own maximal coverage modeling. State health departments, for example, may be able to use locations of statewide retail chains to guide placement of their surveillance sites without computational work. Of course, commercial entities use many other variables aside from population coverage including, for example, local competition from other retail outlets, as well as transportation factors such as proximity to distribution centers (16, 17). In other words, retail chains and public health departments have different utility functions. Nevertheless, starting from the current distribution of providers, targeting additional providers in underserved areas near large retail locations may be an easy and reasonable way to choose new surveillance sites.
This modeling framework can also be applied to other influenza surveillance systems, such as hospital- or school-based efforts. Moreover, maximal coverage models have public health applications beyond influenza surveillance. For example, they could be used to help public health laboratories determine where to collect specimens for statewide surveillance projects. During outbreaks, maximal coverage models could help focus case-finding efforts. Similar models could also be used to help with disaster preparedness and can be adjusted, by modifying population distributions, to focus on covering specific populations at higher risk of certain diseases. For example, by using the distribution of people over the age of 65 years, one could establish the optimal geographic locations of stroke treatment centers. Alternatively, geocoded stroke incidence data could be used to help locate the placement of new treatment centers. In fact, geocoded health outcomes data could help optimize both clinical and public health resources for a number of diseases (e.g., sexually transmitted diseases).
In summary, maximal coverage models, long used in the business community, have the potential to improve and optimize disease surveillance activities at both the state and national levels. Despite several limitations, applications of maximal coverage models represent a promising area of research at the interface between geography, computer science, epidemiology, and clinical medicine.
Abbreviations
Author affiliations: Division of Infectious Diseases, Department of Internal Medicine, Carver College of Medicine, University of Iowa, Iowa City, Iowa (Philip M. Polgreen); Department of Epidemiology, College of Public Health, University of Iowa, Iowa City, Iowa (Philip M. Polgreen); Department of Geography, University of Iowa, Iowa City, Iowa (Zunqui Chen, Gerard Rushton); Department of Computer Science, University of Iowa, Iowa City, Iowa (Alberto M. Segre); Center for Acute Disease Epidemiology, Iowa Department of Public Health, Des Moines, Iowa (Meghan L. Harris); and University Hygienic Lab, University of Iowa, Iowa City, Iowa (Michael A. Pentella).
This study was supported in part by the National Institutes of Health (Research Grant K01 AI75089-01) and a Pfizer Public Health Scholar Award.
Conflict of interest: none declared.

