


Abstract
With high-throughput technologies providing vast amounts of data, it has become more important to provide systematic, quality annotations. The Gene Ontology (GO) project is the largest resource for cataloguing gene function. Nonetheless, its use is not yet ubiquitous and is still fraught with pitfalls. In this review, we provide a short primer to the GO for bioinformaticians. We summarize important aspects of the structure of the ontology, describe sources and types of functional annotations, survey measures of GO annotation similarity, review typical uses of GO and discuss other important considerations pertaining to the use of GO in bioinformatics applications.
INTRODUCTION
The first attempts at classifying gene functions made use of natural language annotations in databases. Early on it was found that natural language by itself is too vague and unspecific to accurately capture the function of genes [1], as it is difficult to perform searches and establish relationships with natural language annotations. The first efforts towards a structured and controlled annotation of genes were schemes such as the enzyme classification (EC) system representing the function of an enzyme using a four digit sequence of numbers [2]. Such classification schemes are still widely used but were found to be insufficient to accurately describe gene function. This motivated the introduction of the Gene Ontology (GO) [3], which has grown to be the largest resource of its kind.
The ‘GO Consortium’ consists of a number of large databases working together to define standardized ontologies and provide annotations to the GO. The three ontologies it encompasses are non-redundant and share a common space of identifiers and a well-specified syntax. Apart from providing a standardized vocabulary for describing gene and gene product functions, one key motivation behind the GO was the observation that similar genes often have conserved functions in different organisms. The combination of information from all organisms in one central repository makes it possible to integrate knowledge from different databases and to infer the functionality of newly discovered genes. Originally, the GO was developed for a general eukaryotic cell [3]. The initial GO vocabulary, as well as the available GO term annotations present in the first years of its existence reflects this fact (Figure 1). However, the GO Consortium now includes several annotation groups that focus on prokaryotes [5], further contributing to the expansion of the vocabulary and annotations.
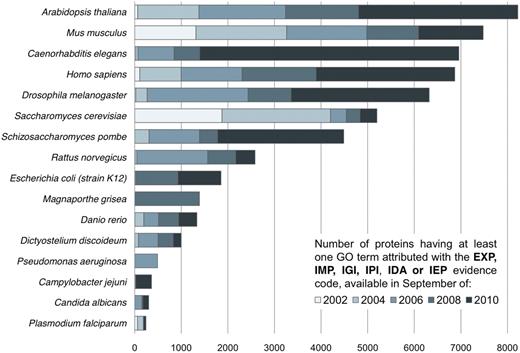
Increase in the number of experimentally verified GO term assignments available for the respective organism between September 2002 and September 2010. The GO consortium was initially focused on Eukaryotes, a fact reflected in the distribution and increase of annotations available in the GO database. Contrast for instance the steady growth of experimentally verified annotations for A. thaliana, S. cerevisiae or M. musculus with the sharp increment in the number of experimentally verified annotations available for E. coli: from 33 in 2002 to 1852 in 2010.
The goal of this review is to provide a primer to the GO for bioinformaticians. After a brief introduction to the structure of the ontology, we discuss the different types of annotations associated with the GO. Not all annotations are assigned in the same way and some are more trustworthy than others. Computational inference methods are described in more detail in this section, as they are used to assign a large fraction of GO annotations. The subsequent section discusses common measures of similarity to compare the function of genes quantitatively. The last section reviews typical uses of the GO and common pitfalls for the novice GO user.
WHAT IS THE GO?
The GO is a structured and controlled vocabulary of terms. The terms are subdivided in three non-overlapping ontologies, Molecular Function (MF), Biological Process (BP) and Cellular Component (CC) [6]. Each ontology describes a particular aspect of a gene or gene product functionality, as well as the relations between the terms. These relations are either ‘is_a’, ‘part_of’, ‘has_part’ or ‘regulates’ relationships. There are two subclasses of the ‘regulates’ relationships: ‘positively regulates’ and ‘negatively regulates’. The ‘is_a’ relationship is not used to imply that a term is an instance of another term; instead, it connects a subtype to its more general counterpart (Figure 2). The ‘part_of’ and ‘has_part’ relationships are logical complements of each other [7]. The relationships form the edges of a Directed Acyclic Graph (DAG), where the terms are the nodes (Figure 2). This allows for more flexibility than a hierarchy, since each term can have multiple relationships to broader parent terms and more specific child terms. Any path from a term towards the root becomes more general as terms are subsumed by parent terms.
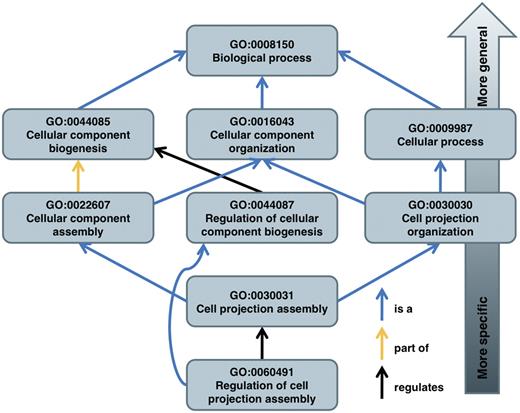
The structure of the GO is illustrated on some of the paths of term GO:0060491 to its root term. Note that it is possible for a term to have multiple parents.
Each gene is associated with the most specific set of terms that describe its functionality. By definition, if a gene is associated with a term, it is also associated with all the parents of that term. The annotation process is discussed in more detail in the next section.
The GO undergoes frequent revisions to add new relationships and terms or remove obsolete ones. If a term is deleted from the ontology, the identifier for the term stays valid, but is labelled as obsolete and all relationships to the term are removed [8]. Changes to the relationships do not affect annotations, because annotations always refer to specific terms, not their location within the GO.
It is clear that relationships between the three ontologies exist. For example, an instance of a BP is the execution of one or more MFs [9]. Similarly, relationships exist between the MF and CC ontologies. Recently, these relationships have been integrated into the GO by introducing some inter-ontology links [7]. It should be noted that for the moment there are two concurrent versions of the GO, the filtered and the full GO. The main difference is that the filtered GO does not contain any ‘has_part’ or inter-ontology relationships. Many of the analysis tools can only use the filtered GO. Thus, the full expressivity of the GO structure is not always available.
WHERE DO ANNOTATIONS COME FROM?
Annotations connect genes and gene products to GO terms. Each annotation in the GO has a source and a database entry attributed to it. The source can be a literature reference, a database reference or computational evidence [4, 6]. In addition, there are three qualifiers used to modify the interpretation of an annotation, ‘contributes_to’, ‘colocalizes_with’ and ‘NOT’, making them an integral part of the annotation [8].
Perhaps the most important attribute of an annotation is the evidence code. The 18 evidence codes available describe the basis for the annotation (Figure 3). These evidence codes are divided into four categories. General guidelines for deciding which evidence code to use are given in Figure 4. It should be kept in mind that one gene can be annotated to the same term with more than one evidence code and that multiple annotations to the same term for the same gene could even share the same reference. This makes it possible to see whether an annotation is supported by more than one type of evidence. However, if the gene is annotated with more than one evidence code and one evidence code is a superclass of another, the annotation with the more general evidence code does not need to be specified explicitly.
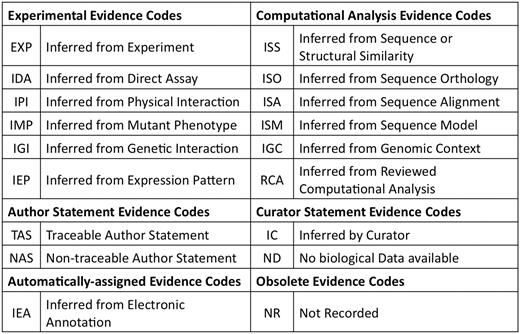
GO evidence codes and their abbreviations. Evidence code NR (not recorded) is used for annotations assigned prior to the use of evidence codes, and is not assigned to new annotations.
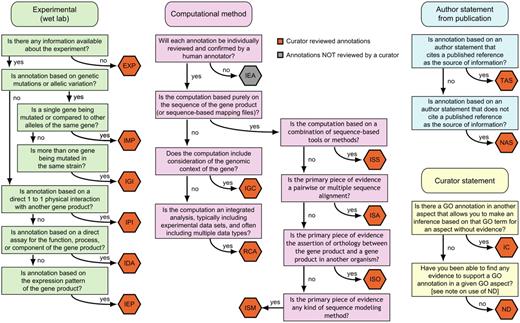
A decision tree for deciding which evidence code to use. Figure adapted from http://www.geneontology.org/GO.evidence.tree.shtml.
INFERRED FROM EXPERIMENT
The most reliable annotations are those inferred directly from experimental evidence. Such annotations are also important to seed the ontology so that the gene function of related genes can be inferred by computational methods [10]. At present, most researchers do not directly add their findings to the GO. The largest fraction of manual annotations are made by professional curators examining the literature [11]. In principle, researchers directly annotating genes they themselves characterized would be more efficient, but this practice has not yet caught on because annotation is time consuming and annotation guidelines are complicated [12]. There are efforts underway to make it compulsory for authors to submit GO term suggestions with article manuscripts [13]. A short overview of how annotations are made is given in [9].
INFERRED FROM COMPUTATIONAL METHOD
There are seven evidence codes associated with computational inference, out of which six imply manual curation (ISS, ISO, ISA, ISM, IGC, RCA). The evidence code IEA is used for all inferences made without any human supervision, regardless of the method used. The IEA evidence code is by far the most abundantly used evidence code (Figure 5). The Gene Ontology Annotation project (GOA, [14]) is the largest contributor of IEA annotations, most of which are derived from the protein domain database InterPro [15]. The guiding idea behind computational function annotation is the notion that genes with similar sequences or structures are likely to be evolutionarily related, and thus, assuming they largely kept their ancestral function, they might still have similar functional roles today. In this section, we briefly review the main computational methods used to infer function. For an in-depth treatment of the topic, we refer the interested reader to two recent reviews [16, 17]. Alongside each method mentioned here, we indicate the evidence code that would be used to support the respective GO annotation.
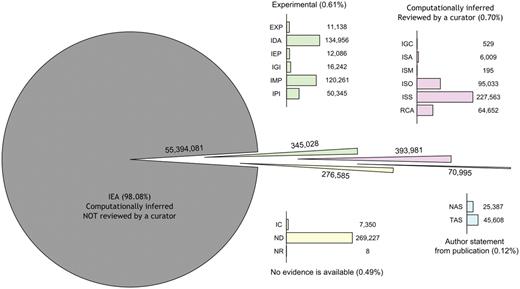
The distribution of evidence codes among annotations in the GO on 1 April 2010.
The most straightforward approach of computational functional annotation is to infer the function of a gene based on the functions of genes returned by a database search for similar genes. Traditionally, only sequence similarity is used [18], but some methods also use structural similarity. For instance, Liu et al. [19] introduced a method that makes use of the similarity of protein surface pockets to infer GO terms related to the protein. The ISS evidence code was originally used for all annotations derived from sequence-based analyses and is appropriate when multiple kinds of computational evidence are used. Note that annotations marked with ISS evidence code can also be partly derived from structural similarity.
ISS is a superclass for the ISA, ISO and ISM evidence codes. The three sub-categories of the ISS should be used when only one method was used to make the inference. For example, to improve the accuracy of function propagation by sequence similarity, many methods take into account the phylogenetic relations of genes. Most of these methods rely on orthology (ISO evidence code), because the function of orthologs is believed to be largely conserved across species [20]. In a typical analysis, characterized and uncharacterized genes are clustered based on sequence similarity measures and phylogenetic relationships. The function of unknown genes is then inferred from the function of characterized genes within the same cluster (e.g. [20,21]).
Alternatively, methods based on protein profiles account for the fact that sequence conservation might be very uneven across the length of two functionally related genes. This is because the function of a protein is often dictated not by the shape and structure of the whole protein, but rather by specific regions and residues, such as catalytic sites, prosthetic group attachment sites or other binding sites [22, 23].
Another approach to function prediction consists of supervised machine learning based on features derived from protein sequence [24–27] (ISM evidence code). Such methods use a training set of classified sequences to learn features that can be used to infer gene functions. Although few explicit assumptions about the complex relationship between protein sequence and function are required, the results are dependent on the accuracy and completeness of the training data.
As Rentzsch and Orengo [16] argue, one of the biggest challenges of automated function prediction is choosing the right threshold beyond which function can be propagated. Using a predefined cut-off level is not a good practice as the optimal threshold will vary depending on which genes are evaluated. Indeed, there are several instances of proteins with high sequence similarity but different functions, and conversely, of proteins with similar function but highly divergent sequences [28, 29] and the user of annotations derived by computational methods should always have these intricacies in mind.
INFERRED FROM AUTHOR STATEMENT
Annotations in this group fall into two categories. Traceable Author Statements (TAS) refer to papers where the result is cited, but not the original evidence itself, such as review papers. On the other hand a Non-traceable Author Statement refers to a statement in a database entry or statements in papers that cannot be traced to another paper.
CURATOR STATEMENT AND OBSOLETE EVIDENCE CODES
Three evidence codes fall in this category: IC, ND and NR. If an assignment of a GO term is made using the curator’s expert knowledge, concluding from the context of the available data, but without any ‘direct’ evidence available, the IC evidence code is used. The ND evidence code indicates that the function is currently unknown (i.e. that no characterization of the gene is currently available). Such an annotation is made to the root of the respective ontology to indicate which functional aspect is unknown. Hence, the ND evidence code allows for a subtle difference between unannotated genes and uncharacterized genes. Note that the ND code is also different from an annotation with the ‘NOT’ qualifier (which indicates the absence of a particular function). The NR evidence code labels annotations that were made before the introduction of evidence codes and as such may not be used for new annotations. It is obsolete and has been superceded by the ND evidence code. Although a few legacy NR annotations remain within the GO they will probably be removed in the nearby future.
IMPORTANCE OF EVIDENCE AND QUALIFIERS
GO annotations should always be considered with their qualifier and evidence code. A qualifier, such as ‘NOT’, changes the interpretation of an annotation. Similarly, although the evidence code is not a direct measure of the quality of the annotation, some evidence codes are regarded as more trustworthy. Terms annotated with ND are typically ignored as no knowledge is available on the function of these genes. NR annotations are obsolete and should be ignored since the evidence type used for the annotation is not known.
Most studies also disregard all terms annotated without curation (IEA) [30–33], consequently leaving out more than 98% of the annotations in the GO (Figure 5). The mistrust many researchers have towards IEA annotations is backed by studies suggesting that annotations from the available databases should be used with caution [34]. One of the leading factors why IEA annotations are not used is because this often leads to circular reasoning when used in computational analyses. On the other hand, IEA annotations are useful in providing a first approximation to experimental biologists. Ultimately, no annotations should be regarded with complete confidence, as some studies show that even the curated annotations in GO are not free from annotation errors [35].
To estimate the reliability of unsupervised computational assignments, we compared the September 2008 and September 2010 versions of GO annotation data for four representative Eukaryotes (Arabidopsis thaliana, Caenorhabditis elegans, Drosophila melanogaster and Saccharomyces cerevisiae). We considered all IEA annotations of the 2008 database that either had an experimental evidence code or were completely absent in the 2010 release. We used the annotations confirmed experimentally as surrogate for correct predictions and the annotations dropped from the database as surrogates for wrong predictions. In addition, to estimate the coverage of computational predictions, we computed the fraction of newly added experimental annotations that had been previously computationally predicted. This yielded Figure 6.
![Estimation of correctness and coverage of computationally inferred GO terms (IEA) from September 2008. The estimation is based on data for four well annotated Eukaryotes: A. thaliana, C. elegans, Drosophila melanogaster and Saccharomyces cerevisiae. Confirmed predictions are those 2008 IEA annotations that were ‘promoted’ to one of experimental evidence codes (EXP, IMP, IGI, IPI, IDA, IEP) in the September 2010 annotation file. Rejected predictions are IEA annotations in 2008 that were subsequently removed. The X-axis is a measure of completeness (‘recall’). It represents the fraction of genes having experimentally validated annotations, added in the 2008–10 period, that were correctly predicted in the 2008 IEA annotations file. The Y-axis is a measure of correctness (‘precision’). It represents the fraction of genes having IEA annotations in 2008, later confirmed by experimentally validated annotations (in the 2008–10 period). The size of each bubble reflects the frequency of the respective GO term in annotations assigned using experimental evidence codes and is a surrogate for the generality of the term: the larger the bubble, more abundantly is the term used in GO experimental annotations. To minimize estimation errors, terms included in the figure have at least five confirmed 2008 IEA annotations and five rejected IEA annotations, resulting in 72 BP terms, 85 MF terms and 37 CC terms. The files containing annotations were downloaded from the GOA database [14].](https://oup.silverchair-cdn.com/oup/backfile/Content_public/Journal/bib/12/6/10.1093/bib/bbr002/2/m_bbr002f6.jpeg?Expires=1716383444&Signature=Jl0qZwdzq3kbvA7dRgq-8-J97Wug~FrJTZsBxYiwFceEzaeQcTa7qAh2QHpoHXPfj83tC2HLI44tARdk2h2XW3AhZUJftkHFxzgpa-FSxruxSykDTdSuzTaNYZ8vcIcqRxL381b1agwpttA1n7sbM2iEAieKXdzNfw1E~L6~~rWEXRwbdtJr07~PUVpX9OzugO8VDOHJJk3eAxHhbD3ZMfT58hmD8dAazw8J0qFdTDfiBkEwj8xw1GqmoXGqa-vv0hj0Egvbu2AMf3JosoYXmII459QTRL7LUAjyxHHxt77oXo5HEd~0Er9egvc1a3I4tqTjuJoVNUEIJV-y1cDg0A__&Key-Pair-Id=APKAIE5G5CRDK6RD3PGA)
Estimation of correctness and coverage of computationally inferred GO terms (IEA) from September 2008. The estimation is based on data for four well annotated Eukaryotes: A. thaliana, C. elegans, Drosophila melanogaster and Saccharomyces cerevisiae. Confirmed predictions are those 2008 IEA annotations that were ‘promoted’ to one of experimental evidence codes (EXP, IMP, IGI, IPI, IDA, IEP) in the September 2010 annotation file. Rejected predictions are IEA annotations in 2008 that were subsequently removed. The X-axis is a measure of completeness (‘recall’). It represents the fraction of genes having experimentally validated annotations, added in the 2008–10 period, that were correctly predicted in the 2008 IEA annotations file. The Y-axis is a measure of correctness (‘precision’). It represents the fraction of genes having IEA annotations in 2008, later confirmed by experimentally validated annotations (in the 2008–10 period). The size of each bubble reflects the frequency of the respective GO term in annotations assigned using experimental evidence codes and is a surrogate for the generality of the term: the larger the bubble, more abundantly is the term used in GO experimental annotations. To minimize estimation errors, terms included in the figure have at least five confirmed 2008 IEA annotations and five rejected IEA annotations, resulting in 72 BP terms, 85 MF terms and 37 CC terms. The files containing annotations were downloaded from the GOA database [14].
Most terms lie in the upper half of the graph, which suggests that most computational predictions are correct. As one would expect, more general terms tend to be better predicted, and in many cases are better covered as well. A notable exception is the term GO:0005515 (protein binding) in the MF ontology. The reason for its particularly low coverage is likely due to its usage guideline: ‘Annotation to this term should use the IPI evidence code so that the protein being bound can be specified in the with modifier of the evidence code’ (http://gowiki.tamu.edu/wiki/index.php/Category: GO:0005515\_!\_protein\_binding#Notes).
Terms falling in the bottom right part of the chart have high coverage at the expense of accuracy. Consider for instance term GO:0016021 (integral to membrane) from the CC ontology: its immediate parent term GO:0031224 (intrinsic to membrane), is positioned in the top right corner of the chart. This suggests that in this case, the computational predictions would have been better if they had been slightly less specific. Overall, these results corroborate the idea that unsupervised computational assignments can provide first approximations or working hypotheses that can be refined or verified in subsequent steps [11, 36].
HOW ARE GO ANNOTATIONS COMPARED QUANTITATIVELY?
One of the main purposes of GO annotations is a quantitative comparison of gene function. Such comparison is based on a measure of function similarity between two genes, defined over the GO terms associated with these genes. In this section, we review the main similarity measures commonly used, with an attempt at motivating intuitively their mathematical formulas. For a more thorough survey of similarity measures and their mathematical properties, we refer the reader to more specialized reviews [28, 37].
SIMILARITY OF TWO GO TERMS

 is the set of all terms that subsume both
  and
and  . A slight variation consists in taking the IC of the lowest common parent [41], which coincides in most cases with the most informative common parent, but is faster to compute.

 is the probability of the most informative common ancestor of
  and
and  .
.
Though IC-based measures are less influenced by the idiosyncrasies of the ontology structure than their graph-based counterparts, they are still biased, because some terms are used more often and some research areas receive more attention than others [28]. Another caveat is that in principle, different relationships within the ontology should not be treated equally.
In practice this is often not done and often all relationships are treated equally to simplify the analysis [43]. Furthermore, it should be noted that not all relationships are represented equally within the ontology [45]. While ‘is_a’ relationships alone form a complete tree that can be used for comparisons the same is not true for other relationships.
GO SIMILARITY OF TWO GENES
However, both variants have flaws. The main problem of the average is that considering all pairs of GO terms penalizes multifunction proteins: in particular, the similarity between a multifunction gene and itself can be quite low, because the average tends to be dominated by pairs of different GO terms (Consider a gene with n GO terms. Of all the pairs, the number of pairs involving identical GO terms scales linearly in n, but the number of pairs involving different GO terms scales quadratically). The maximum suffers from the opposite problem, namely that genes that differ in all but one functional aspect will still show a high similarity under this measure. To balance between the two, Azuaje et al. [46] suggested computing the average over the reciprocal best matching pairs only.
Instead of reducing gene similarity to the similarity of paired GO terms, other measures consider all implied GO terms at once. One such measure is the Term Overlap (TO), which considers the number of common terms between genes [47]. Note that the set of terms associated with a gene by definition includes the parents of all terms a gene is annotated with. A normalized version of this measure also exists, but was found to suffer from the shallow annotation problem [48]. Yet another measurement converts genes into binary vectors of length equal to the number of terms in the ontology by setting the  component to 1 if the gene is annotated with the corresponding term and 0 otherwise. The distance between two genes can then be computed using a metric on the vector space, such as the cosine of the angle between them [49]. Lastly, set similarity measures, such as the Jaccard index, can also be used to compare the sets of terms with which two genes are annotated [50].
COMPARING SIMILARITY MEASURES
Various measures reviewed above formalize the notion of function similarity in slightly different ways. Thus, choosing the best measure is a subjective decision. Conceptual arguments can suffice to disqualify a measure if it has an obvious flaw, e.g. a low reported similarity for identical genes or a high reported similarity for completely different ones. Else, several studies have attempted to compare functional similarity measures in terms of how well they correlate with other measures that are assumed a priori to be linearly linked with function, such as sequence similarity (e.g. [45, 48]) or gene co-expression levels (e.g. [43]). But the strong premises of such assessments undermine their usefulness, because one of the main goals of defining a measure of gene function similarity is precisely to investigate the relationship between function and other aspects of genes such as sequence or expression. Ultimately, we believe that the choice of similarity measure should be acknowledged as inherently subjective. Instead of trying to identify the best measure, studies should demonstrate that their conclusions are not sensitive to the choice of similarity measure (as done e.g. in [51]).
WHY USE THE GO?
The GO can be used as a database to look up genes with similar functionality or location within the cell [29]. In this way a search for interacting genes in one organism or similar genes in two organisms can be narrowed down. If the terms associated with genes are too specific, more general parent terms can be used to give a snapshot of an organism’s gene functions that can more easily be compared with other organisms [5]. Another standard use of the GO is to reason across the relations using an automatic logical inference tool [5]. Inferences can be made by following simple rules, for example, if A ‘is_a’ B and B is ‘part_of” C then A is also ‘part_of” C. In this way relations that are not immediately obvious, but captured in the GO, can be automatically uncovered.
The GO is frequently used to analyse the results of high-throughput experiments. One possibility is to infer the location or function of genes that are over- or under-expressed [8, 12]. In functional profiling the GO is used to determine which processes are different between sets of genes. This is done by using a likelihood-ratio test to determine if GO terms are represented differently between the two gene sets [8]. Both hypothesis-generating and hypothesis-driven queries can be addressed in this way. In hypothesis-generating queries, the goal is to find which terms are significantly different between the sets, whereas in hypothesis-driven queries, it is to test if some set of terms are different. In hypothesis-generating queries a multiple-test correction needs to be applied, but because of the amount of terms in the GO, the power of the test is significantly reduced. Hypothesis-driven queries do not require any multiple-test corrections. To reduce the effect of doing a multiple-test correction the number of tests done in hypothesis-generating queries need to be minimized. This is commonly done by running the query on a GO slim. A GO slim ontology is a reduced subset of general terms [8]. The annotations for a set of genes can then be mapped onto the GO slim. Because of the structure of the GO, an annotation may be mapped to many terms in the GO slim. Another standard use of GO slims is to give a high-level categorization of genes based only on the terms within the GO slim. It should be added that there are two types of GO slims. The first type is a subset of the GO used to facilitate the examination of a particular taxon subdivision. The second type is a set of broad GO terms used to aggregate the GO into large bins used for the representation of annotation data.
Additionally, the GO is used to infer the function of unannotated genes. Genes that behave similarly to an unannotated gene are identified from the experiment and their function is evaluated to be transferred to the unannotated gene. Many of these assigned terms will be false positives, but the correct terms should appear more often than is dictated by chance or indirect effects [5].
The GO is also used to infer protein–protein interactions (PPI) [33]. Shin et al. [32] used both PPI and GO data to show that interacting proteins are colocated within the cell. Another approach is to test the validity of inferred PPI networks by looking at the functional similarity of genes within the GO [30]. In this case, it is important that annotations inferred from previous PPI studies (IPI evidence code) are left out from the analysis.
A wealth of tools has been developed for applying the GO to various tasks. Links to most of the more prominent tools can be found on the GO website (http://geneontology.org). To give broader access to the GO, the GO consortium developed the AmiGO application (http://amigo.geneontology.org) [52]. AmiGO can be used online from the GO website or downloaded and installed. The application contains interfaces for searching, visualizing and downloading data in the GO. AmiGO also features BLAST search, Term Enrichment and GO Slimmer tools. The Term Enrichment tool is used for functional profiling and the GO Slimmer is used to map annotations to the terms within a GO slim. Lastly, AmiGO also makes it possible to directly query the GO database. There are many other tools available for analysing GO data. Because not all the tools use exactly the same methods the results can be very different and it is recommended that researchers try a few different tools before making an interpretation [8].
While it can be a powerful inference tool, researchers using the GO should familiarize themselves with the structure of the ontology and also with the methods behind the tools they use to ensure that their results are valid.
CONCLUSION
The number of associations in the GO has grown exponentially since its inception. There were 30 654 associations on 1 July 2000 and 7 781 954 associations on 1 July 2003 [6]. This number had grown to more than 16 million in 2007 [8] and more than 55 million in 2010. Due to the inference methods used, most of the growth has been from IEA associations. In contrast, the curated associations component has only grown linearly. The ontology itself has also been steadily growing, from less than 5000 terms in 2000 [6] to more than 30 000 in 2010. The Reference Genome Project has been initiated to focus the annotation efforts of various groups on a number of predetermined homologous genes [10]. This will not only help in seeding the ontology, but through a concentrated effort on certain branches the overall structure of the ontology will also be improved.
One shortcoming of the GO is that annotations only describe the normal, healthy functioning of genes [12]. In addition, data on functional coordination between multi-function genes are not explicitly stored [31]. Another shortcoming is that until recently no relationships between the three ontologies were recorded [7, 12]. Although inter-ontology relationships are now recorded they are only recorded in the full GO, which is not used by all analysis tools, making it necessary to maintain two versions of the GO.
The structure of the GO is predominantly the result of painstaking manual curation over the past 10 years. Through many additions and changes the GO has grown to be quite large and in many cases the structure is not optimal anymore. More specific subsets are available, in the form of a prokaryote subset and GO slims. Although there are quite a large number of GO slims available on the GO website, only seven of them are actively maintained (Of the seven GO slims that are maintained by the GO consortium two are for specific organisms (Schizosaccharomyces pombe and Candida albicans), two are for broader classes of organisms (Yeast and Plant slims) and one is a generic GO slim. In addition there is also the UniProtKB-GOA and whole proteome analysis and the Protein Information Resource slim. These GO slims are included as part of the GO flat file, but can also be downloaded individually from the website). The manual creation of GO slims is a painstaking process as the information loss from both the graph-structure and the gene-product annotation needs to be minimized [53]. A recent paper discusses the automatic creation of GO slims based on an information theoretic approach [53]. The analysis in the paper shows that the terms chosen for inclusion in existing GO slims are not always ideal and often subject to a bias. Recently, researchers have also used techniques from information theory to automatically organize and optimize the structure of the GO [54]. It is likely that in the future such approaches will be used more frequently for the construction and curation of both the full GO and GO slims.
There are a number of other ontologies and schemes for cataloguing genes available to researchers. In order to centralize the data, projects have been initiated to clean up and integrate ontologies [4, 16]. The most important such example is the Open Biomedical Ontologies (OBO) group which, guided by a set of principles similar to the ones the GO was built upon, seeks to standardize bio-ontologies [4]. As part of their efforts the OBO developed the OBO biological ontology file format for specifying ontologies. Their efforts also include the OBO Foundry, a group that is devoted to the integration of ontologies according to the OBO principles. In addition, this group is also concerned with removing redundant ontologies and aligning the development of ontologies by separate communities. An important tool in the standardization of ontologies is the OBO-Edit ontology editor (www.obo-edit.org) which is developed and maintained by the GO consortium.
Linking ontologies will increase their usefulness and power, but will also provide many more pitfalls for inexperienced users. Probably the most challenging aspect will be the integration of associations made from different types of evidence and blending the contents of the different ontologies to give maximal information while still remaining clear and concise. These steps will be necessary to ensure that both inter- and intra-ontology comparisons return meaningful results.
The GO is a structured and controlled vocabulary of terms and relationships for cataloguing gene function.
Annotations in the GO can be experimentally or computationally derived, different classes of annotations have different levels of confidence.
The vast majority of annotations in the GO are automatically inferred and not curated.
Terms in the GO can be compared based on their information content, which is inversely proportional to the probability of a term.
Genes can be compared based on the terms that they are annotated with in the GO.
The GO is a powerful tool for data analysis, but its usage is fraught with pitfalls for inexperienced users, which could lead to false conclusions being drawn.
Acknowledgements
The authors thank Pascale Gaudet, Elke Schaper, Fran Supek, as well as the anonymous reviewers for their helpful feedback on the draft. This article started as assignment for the graduate course ‘Reviews in Computational Biology’ (263-5151-00L) at ETH Zurich.
