


Abstract
Most heritable surnames, like Y chromosomes, are passed from father to son. These unique cultural markers of coancestry might therefore have a genetic correlate in shared Y chromosome types among men sharing surnames, although the link could be affected by mutation, multiple foundation for names, nonpaternity, and genetic drift. Here, we demonstrate through an analysis of 1,678 Y-chromosomal haplotypes within 40 British surnames a remarkably high degree of coancestry that generally increases as surnames become rarer. On average, the proportion of haplotypes lying within descent clusters is 62% but ranges from 0% to 87%. The shallow time depth of many descent clusters within names, the lack of a detectable effect of surname derivation on diversity, and simulations of surname descent suggest that genetic drift through variation in reproductive success is important in structuring haplotype diversity. Modern patterns therefore provide little reliable information about the original founders of surnames some 700 years ago. A comparative analysis of published data on Y diversity within Irish surnames demonstrates a relative lack of surname frequency dependence of coancestry, a difference probably mediated through distinct Irish and British demographic histories including even more marked genetic drift in Ireland.
Introduction
Heritable surnames are unique cultural labels of common ancestry that represent a potentially rich resource for the analysis of human diversity (Bedoya et al. 2006), history (Bowden et al. 2008), genealogical descent (Foster et al. 1998), and disease (Garza-Chapa et al. 2000).
Most heritable surnames are patrilineal, and so men sharing such surnames might be expected to share related Y chromosome haplotypes, because these are also passed down from father to son (Jobling and Tyler-Smith 2003). However, the strength and structure of the relationship between the two could be influenced by a number of additional factors (Jobling 2001). Mutation will alter haplotypes through time, although, on the timescale of surnames, only at rapidly mutating markers such as short tandem repeats (STRs): Knowledge of mutation rates and processes allows this to be taken into account (Gusmão et al. 2005). Differences in the number of founders at the time of surname establishment within a given population could affect the number of descendant lineages within a surname: Those deriving from common occupations or first names, for example, seem more likely to have had multiple founders than those derived from the names of small villages (McKinley 1990). Nonpaternity, child adoption, and matrilineal surname transmissions will act to introduce exogenous haplotypes into a surname: Together we refer to these as nonpatrilineal transmissions (NPTs). Historical rates of nonpaternity are difficult to estimate, though modern rates, where these have been measured, are of the order of a few percent per generation (Brock and Shrimpton 1991; Sasse et al. 1994). Finally, genetic drift—stochastic changes in haplotype frequencies from generation to generation—could affect the probability of survival or multiplication of a particular lineage within a surname through time; such effects could be magnified by demographic phenomena influencing the entire population, or by social lineage-specific phenomena causing differential reproductive success. Dramatic examples of such social selective effects have been seen in Asia (Zerjal et al. 2003; Xue et al. 2005) and Ireland (Moore et al. 2006).
Previously, we have shown through an analysis of the Y chromosomes of 150 randomly ascertained pairs of men each sharing a British surname (King et al. 2006) that a clear genetic signal of coancestry can be observed. Sharing a surname significantly elevates the probability of sharing a Y-chromosomal haplogroup, and the relationship is frequency dependent, being stronger for rarer names. This analysis, as well as a study of males sharing Irish surnames (McEvoy and Bradley 2006), indicates that larger scale analyses of British surnames are worthwhile. Here, we demonstrate through a detailed analysis of 40 such surnames a high degree of frequency-dependent coancestry, and evidence that drift through variation in reproductive success is a key factor in patterning the diversity within names. Detailed comparisons with published data on Irish surnames (McEvoy and Bradley 2006) demonstrate that the different populations show different Y surname relationships, mediated through distinct demographic histories.
Materials and Methods
DNA Samples
Forty British surnames were chosen to cover a range of types and frequencies, and DNA donors recruited to give sample sizes ≥10. Spelling variants (supplementary table, Supplementary Material online) were included, as defined in standard sources (Hanks and Hodges 1988; Reaney and Wilson 1997). One surname is here referred to as “R,” for consistency with an earlier publication (King, Parkin, et al. 2007). A questionnaire was used to exclude patrilineal relatives closer than second cousin, and also individuals with known recent name changes or origin outside the United Kingdom. Geographically random sampling was with informed consent and followed ethical review by the Leicestershire Research Ethics Committee (ref. 5796). A control group was also assembled containing 110 men with surnames different from each other and from the 40 surname-specific groups (supplementary table, Supplementary Material online). Buccal sample collection and DNA extraction were as described (King et al. 2006).
Y Haplotyping
Binary markers shown in figure 1a (Karafet et al. 2008) were largely typed in two multiplexes using the SNaPshot minisequencing procedure (Applied Biosystems, Foster City, CA) and an ABI3100 Genetic Analyzer (Applied Biosystems). The first multiplex contained the markers M9, M89, M145, M170, M173, P25, 12f2, and SRY10831, and the second, carried out on a subset of chromosomes, contained M9 for confirmation, M172, M69, and M201. Additional SNaPshot assays were used for markers defining haplogroups E1a (M33) and Q1a (MEH2). In all cases, primer sequences were as described (Hurles et al. 2005; Bosch et al. 2006). Markers defining haplogroups A1a (previously named A1) and T (previously named K2) were typed by DNA sequencing (King, Parkin, et al. 2007) and polymerase chain reaction-restriction fragment length polymorphism (PCR-RFLP) analysis (King, Bowden, et al. 2007), respectively. Note that all chromosomes classified here as belonging to hgR1*(xR1a,R1b1) have been previously shown (Adams et al. 2006) to be derived for the marker M269 (hgR1b1b2), and therefore to carry a reversion of the marker P25 through probable gene conversion. Haplogroup nomenclature is as described (Karafet et al. 2008), with the following shorthand names used in text and figures: J*(xJ2) is referred to as J*, Q*(xQ1a) as Q*, and R1*(xR1a,R1b1) as R1*. Seventeen Y-STRs (DYS19, DYS388, DYS389I, DYS389II, DYS390, DYS391, DYS392, DYS393, DYS434, DYS435, DYS436, DYS437, DYS438, DYS439, DYS460, DYS461, and DYS462) were typed in three multiplexes (Bosch et al. 2002).
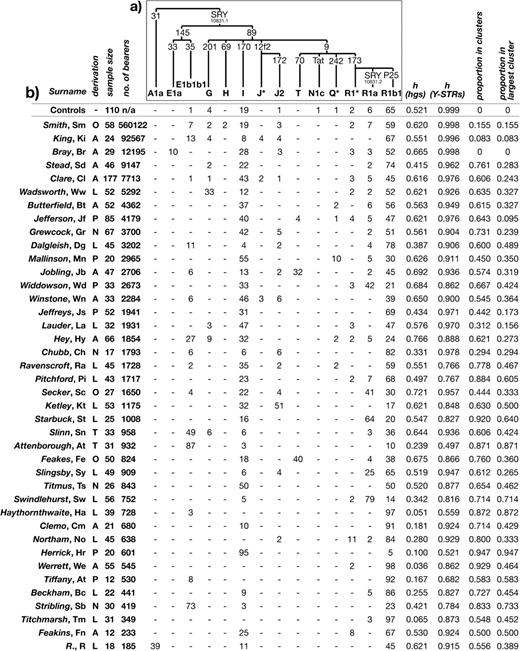
Haplogroup frequencies and gene diversities in 40 surnames and controls. (a) Tree showing phylogenetic relationships between haplogroups observed in this study, with mutation names given on branches. Unobserved haplogroups and associated markers are not shown, and shorthand names for haplogroups are explained in Materials and Methods. (b) Haplogroup frequencies, diversities, and summary of descent cluster findings. Each surname is followed by its abbreviation. Surname derivations are coded as follows—A: ambiguous/unknown; L: locative; N: nickname; O: occupational; P: patronymic/matronymic; and T: topographic. The total number of bearers of each surname in 1996 is given as the sum of bearers of all analyzed spelling variants—see supplementary table, Supplementary Material online. h: gene diversity. The number of clusters observed per surname is not shown, because this is sample-size dependent.
Analysis
Surnames were ranked by frequency using information from the 1996 UK electoral registers, covering those aged 18 and over who register themselves to vote. Summary statistics (Nei's estimator of gene diversity, population–pairwise FST [for haplogroups] and RST [for Y-STR haplotypes]) were calculated using Arlequin (Excoffier et al. 2005). Multidimensional scaling (MDS) based on FST and RST matrices was carried out using PROXSCAL in SPSS 14.0. Median-joining networks (Bandelt et al. 1999) were constructed within the program Network 4.1.0.9 (www.fluxus-engineering.com/sharenet.htm) incorporating both Y-STRs and binary markers. Y-STRs were weighted on the basis of variance as described (Qamar et al. 2002; King, Parkin, et al. 2007), whereas binary markers were given a weight of 99 to ensure that they were not recurrent.
Descent clusters within surname networks were identified by establishing ad hoc rules based on observations of eight examples of surname clusters within infrequent haplogroups (E1b1b1, G, J2, and T, all existing at <5% in controls). The general rarity of these haplogroups means that chromosomes are unlikely to be introduced into the clusters by NPTs (e.g., supplementary fig. 1), and therefore members of clusters probably descend from a common founder in the surname. The rules defined from these clusters were 1) define a core of ≥2 identical haplotypes; 2) include all one-step neighbors; 3) include all one-step neighbors of one-step neighbors; 4) include two-step neighbors of the core haplotype (when there are no intervening haplotypes) when the Y-STR locus weight, based on variance (Qamar et al. 2002), is less than 5. Where two or more candidate core haplotypes were adjacent within a network, a cluster was defined based on the haplotype containing the greatest number of individuals as the core. Some surnames (e.g., “Beckham”) contain clusters that have independent core haplotypes, but do share some peripheral haplotypes. Under these rules, many surnames contained more than one cluster, and these were treated independently in subsequent analyses such as time to most recent common ancestor (TMRCA) calculation. In applying the cluster definition to the commonest haplogroups R1b1 and I, we required at least three shared haplotypes to constitute a core, to take account of the relatively high likelihood of haplotype sharing by chance. This definition is conservative and may miss some true clusters.
TMRCA of descent clusters was estimated within Network from the rho statistic, using a 35-year generation time (King et al. 2006) and a mean per-locus, per-generation mutation rate of 1.50 × 10⁻³, deduced (supplementary fig. 2, Supplementary Material online) from observing seven mutations among the haplotypes of living individuals from a set of deep-rooting pedigrees totaling 274 generations (Heyer et al. 1997; Foster et al. 1998; King, Parkin, et al. 2007). The current mean age of the 1,678 DNA donors (60 years) was added to all TMRCA estimates. When two clusters overlapped, neither was subject to TMRCA estimation. Note that any descent cluster in which all individuals share a single haplotype cannot be dated using the rho method.
Forward simulations of descent processes were used to aid interpretation of surname/Y chromosome patterns. Simulations were written in Perl. In each simulation, a haplotype was chosen as a founder at random from the set of controls and 20 generations of descent modeled for 10,000 simulations. The mean Y-STR mutation rate (1.5 × 10⁻³ per generation—see text) was scaled inversely by the variance of the 17 STRs within a set of 291 British hgR1b1 chromosomes (King, Parkin, et al. 2007), providing an approximation to locus-specific mutation rates. Repeat gains and losses were equiprobable, and two-step mutations were allowed, with 10-fold lower rates than single-step changes. Nonpaternity was incorporated in the simulations, with incoming haplotypes being drawn at random from the control pool, at a rate of 2% per generation. British population sizes between 1300 CE and the present (Goldberg 2004) were used to estimate population decline and growth: We assumed a population size of 5.15 million at 1300 CE, 2.3 million at 1510 CE (following epidemic disease), and 44.6 million at 2001 CE from census data. Population size change between these points was assumed to be exponential, allowing calculation of a growth rate and mean number of male offspring per generation. Offspring numbers were approximated by a Poisson distribution with minimum zero, and maximum 6, estimated from family reconstitution data (Wrigley et al. 1997). Founder numbers were varied between 1 and 100. To mimic sampling effects, only simulations yielding ≥100 descendants were considered, and 42 (our mean surname sample size) individuals were subsampled for analysis. Descent clusters in simulated descendants were defined as described above.
Comparative Data
Y-Chromosomal haplotype data on Irish surnames were taken from the literature (McEvoy and Bradley 2006) and Irish surname frequencies estimated from telephone records (www.eircomphonebook.ie). Networks were constructed, and descent clusters defined and analyzed, as described above.
Results
To explore Y-chromosomal diversity within surnames, we recruited 1,678 men each bearing one of 40 British surnames or a recognized spelling variant (mean sample size 42; range 12–177), plus 110 men carrying 110 different British surnames as a control group.
Haplogroup Diversity within Surnames
Y chromosomes were first classified into 14 different haplogroups by typing a total of 17 binary markers (fig. 1). Striking differences in haplogroup frequency are apparent between many surnames, and between particular surnames and the controls, providing clear evidence for coancestry within surnames. Some, such as “Werrett” and “Titchmarsh,” are almost fixed for a single haplogroup, resulting in very low gene diversity values (0.036 and 0.065, respectively, compared with 0.521 for controls). The wide range of haplogroup frequencies can be seen in an MDS plot based on pairwise FST between surnames (fig. 2a). Surname groups are widely scattered in the plot, with 28/40 (70%) being significantly different from controls (P < 0.05), and some surnames (“Herrick,” “Hey,” and “Ketley”) being significantly different from all other samples. Those surnames that do not differ from the controls include the four with the largest numbers of bearers—“Smith,” “King,” “Bray,” and “Stead,” suggesting that common surnames may contain greater haplogroup diversity than rarer ones. This is confirmed by a significant correlation between surname frequency rank and gene diversity for haplogroups (Spearman's r = 0.525; P = 6.03 × 10⁻⁴). Some haplogroups that are rare (<10%) or absent in the controls exist at high frequencies within particular surnames: Examples are hgA1a in R, E1a in Bray, G in “Wadsworth,” J2 in Ketley, T in “Feakes,” Q* in “Mallinson,” R1* in “Northam,” and R1a in “Swindlehurst” (fig. 2a). “Attenborough” provides the clearest signal of coancestry, with 87% of chromosomes belonging to hgE1b1b1, which is present at only 1% in controls.
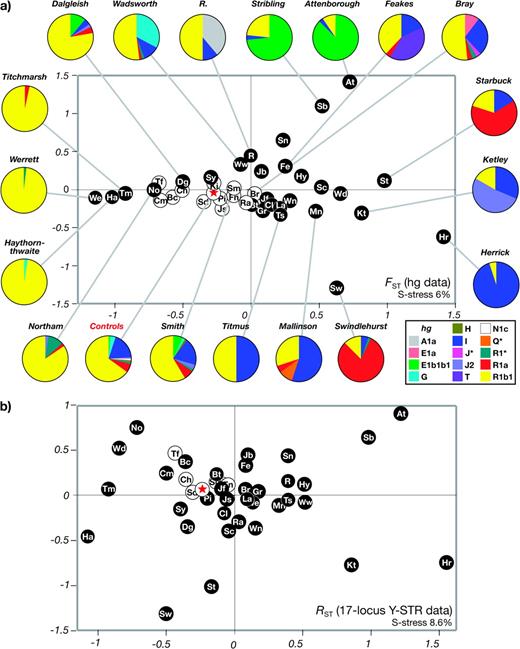
Relationships among 40 different surnames represented by MDS. (a) MDS analysis of 40 surnames (represented by abbreviations as shown in fig. 1) and controls (red star), based on pairwise FST calculated from haplogroup frequencies. White circle symbols indicate surnames not significantly different (P ≥ 0.05) from controls. Around the MDS plot are pie charts for selected surnames and controls, indicating haplogroup frequencies by sector areas colored according to the key below right. (b) MDS analysis of 40 surnames (represented by abbreviations as shown in fig. 1) and controls (red star), based on pairwise RST calculated from Y-STR haplotype frequencies. White circle symbols indicate surnames not significantly different (P ≥ 0.05) from controls.
Y-STR Haplotype Diversity and Descent Clusters
Y-STRs provide a means to investigate the relationships among chromosomes within surnames in more detail. Typing of 17 Y-STRs confirms the marked differences between surnames and between surnames and controls. Even for these highly variable markers, we see gene diversity values as low as 0.497 (Attenborough) compared with 0.999 for controls (fig. 1). MDS based on pairwise RST (fig. 2b) presents a broadly similar picture to that based on haplogroup diversity, but samples are more scattered in the plot, and now 34/40 (85%) are significantly different (P < 0.05) from controls. This magnification of differences between surnames suggests that Y-STR haplotyping is acting to reveal distinct sublineages within haplogroups. Again, there is a significant relationship between surname frequency rank and gene diversity (Spearman's r = 0.601; P = 5.87 × 10⁻⁵).
Networks (fig. 3; supplementary fig. 3, Supplementary Material online) provide a means of identifying such sublineages and displaying the relationships between haplotypes within surnames. The network of haplotypes among the 110 controls (fig. 3a) is composed overwhelmingly of singletons: Hundred and two haplotypes are unique, and four are present twice each. A similar picture is presented by the commonest British surname, Smith (fig. 3b). Most other surnames, however, are very different from the controls, typically showing one or more haplotypes that are shared by many individuals (notably, haplotype sharing generally crosses spelling variants, consistent with the relatively recent fixation of spellings—see supplementary table 1, Supplementary Material online). A good example is Ketley (fig. 3c), which is dominated by a single 17-Y-STR haplotype within hgJ2 shared by 20 individuals, forming the core of a cluster of 27 haplotypes belonging to the same haplogroup.
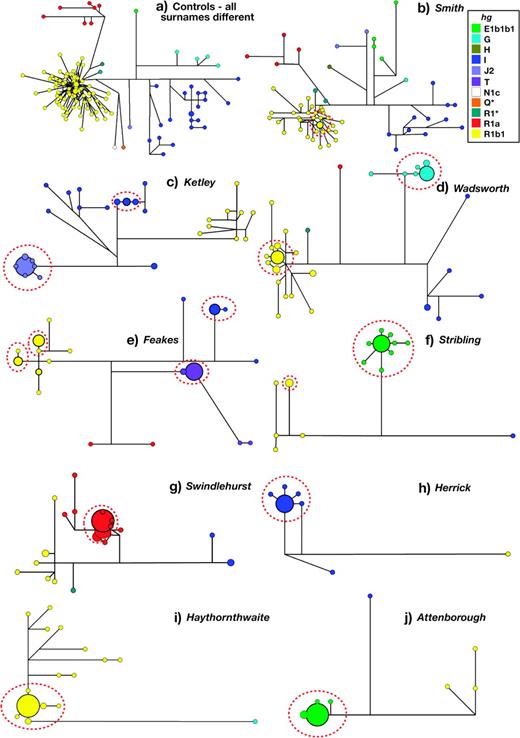
Selected median-joining networks showing haplogroup and Y-STR haplotype diversity within controls and surname samples. Circles represent haplotypes, with areas proportional to frequency and colored according to haplogroup as shown in the key, top right. Lines between circles represent Y-STR or binary-marker mutational steps, with the shortest line in each network representing a single step. Boundaries of descent clusters are shown by the dotted ellipses.
One interpretation of this cluster is that it reflects descent from a common ancestor, through a shared surname. The rarity of hgJ2 in the general population (1% among controls) supports this, because chromosomes from this haplogroup are unlikely to enter the surname through NPTs. Furthermore, a network of all hgJ2 chromosomes (supplementary fig. 1, Supplementary Material online) shows that the Ketley cluster is discrete even when the haplogroup is considered as a whole across different surnames. This approach, of identifying rare-haplogroup clusters within surnames (hgsA1a, E1b1b1, G, J*, J2, R1*, and R1a; data not shown, though networks are illustrated in fig. 3 and supplementary fig. 3, Supplementary Material online), allows a set of ad hoc rules to be established to define descent clusters, and then applied to all haplogroups (see Materials and Methods).
The surnames represented in figure 3d–j contain examples of descent clusters, many of which represent the majority of chromosomes within a surname: in the example of Attenborough, all of the hgE1b1b1 haplotypes, representing 87% of the sample, belong to a single descent cluster. In contrast, some surnames contain few or no descent clusters. How does the frequency of a surname influence the degree of clustering within networks? For the set of 40 surnames, the mean proportion of haplotypes within clusters is 62%, and this proportion is significantly correlated with surname frequency rank (Spearman's r = 0.48; P = 0.0187). The proportion of haplotypes lying within the largest descent cluster is even more strongly correlated (Spearman's r = 0.62; P = 1.20 × 10⁻⁶; fig. 4a), and this might indicate that rarer surnames are more likely to have had fewer founders at the time of surname establishment. In particular, for five surnames (Attenborough, “Haythornthwaite,” Herrick, “Stribling,” and Swindlehurst) ≥70% of all haplotypes fall into clusters, and ≥70% fall into the largest cluster. One interpretation of these patterns is that they each reflect foundation by a single man.
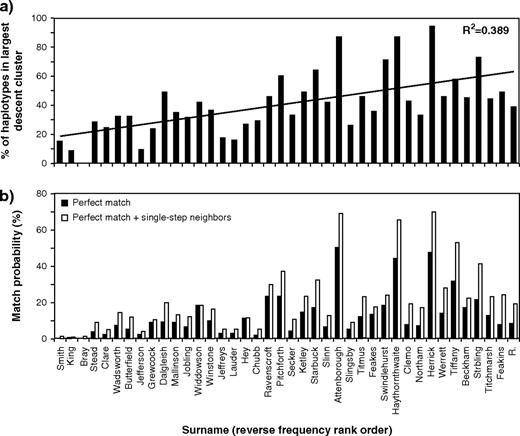
Proportions of haplotypes in largest descent cluster and match probabilities. (a) Percentage of haplotypes lying in the largest descent cluster, with surnames ordered by reverse frequency rank. (b) Match probabilities for perfectly matching haplotypes, and matches including single-step mutational neighbors, with surnames ordered by reverse frequency rank.
Time Depths of Descent Clusters
We can ask how the ages of the clusters relate to the time period of surname establishment (on average, the last 700 years), by estimating their TMRCAs using the rho statistic (Forster et al. 1996) within Network. Error will be introduced by the ad hoc definition of clusters here. Other key variables in such estimates are the generation time and the mutation rate of Y-STRs. Previously, we have derived a suitable generation time of 35 years for the past 700 years for Britain from historical records (King et al. 2006). Direct analysis of Y-STR haplotypes in father–son pairs gives mutation rate estimates around 2.1 × 10⁻³ per STR per generation (Gusmão et al. 2005), whereas an “evolutionary” rate based on diversity accumulated in specific lineages within populations (Zhivotovsky et al. 2004) provides a rate some three times lower, at 6.9 × 10⁻⁴. No mutation study has surveyed the set of 17 Y-STRs we used, and the timescale of neither father–son pairs nor population-based estimates seem well suited to the situation of surname studies. We therefore chose to estimate a mutation rate by typing the 17 Y-STRs in a set of deep-rooting pedigrees totaling 274 transmissions of the Y chromosome, and with a mean pairwise separation within all pedigrees of 5.6 generations (supplementary fig. 2, Supplementary Material online). This gave a rate of 1.5 × 10⁻³ per STR per generation. Figure 5 shows the mean and standard deviations of ages for a total of 74 clusters based on these parameters. TMRCAs for individual clusters range from 125 years (“Ravenscroft”) to 1,625 years (Stead), with large standard deviations. For 62% of clusters the TMRCA is within the time of surname establishment, and if we consider the lower age limit, this proportion is 95%. The overall mean age of all clusters is ∼650 years. For three clusters, even the lower age limit predates the time of surname establishment; all three are within the high frequency haplogroup hgR1b1, where the outer limits of clusters may include haplotypes that are not related to the core haplotype by ancestry (descent), but rather by state. Note that use of the evolutionary mutation rate (Zhivotovsky et al. 2004) would yield a mean cluster TMRCA of ∼1,880 years, more than 2.5 times older than the time of surname establishment.
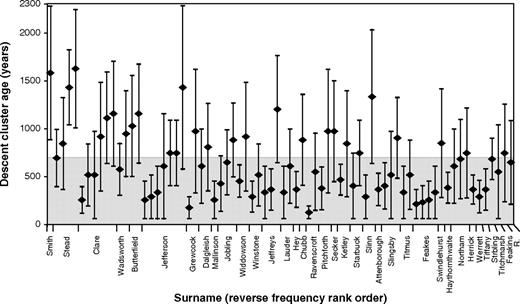
Estimated ages of 74 descent clusters. Diamonds indicate estimates of TMRCA from the rho statistic within Network, and bars indicate standard deviations. The gray shaded area indicates the time since surname establishment (700 years). Surnames are ordered by frequency rank; note that some surnames contain more than one descent cluster that can be dated, whereas four (King, Bray, “Clemo,” and Beckham) contain none.
For each of the five surnames showing single, very dominant descent clusters, we can use the TMRCA of the cluster to estimate a nonpaternity rate that would explain the number and diversity of chromosomes that lie outside it, under the assumption that there was indeed a single founder. Although the structure of the underlying genealogy is unknown, we can consider two extreme possible genealogies to give a range within which the true nonpaternity rate should lie (supplementary fig. 4, Supplementary Material online). The first extreme maximizes the number of generations in a star-like genealogy, in which all haplotypes descend independently. The other extreme minimizes the length of the genealogy by including the maximum plausible level of coancestry: here, all haplotypes within any cluster are considered to belong to second cousins (closer relationships having been excluded by the sampling strategy), with the remaining haplotypes descending independently as before. This approach yields the following rates: Attenborough 1.29–3.39%; Haythornthwaite 2.07–4.54%; Herrick 1.00–2.47%; Stribling 1.00–2.87%; and Swindlehurst 1.04–2.76%. However, it should be noted that if, in fact, these surnames had multiple founders, but only one founding lineage had survived to yield a sampled descent cluster (see Discussion), then the true nonpaternity rates would be lower than our estimates.
Discussion
Our analysis of 40 British surnames demonstrates a remarkably strong relationship between these patrilinearly inherited cultural markers and Y-chromosomal haplotypes. The presence of descent clusters in most surnames, and the predominance in many low frequency names of single large clusters, point unambiguously to high levels of coancestry. Interpreting what this means for the histories of surnames and the haplotypes they contain, however, is more complex.
The first study of the relationships between surnames and Y diversity was an analysis of the surname “Sykes” (Sykes and Irven 2000), where the pattern of Y-STR haplotypes was interpreted as indicating a single founder for the name at the time of surname establishment (about 20 generations ago), followed by the introgression of other lineages through NPTs. Although the mean TMRCA estimate of the descent clusters we identify (∼650 years) might seem consistent with this time depth, some examples (even given the inherent inaccuracy of the estimates) are remarkably recent. Upper limits for the TMRCAs of clusters within Ravenscroft, “Grewcock,” and Feakes are only 190, 290, and 360 years, respectively, despite documentary evidence (Hanks and Hodges 1988; Reaney and Wilson 1997) that all three names were in existence by the early 14th century—such recent expansions of lineages within surnames suggest a strong influence of genetic drift. Over time, such drift contributes to the extinction of some Y chromosome haplotypes and the fluctuation in the frequency of surviving Y chromosome haplotypes within surnames. The more drift, the fewer founding Y chromosome haplotypes of a surname are likely to have survived, and the more genetic diversity will have been lost from the surname group.
Consideration of surname types also supports the idea that current diversity may not be a reflection of their history of foundation. For example, the surnames dominated by a single descent cluster are not all of a type that we might expect to have been founded only once—Herrick being derived from a first name, Stribling from a nickname and Attenborough from a landscape feature (fig. 1). The same is certainly true of Sykes, which derives from a word for boundary ditch or stream. We can make a more general comparison in our data set (fig. 1) of those surnames that seem most likely to have single founders (n = 14; based on village or other local place names) and those that seem better candidates for multiple foundation (n = 14; based on occupations, patronyms, nicknames, or topographical features). Considering the proportion of haplotypes lying in the largest cluster, there is no significant difference between the two sets (P = 0.75; chi square test)—although larger sizes are desirable for a more powerful test.
Taken together, these observations suggest that current patterns of diversity within surnames do not generally reflect their early histories, ∼20 generations ago, and that more recent events have probably played a key role. Forward simulations based on various numbers of founders, incorporating population size change and variance in offspring numbers, confirm the importance of drift, with the chance of survival of a lineage from a single founder through 20 generations being only 9.6%. Generally, the number of founders is a very poor predictor of the likely number of descent clusters observed in simulated data (fig. 6), showing that inferring single foundation, 20 generations ago, from the patterns found in names such as Attenborough is unwise.
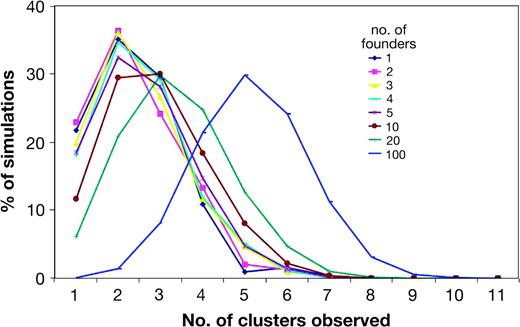
Numbers of observed descent clusters given different founder numbers in simulated data. Ten thousand simulations were carried out for each founder number; most give no descendants. Percentages here are based on at least 100 simulations in each of which at least 100 descendants survive.
An analogous study to ours has been carried out on 1,125 males carrying 43 different Irish surnames (McEvoy and Bradley 2006). Haplogroup diversity in Ireland is very low, with ∼90% of chromosomes falling into hgR1b1, so no meaningful comparison can be done using haplogroups. However, Irish haplotype data include the 17 Y-STRs typed in this study, allowing the studies to be compared readily. Irish control chromosomes, like British ones, show very little haplotype sharing. Within Irish surnames, however, descent clusters are evident (McEvoy and Bradley 2006). Based on our cluster definition and dating procedure, the mean TMCRA of the Irish clusters is ∼990 years, compared with the equivalent British value of ∼650 years—these values are compatible with the different average time depths of surname establishment in the two countries, of ∼900 years (McEvoy and Bradley 2006) and ∼700 years, respectively. Strikingly, many Irish names, including examples like “Ryan,” “O'Sullivan,” “O'Neill,” and “Byrne” each with ∼40,000 bearers (∼0.8% of the population), show substantial major clusters within networks. This is very different to the finding for British names, where those with more than ∼10,000 bearers (∼0.02% of the population) show no significant clustering at all.
For the set of 28 Irish surnames for which sample sizes are greater than 10, the mean proportion of haplotypes within clusters is 61%—very similar to that for the British surnames (62%). However, unlike the British names, this proportion shows no correlation with surname frequency rank (Spearman's r = −0.001; P = 0.996). The proportion of haplotypes lying within the largest descent cluster is actually somewhat higher in Ireland than that in Britain (46% compared with 41%), but again is not significantly correlated with frequency rank (Spearman's r = 0.125; P = 0.527). The difference is also observed when we consider the relationship of surname frequency rank with gene diversity for Y-STR haplotypes in Ireland, which, though significant, is less strong than that in Britain (Spearman's r = 0.436; P = 0.02). These findings suggest a difference in the history of surname formation and/or transmission between the two countries. The key observation is the high degree of coancestry observed even in the common Irish names: One explanation could be higher recent populationwide drift than in Britain. Two possible sources of such a difference suggest themselves—the “Great Hunger” of the mid-19th century, which reduced the Irish population by about 20% (Cullen 1987), and the long-term high variance of reproductive success due to medieval polygynous and patrilineal dynasties in Ireland (Moore et al. 2006; McEvoy et al. 2008). Historical Irish demographic data are not readily available, so it is not possible to simulate Irish surname evolution directly. However, for the case of the famine, we can apply an analogous population decline to our British simulations and ask if there is a marked effect on the diversity of haplotypes in surnames. The chief outcome is a marked reduction in the number of simulations in which any descendants survive, but the relationship between the number of founders and the number of observed clusters changes only slightly (data not shown). We therefore consider it more likely that the longer-term demographic effects of past polygyny are responsible for the differences between Ireland and Britain. However, it is also worth noting that the histories of Britain and Ireland differ in other respects—in particular, in the greater extent of urbanization in Britain following the Industrial Revolution, and in the differential impacts of infectious disease such as the Black Death. More sophisticated modeling approaches are needed to account for other variables.
In our previous study of pairs of men sharing surnames (King et al. 2006), we proposed that a database of surnames and associated Y profiles would have forensic utility in suggesting surnames from crime-scene samples left by males. For common names (>6,000 bearers) there is poor predictive power because of high haplotype diversity, whereas for rare names (<50 bearers) the approach would be inefficient because crime-scene samples are relatively unlikely to be deposited by bearers, so targeting of the intermediate frequency range, encompassing ∼39,000 names, seems most practical. In the large data set presented here the match probability (the chance of two haplotypes drawn at random from a surname being identical) shows a strong correlation with surname frequency rank (Spearman's r = 0.59; P = 7.65 × 10⁻⁵; fig. 4b). It reaches 50.3% in Attenborough, and if we allow for one-step and two-step STR mutational neighbors to account for observed variation within descent clusters, this increases to 69.2% and 74.6%, respectively. For the 35 less-common surnames in our set the mean value of the match probability is 14.5%, and accounting for one-step and two-step STR mutational steps increases this value to 23.5% and 28.5%, respectively. These high probabilities support the potential usefulness of the surname estimation approach as an investigative tool: surnames retrieved by the search could be sought in a suspect pool, and suspects subsequently excluded or matched using conventional autosomal DNA profiling.
Our study strives for respectability with its sample size of 1,678; however, this pales into insignificance compared with the scale of some of the commercial DNA-genealogy typing efforts. One large company (www.familytreedna.com) carries, at the time of writing, 148,916 Y-DNA profiles, many at much higher STR resolution than those we have generated here, with associated surnames. Public interest in genealogical genetics is also contributing on a massive scale to population genetics via the Genographic Project (www3.nationalgeographic.com/genographic) and Sorensen Molecular Genealogy Foundation (www.smgf.org). However, although the haplotypes in these projects represent a tremendous potential resource for scientific studies of surnames and past demography, sample ascertainment bias (in particular self-selection of men who may be closely related and self-reporting of data) remains a serious and unquantified problem that could affect interpretation.
Finally, we note that the simple identification (through a combination of surname and Y haplotyping) of potentially large groups of men in outbred populations who unequivocally share common ancestry within the last 20 generations might have genetic epidemiological relevance: In terms of coancestry, they lie somewhere between the traditional pedigree and the population (McQuillan et al. 2008) and have potential to act as a resource to aid the identification of disease genes. We are currently undertaking genomewide SNP analysis of men whose Y chromosomes belong to descent clusters, with the aim of determining the proportion of the genome identical-by-descent among these distantly, but unambiguously, related individuals.
We thank all DNA donors and Emma Parkin and Georgina Bowden for assistance with Y-STR typing in pedigrees. We also thank Patricia Balaresque, Matthew Hurles, David Hey, George Redmonds, Kevin Schürer, and Brian McEvoy for help with various aspects of the study, and Chris Tyler-Smith and two anonymous reviewers for comments on the manuscript. T.E.K. was supported by a Wellcome Trust Prize Studentship (grant no. 061129) and M.A.J. by a Wellcome Trust Senior Fellowship in Basic Biomedical Science (grant no. 057559).
References
Author notes
Connie Mulligan, Associate Editor
