


Abstract
The developmental hourglass model has been used to describe the morphological transitions of related species throughout embryogenesis. Recently, quantifiable approaches combining transcriptomic and evolutionary information provided novel evidence for the presence of a phylotranscriptomic hourglass pattern across kingdoms. As its biological function is unknown it remains speculative whether this pattern is functional or merely represents a nonfunctional evolutionary relic. The latter would seriously hamper future experimental approaches designed to test hypotheses regarding its function. Here, we address this question by generating transcriptome divergence index (TDI) profiles across embryogenesis of Danio rerio, Drosophila melanogaster, and Arabidopsis thaliana. To enable meaningful evaluation of the resulting patterns, we develop a statistical test that specifically assesses potential hourglass patterns. Based on this objective measure we find that two of these profiles follow a statistically significant hourglass pattern with the most conserved transcriptomes in the phylotypic periods. As the TDI considers only recent evolutionary signals, this indicates that the phylotranscriptomic hourglass pattern is not a rudiment but possibly actively maintained, implicating the existence of some linked biological function associated with embryogenesis in extant species.
Introduction
Embryogenesis coordinates the transformation of a single fertilized egg cell into a differentiated, complex organism. Based on von Baer’s third law of embryology (1828), it has been observed that embryos of animal species from the same phylum share a developmental stage with apparent morphological similarities. Animal embryos from the same phylum often appear morphologically different in early embryogenesis, converge to a similar form during mid-embryogenesis, and diverge again in late embryogenesis. This morphological pattern is known as the developmental hourglass pattern (Duboule 1994; Raff 1996), and the stage or period of maximum morphological conservation in mid-embryogenesis is called phylotypic stage (Sander 1983) or phylotypic period (Richardson 1995).
Recently, several groups succeeded in providing a possible explanation for the morphological hourglass pattern in animals by observing an hourglass pattern also at the transcriptome level. Distance-based comparisons of transcriptomes of related species (Kalinka et al. 2010; Irie and Kuratani 2011; Levin et al. 2012) or transcriptome indices based on the combination of evolutionary with transcriptomic information of a single species (Domazet-Lošo and Tautz 2010; Quint et al. 2012) revealed the existence of transcriptomic hourglass patterns in different lineages including even plants. The latter is particularly remarkable because the last common ancestor of animals and plants was most likely unicellular, meaning that both multicellularity and embryogenesis evolved independently in both kingdoms (Meyerowitz 2002). As a consequence, phylotranscriptomic hourglass patterns associated with embryogenesis in animals and plants likely represent an example of convergent evolution.
Distance-based transcriptome comparisons are well established and measure the dissimilarity or distance of expression profiles of orthologous genes among related species. By following this approach, it was found that transcriptomes of Drosophila (Kalinka et al. 2010), Caenorhabditis (Levin et al. 2012), and turtle (Wang et al. 2013) ssp. are more similar during the morphological phylotypic period in mid-embryogenesis than transcriptomes in early or late embryogenesis. These findings were recently supported by an independent metazoan cross-phyla approach (Gerstein et al. 2014).
While distance-based transcriptome comparisons require transcriptomic information of at least two species or genotypes, transcriptome indices require such information for only a single genotype. Here, evolutionary information of a gene such as phylogenetic age or sequence divergence is combined with its expression level for the computation of transcriptome indices such as the transcriptome age index (TAI, Domazet-Lošo and Tautz 2010) or the transcriptome divergence index (TDI, Quint et al. 2012).
The TAI is based on phylostratigraphy (Domazet-Lošo et al. 2007), which assigns a phylogenetic age to each protein-coding gene in a species of interest by identification of homologous sequences in other species. Following this procedure, genes can be sorted into discrete age categories, named phylostrata (PS), corresponding to hierarchically ordered phylogenetic nodes along the tree of life. The phylogenetic age of each gene quantified by its PS is then weighted by its expression level. The weighted mean of all gene ages yields the TAI (Domazet-Lošo and Tautz 2010), which represents the mean evolutionary age of a transcriptome. As gene age can date back to times before the divergence of prokaryotes and eukaryotes, the TAI incorporates both evolutionarily ancient and recent signals.
The TDI is based on the sequence divergence of protein-coding genes (Ka/Ks ratio) as an indicator of selective pressure (Quint et al. 2012). In analogy to PS, genes can be sorted into discrete sequence divergence categories, named divergence strata (DS), ranging from purifying to positive selection. In analogy to the TAI, the sequence divergence of each gene quantified by its DS is weighted by its expression level, and the weighted mean of all sequence divergences yields the TDI, which represents the mean sequence divergence of a transcriptome. In contrast to the TAI, the TDI focuses on recent evolution among related species. To be more precise, the evolutionary time span investigated by the TDI reaches from “today” to the time when the two selected species split. Depending on the chosen species, this may be as little as a few million years. Hence, distance-based transcriptome comparisons and transcriptome indices such as TAI or TDI quantify different evolutionary properties of one or several transcriptomes.
Irrespective of the phylotranscriptomic evidence recently obtained, the developmental hourglass model is controversially discussed to this day. Its biological function is rather poorly understood and hardly goes beyond hypotheses (Raff 1996; Kalinka and Tomancak 2012). Although convergent evolution within the animal lineage cannot be excluded, the existence of phylotranscriptomic and morphological hourglass patterns in numerous animal phyla suggests that it might have evolved early in the animal lineage. The developmental hourglass pattern could, therefore, be regarded as evolutionarily ancient. However, it is unclear whether this pattern is being actively maintained and still functional in extant species, or whether it represents a nonfunctional rudiment of a process that was once functional but has since then degenerated.
To be able to—one day—decipher the function of developmental hourglass patterns, we need to investigate this phenomenon in an experimental manner. Naturally, experiments are restricted to extant species. If actively maintained, such experiments could potentially reveal the molecular function of the developmental hourglass pattern. If, however, the developmental hourglass pattern were an evolutionary relic not functional in extant species, experimental approaches would be largely obsolete. The objective of this study is to investigate whether or not the developmental hourglass pattern is actively maintained in extant species and thus potentially allows to investigate its molecular function by experimental approaches.
To address this, we study gene ages and TAI profiles as well as sequence divergences and TDI profiles of the vertebrate Danio rerio, the invertebrate Drosophila melanogaster, and the flowering plant Arabidopsis thaliana. TAI profiles are based on both evolutionarily ancient and recent signals all along the tree of life. Hence, the TAI does not convey information about a possible active maintenance of the hourglass pattern. TDI profiles, however, with their distinctive feature of capturing only recent evolutionary signals are potentially able to address this question. To avoid subjective evaluation of the resulting profiles, we introduce three permutation tests, the flat line test, the reductive hourglass test, and the reductive early conservation test, to quantify the statistical significance of the corresponding phylotranscriptomic patterns. In addition, our study will provide support for either the hourglass model or possibly also other models that are currently being discussed.
Results
In the context of the developmental hourglass, morphological and—as we define them—phylotranscriptomic patterns have to be distinguished. This study addresses phylotranscriptomic patterns, which can be divided in distance-based transcriptome comparisons and transcriptome index-based approaches. Transcriptome indices, which are the subject of this work, can again be computed as either TAI or TDI.
Although distance-based transcriptome comparisons show that mid-embryonic stages have a lower gene expression diversity than early and late stages of embryonic development (reviewed in Kalinka and Tomancak 2012), the developmental hourglass model is still controversially discussed. TAI analyses have to date been performed for Da. rerio, D. melanogaster, Anopheles gambiae, and A. thaliana (Domazet-Lošo and Tautz 2010; Quint et al. 2012). The results largely confirmed the observations from distance-based transcriptome comparisons in that they identified the most ancient transcriptome during mid-embryogenesis. However, these previous analyses are hardly comparable because they were computed 1) with different genome databases, 2) with different analysis pipelines, and 3) in the case of D. melanogaster only for approximately one-quarter of the genes.
To allow for optimal comparability of TAI patterns across species, we here reanalyze TAI profiles of embryonic development of Da. rerio, D. melanogaster, and A. thaliana in a consistent manner based on the same sets of genomes, the same pipeline, and updated phylostratigraphic maps. For D. melanogaster we use whole transcriptome expression data (Graveley et al. 2011) instead of the previously used data set that consisted of only 3,550 genes (Arbeitman et al. 2002). Based on the obtained TAI patterns, we will then turn our attention to the TDI and this study’s central question of whether or not the evolutionary signal that shaped the hourglass pattern might be actively maintained.
TAI Profiles of Da. rerio, D. melanogaster, and A. thaliana Embryogenesis
We first set up a common database of 4,557 completely and partially sequenced genomes for the generation of updated phylostratigraphic maps of the three species of interest. This database is several times larger than the databases used in previous studies (e.g., Quint et al. 2012) and contains genome information from 2,770 prokaryotes (2,511 bacteria and 259 archea) and 1,787 eukaryotes (883 animals, 364 plants, 344 fungi, and 193 other eukaryotes) (supplementary fig. S1 and Supplementary Data, Supplementary Material online, database available for download at http://msbi.ipb-halle.de/download/phyloBlastDB_Drost_Gabel_Grosse_Quint.fa.tbz, last accessed August 2, 2015). Based on this database, we construct phylostratigraphic maps of Da. rerio, D. melanogaster, and A. thaliana using a customized pipeline. The three resulting phylostratigraphic maps are displayed in figure 1A–C (supplementary table S2, Supplementary Material online).
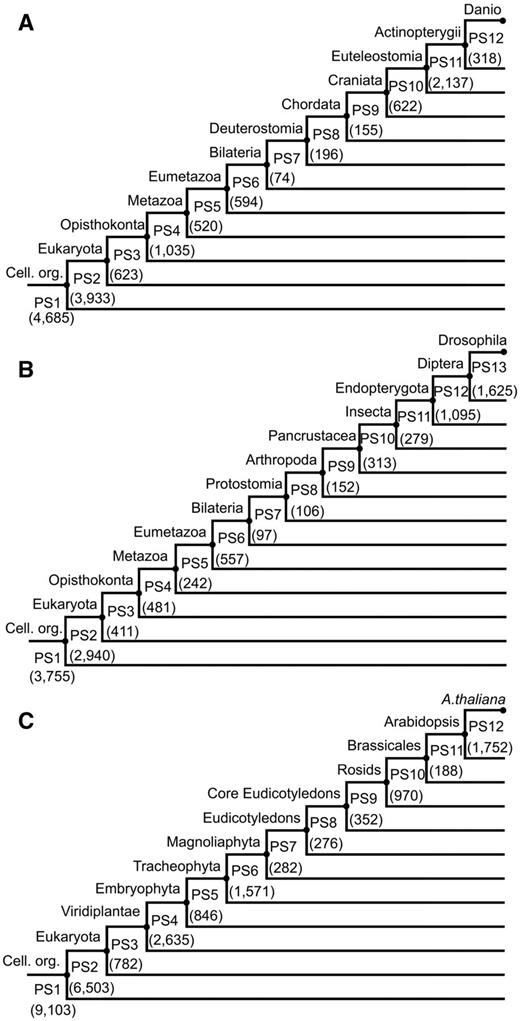
Phylostratigraphic maps for Danio rerio, Drosophila melanogaster, and Arabidopsis thaliana. (A) Danio rerio. (B) Drosophila melanogaster. (C) Arabidopsis thaliana. Numbers in parenthesis denote the number of genes per phylostratum (PS1–PS12/13). Cell. org., cellular organisms described by PS1.
We next compute the TAI for each of the three species and each of the developmental stages. The resulting TAI profiles across embryogenesis for all three species are shown in figure 2 (expression values provided in supplementary table S3, Supplementary Material online). If the mean evolutionary ages of the transcriptomes were the same at different developmental stages, the TAI profile would be a horizontal line. To objectively test the statistical significance of the observed variations of the TAI at different developmental stages, we apply a permutation test that we refer to as the flat line test (Quint et al. 2012). When applying this flat line test to the three TAI profiles, we find that the TAI patterns of all three species deviate significantly from a horizontal line (P < 0.05). Visually, the TAI profiles of Da. rerio and A. thaliana show an hourglass pattern. Although still within the standard deviation of the phylotypic period, the absolute minimum of the D. melanogaster TAI profile can be found at the 0–2 h time point in early embryogenesis (fig. 2). This is unexpected and in contrast to comparative transcriptomic approaches, which consistently identified highly divergent transcriptomes in early Drosophila embryogenesis (Kalinka et al. 2010; Gerstein et al. 2014). However, we hesitate to overinterpret this observation because the overall profile still resembles an hourglass pattern.
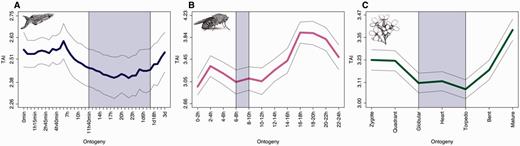
TAI profiles across animal and plant embryogenesis. (A) Danio rerio. (B) Drosophila melanogaster. (C) Arabidopsis thaliana. The blue shaded area marks the predicted phylotypic period. The gray lines represent the standard deviation estimated by permutation analysis.
Given that the TAI does not focus on recent evolution and that the majority of genes in all three species map to “old” PS (fig. 1), these results indicate that the phylotranscriptomic hourglass pattern is not a recent innovation. Although TAI patterns alone do not allow this conclusion, the existence of phylotranscriptomic hourglass patterns across kingdoms and the existence of morphological hourglass patterns across animals suggest that these patterns emerged alongside with embryogenesis in early evolution. This suggestion is in accordance with previous findings showing that genes, transcriptomes, and molecular processes are most conserved during the phylotypic period (Galis and Metz 2001; Hazkani-Covo et al. 2005; Davidson and Erwin 2009; Domazet-Lošo and Tautz 2010; He and Deem 2010; Kalinka et al. 2010; Irie and Kuratani 2011; Peter and Davidson 2011; Levin et al. 2012; Quint et al. 2012; de Mendoza et al. 2013; Piasecka et al. 2013; Schep and Adryan 2013; Wang et al. 2013).
Dependence of PS and DS
Before turning to the central question of whether or not the observed hourglass patterns might be actively maintained, we test in this section whether PS and DS are sufficiently independent of each other. This independence—or an only weak dependence—of PS and DS is important to assure that TAI and TDI profiles are not dependent on each other. Only in this case, the TDI can provide additional information and conclusions that cannot be drawn based on TAI profiles alone.
For computing DS in analogy to PS, we generate orthologous gene sets for the computation of sequence divergences (Ka/Ks) by pairwise comparisons of the coding sequences of a target species to a related species with a completely sequenced and annotated genome. To lend more support to the TDI profiles to be generated, we compute the sequence divergence for three additional related species for each of the three target species (supplementary figs. S2–S4, Supplementary Material online).
For Da. rerio closely related fish genomes are not yet available. Here, we use Astyanax mexicanus (divergence time∼153 Ma, Hedges et al. 2006), Takifugu rubripes, Xiphophorus maculatus, and Gadus morhua (divergence time for all three species ∼265 Ma, Hedges et al. 2006). For the assignment of Ka/Ks values of D. melanogaster genes, we compare its coding genome to D. simulans (divergence time ∼3 Ma, Hedges et al. 2006), D. yakuba (divergence time ∼7 Ma, Hedges et al. 2006) D. persimillis (divergence time ∼34 Ma, Hedges et al. 2006), and D. virilis (divergence time ∼47 Ma, Hedges et al. 2006). For A. thaliana we use the Brassicas A. lyrata (divergence time ∼5–10 Ma, Hu et al. 2011), Capsella rubella (divergence time ∼10–14 Ma, Koch and Kiefer 2005), Brassica rapa (divergence time ∼16 Ma, Hedges et al. 2006), and Carica papaya (divergence time ∼72 Ma, Hedges et al. 2006). For each pairwise comparison we sort the continuous Ka/Ks values into deciles and obtain a discrete DS for each gene and each of the four reference species with a detectable ortholog (provided in supplementary table S4 and Supplementary Data, Supplementary Material online).
To study to which degree gene age and sequence divergence are correlated for Da. rerio, D. melanogaster, and A. thaliana, we compute Kendall’s rank correlation coefficient of PS and DS, which quantifies the degree of linear dependence between PS and DS per species in a nonparametric manner. In figure 3 we display correlation plots of the three target species to their closest related species. We consistently find that correlations of PS and DS are significant but only weak (Kendall’s rank correlation coefficient <0.25; fig. 3A–C; supplementary tables S2 and Supplementary Data and Supplementary Data, Supplementary Material online, for the additional species comparisons), stating that TAI and TDI have the potential of capturing independent evolutionary signals for all three species.
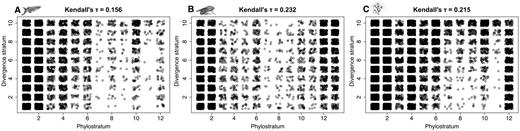
Correlation between phylostratum (PS) and divergence stratum (DS). Scatter plots of phylostratum versus divergence stratum over all genes. (A) Danio rerio. (B) Drosophila melanogaster. (C) Arabidopsis thaliana. Ka /Ks ratios for divergence stratum assignment are derived from orthologous genes between Da. rerio and Astyanax mexicanus (A), D. melanogaster and D. simulans (B) and A. thaliana and A. lyrata (C). Kendall τ values denote the Kendall rank correlation coefficients quantifying the degree of linear dependence between PS and DS in a nonparametric manner. All Kendall τ values are significant (P < 2.2e-16) using Kendall’s τ test of no correlation.
TDI Profiles of Da. rerio, D. melanogaster, and A. thaliana Embryogenesis
Next, we finally investigate whether or not the evolutionary selection pressure that has shaped the hourglass pattern might still be active. To address this question, we compute the TDI profiles for all three species, which might potentially identify evidence for or against active maintenance, and thus functionality, of the hourglass pattern in extant species.
If the developmental hourglass pattern were not maintained and therefore under no selective pressure, the TDI profile would resemble a horizontal line. In contrast, if the developmental hourglass pattern were actively maintained in extant species, possibly because it still served an important biological function, the TDI profile should deviate from a horizontal line and take an hourglass-like shape.
Figure 4 shows the TDI profiles across embryogenesis for all three species based on DS values obtained from ortholog assignment to the closest related species. Applying the flat line test, we find that the TDI patterns of all three species deviate significantly from a horizontal line (P < 0.05), demonstrating that selective pressure is acting on embryonic transcriptomes across kingdoms. Visually, the TDI profiles of D. melanogaster and A. thaliana show an hourglass pattern, whereas the TDI profile of Da. rerio shows only the first two-thirds of an hourglass pattern with an increase of TDI values in late embryogenesis being barely noticeable. The TDI profiles for all other pairwise comparisons largely yield similar results (supplementary figs. S2–S4 and Supplementary Data, Supplementary Material online).
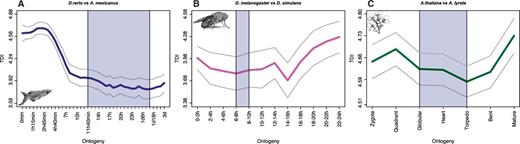
TDI profiles across animal and plant embryogenesis. (A) Danio rerio. (B) Drosophila melanogaster. (C) Arabidopsis thaliana. The blue shaded area marks the predicted phylotypic period. The gray lines represent the standard deviation estimated by permutation analysis.
These findings indicate that the phylotranscriptomic hourglass pattern is not a rudiment of a process that was once active but has progressively degraded since then. On the contrary, its evolutionary signal can still be detected even when evolutionary measures are consulted that account only for the last few million years.
Objective Testing for Potential Hourglass Patterns
The studies presented above and all other studies published to date based on distance-based transcriptome comparisons or transcriptome indices have either relied on subjective visual profile interpretation (de Mendoza et al. 2013; Piasecka et al. 2013), have tested whether the observed profile deviated from a horizontal line (Domazet-Lošo and Tautz 2010; Irie and Kuratani 2011; Quint et al. 2012; Wang et al. 2013, figs. 2 and 4 this study), or have tested whether the observed profile could be fitted by a parabolic function (Hazkani-Covo et al. 2005; Kalinka et al. 2010; Levin et al. 2012).
Naturally, subjective pattern evaluation should be avoided. In addition, the above described statistical approaches have severe limitations: 1) Testing whether the observed profile deviates from a horizontal line does not indicate the existence of an hourglass pattern, because the observed pattern could be anything different from a horizontal line that might even be in agreement with “competing” models such as the early conservation model and 2) testing whether the observed profile could be fitted by a parabolic function indicates the existence of an hourglass pattern, but the strict mathematical form of the pattern (parabola) makes this test highly specific and insensitive to other (nonparabolic) high–low–high patterns. Furthermore, none of these tests provides information about the significance of the localization of the most conserved stages, which is central to the evaluation of potential hourglass patterns.
Here, we propose a statistical test for a general high–low–high hourglass pattern not restricted to a parabolic function where the lowest phase must coincide with the presumptive phylotypic period. We divide embryogenesis in an early module, the phylotypic module, and a late module based on a priori morphological information about the known phylotypic period in animals (fig. 5A). As, in contrast to animals, morphological evidence for a phylotypic period is still lacking in plants, it is impossible to define the phylotypic module for plant embryogenesis in analogy to animal systems. Hence, other biological processes that are likely associated with the phylotypic period had to be taken into account to legitimate a meaningful designation of the A. thaliana phylotypic module. Here, the mid-embryonic globular–heart–torpedo stages comprise embryonic morphogenesis and body plan establishment including the initiation and activation of the two apical stem cell niches, that give rise to the vast majority of organs throughout plant life. In addition, essential genes that cause embryo-defective phenotypes are likewise highly expressed during this period, indicating associated selective constraints (supplementary fig. S8, Supplementary Material online). Based on these observations, we regard the developmental period encompassing globular, heart, and torpedo embryos as the most reasonable choice for designating the phylotypic period in A. thaliana. Next, we compute the differences between the mean values of the transcriptome indices of the early and the phylotypic module and of the late and the phylotypic module. The minimum of these two differences (early vs. phylotypic and late vs. phylotypic) serves as test statistic for a high–low–high pattern. Hence, this test recognizes patterns as hourglass patterns when the most ancient or most conserved transcriptomes occur in the phylotypic module (fig. 5A, see Materials and Methods). As this test reduces the ontogenetic stages to three developmental modules, we refer to this test as the reductive hourglass test.
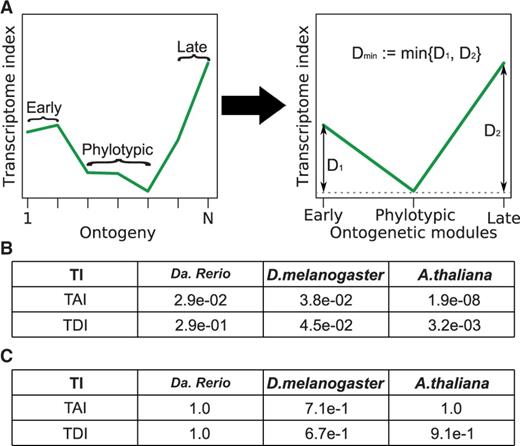
Evaluation of transcriptome index profiles by the reductive hourglass test. (A) Schematic representation of module assignment and derivation of the test statistic. (B) P-values derived by application of the reductive hourglass test to the TAI and TDI profiles in all three species. (C) P-values derived by application of the reductive early conservation test to the TAI and TDI profiles in all three species.
Applying the reductive hourglass test to the TAI and TDI profiles of the three species reveals significant P-values for both patterns of D. melanogaster and A. thaliana (fig. 5B). For Da. rerio, only the TAI hourglass pattern is significant. For the TDI, the evolutionary signal in late embryogenesis seems to be diluted by the comparatively large evolutionary distance between Da. rerio and the other fish species (>150 My), and the increase of transcriptome divergence in Da. rerio development seems to be shifted from late embryogenesis to hatching and postembryonic development (supplementary fig. S9, Supplementary Material online).
Together, with exception of the Da. rerio TDI profile we find that both TAI and TDI values in early and late periods of embryogenesis are significantly higher than in the phylotypic periods in both animals and plants, demonstrating that phylotypic transcriptomes are evolutionarily ancient and highly conserved across kingdoms.
We finally adapt the reductive hourglass test to the early conservation model (see Materials and Methods), call it reductive early conservation test, and apply it to the TAI and TDI profiles of all three species. We find that a low-high-high pattern is rejected in all six cases (fig. 5C), stating that the described TAI and TDI profiles from three model species from two different kingdoms are inconsistent with the early conservation model, but largely consistent with the hourglass model.
Discussion
The controversy about the developmental hourglass model and especially about the hourglass versus early conservation models is as vibrant as it ever was. These and other models have traditionally relied on subjective anatomical comparisons, and a lack of measurable quantitative approaches has fed controversial discussions over decades (Hall 1997; Richardson et al. 1997; Richardson 1999; Bininda-Emonds et al. 2003; Roux and Robinson-Rechavi 2008; Comte et al. 2010). However, technological progress recently facilitated quantitative measurements of expression profiles. Although some of these recent studies favored the early conservation model (Roux and Robinson-Rechavi 2008; Comte et al. 2010), the majority of them supported the developmental hourglass model. Initially, a number of studies demonstrated hourglass-like patterns for limited sets of genes and a variety of genetic parameters (Davis et al. 2005; Hazkani-Covo et al. 2005; Demuth et al. 2006; Irie and Sehara-Fujisawa 2007; Cruickshank and Wade 2008). Later, several studies demonstrated that whole transcriptomes of fly, worm, several vertebrates, and cress followed an hourglass pattern (Domazet-Lošo and Tautz 2010; Kalinka et al. 2010; Irie and Kuratani 2011; Levin et al. 2012; Quint et al. 2012; Wang et al. 2013). For Drosophila ssp. it was recently shown that even the conservation of miRNA expression displays an hourglass pattern similar to that observed for protein-coding genes (Ninova et al. 2014).
The later phylotranscriptomic studies have been performed by distance-based transcriptome comparisons (Kalinka et al. 2010; Irie and Kuratani 2011; Levin et al. 2012; Wang et al. 2013) or by studies of transcriptome indices (Domazet-Lošo and Tautz 2010; Quint et al. 2012); the latter combining evolutionary and transcriptomic information. As of now, there are two flavors of transcriptome indices. The TAI applies the phylogenetic age of a gene as an evolutionary measure (Domazet-Lošo and Tautz 2010) and thereby practically covers the complete evolutionary depth of the tree of life. The TDI, on the other hand, is based on sequence divergence of orthologous genes (Quint et al. 2012) and thereby captures exclusively recent evolutionary signals.
In our study, we systematically analyzed embryonic transcriptomes of two animal and one plant species. The resulting phylotranscriptomic patterns could have followed no profile at all or a variety of different profiles. Because the evaluation of phylotranscriptomic patterns in past studies (including our own) were subjective or relied on statistical tests with different limitations, we developed two more adequate statistical tests, the reductive hourglass test and the reductive early conservation test. These tests allow to objectively assess phylotranscriptomic profiles for the significance of a high–low–high pattern or a low-high-high pattern, respectively. In both cases, a prerequisite is a meaningful division of the set of developmental stages into three modules based on a priori biological knowledge.
Across the three species investigated, TAI analyses showed that early and late embryonic transcriptomes were consistently young (high TAI) and that the oldest transcriptomes were always observed during the presumptive mid-embryonic phylotypic period of each species (low TAI), which represents one of the hallmarks of the developmental hourglass model. For all three species we found that the reductive hourglass test and the reductive early conservation test supported the hourglass model and rejected the early conservation model, providing objective support for the developmental hourglass model.
Confidence in the validity of the developmental hourglass model allowed us posing the central question of this work of whether or not the phylotranscriptomic hourglass pattern might still be associated with a biological function in extant species. If so, the phylotranscriptomic hourglass pattern might either be causal for a downstream biological function or be the result of such a function. Alternatively, the phylotranscriptomic hourglass pattern might simply represent an evolutionary relic of a once important process that continues to exist in a rudimental status.
Only if this pattern were actively maintained, it would be possible to transform the currently predominantly descriptive approaches to a functional, that is, experimental, level. Hence, answering this question is important for understanding the still enigmatic function of the hourglass pattern in the long term and for deciding if it is in principle possible to uncover the molecular function of the phylotranscriptomic hourglass pattern by performing experiments on extant species.
Neither distance-based approaches nor studies of transcriptome indices can address the evolutionary time of emergence of the hourglass pattern in a satisfactory manner. Likewise, its active maintenance in extant species cannot be addressed by distance-based transcriptome comparisons or studies of TAI profiles. However, studies of TDI profiles that consult evolutionary signals from only recent evolution are arguably best suited for investigating the “active maintenance issue.”
To date, TDI profiles of animal species had not yet been reported. As the closest related fish species with a completely sequenced genome diverged from Da. rerio greater than 150 Ma, this relatively long time span does certainly not qualify to make assumptions on very recent evolutionary trends. Hence, interpretation of these results is less meaningful than those of D. melanogaster and A. thaliana, whose closest relatives diverged only approximately 3 and 5–10 Ma, respectively. Here, statistical evaluations show a significant hourglass-like pattern with the minimum during the presumptive phylotypic period, consistent with the developmental hourglass model. This result is supportive of Kalinka et al. (2010), who suggested that the conservation of genes between closely related species that are active during mid-development is the result of natural selection acting to maintain expression levels and their temporal relationships to enable the correct establishment of the body plan. The results provided by Kalinka et al. (2010) and the results from TDI computations reported here propose a scenario in which, across kingdoms, the phylotranscriptomic hourglass pattern is actively maintained through stabilizing selection.
Interestingly, while vertebrate and invertebrate embryogenesis also follows an hourglass pattern on the morphological level, morphological hourglass patterns are apparently absent from plant embryogenesis; at least they have never been reported. In contrast, comparative embryology in flowering plants, for example, suggests that the complete process of embryogenesis is morphologically highly conserved (Kaplan and Cooke 1997). Mature plant embryos are anatomically much less complex than mature animal embryos. In a simplified manner, animals (such as mammals and many other vertebrates) initiate genesis of the vast majority of organs largely simultaneously in the phylotypic period during embryogenesis. In contrast, during embryogenesis many plant species including A. thaliana establish only a limited set of major organs, consisting of hypocotyl, petioles, cotyledons, the embryonic root, and two stem cell niches (meristems). All other organs are initiated in these two apical meristems or in secondary meristems and are formed only during postembryonic development, where also morphological differences between species are being established. Possibly, plant embryogenesis is not complex enough to generate morphological differences between species, without which a morphological hourglass pattern is obsolete. Alternatively, any trace of a previously existing morphological pattern might have been wiped out and is undetectable by comparing extant species.
Although the TAI profile of A. thaliana suggests that the phylotranscriptomic hourglass did not emerge recently, its TDI profile suggests that some functional property of the phylotranscriptomic hourglass is actively maintained in extant plant species. In view of the lack of a morphological hourglass pattern in plants, one could conjecture that although the phylotranscriptomic hourglass pattern might be actively maintained in extant species across kingdoms, phylotranscriptomic and morphological hourglass patterns do not necessitate each other. They might even be uncoupled, which in turn would cast doubt on a possible causal relationship between them.
Conclusions
The existence of hourglass patterns in TAI profiles of animal and plant embryogenesis demonstrates that this pattern is not a recent innovation. Darwin (1859) said “it would be impossible to name one of the higher animals in which some part or other is not in a rudimentary condition.” Although we admit that it might not be entirely accurate to directly compare a molecular pattern such as the phylotranscriptomic hourglass with morphological structures, the phylotranscriptomic hourglass pattern might in fact become a molecular addition to the long list of vestigial characters such as the leg bones of whales or the wings of ostriches and other flightless birds, for example. However, the existence of hourglass patterns in TDI profiles of animal and plant embryogenesis suggests that this pattern is actively maintained in extant species. As evident for most evolutionary questions, experimental studies of processes that were functional in extinct species but have become nonfunctional in the course of evolution are incomparably more difficult to study than processes still functional in extant organisms. Provided that active maintenance of the phylotranscriptomic hourglass pattern would make little sense without it being functional, we hypothesize that this pattern is still functional in extant species and does not represent a nonfunctional relic. Despite this weak evidence for functionality of the phylotranscriptomic hourglass pattern, these data suggest that it might be possible to identify the molecular function(s) of this pattern in the long term. In any case, much remains to be learned, and we believe that a systematic comparative approach between plants and animals has the potential to significantly advance our understanding of the developmental hourglass phenomenon.
Materials and Methods
Scripts for complete reproduction of all data presented in this manuscript including database generation, construction of phylostratigraphic and sequence divergence maps, computation of TAI and TDI patterns, essential gene analysis, and statistical tests are available via the GitHub repository (https://github.com/HajkD/Active-maintenance-of-phylotranscriptomic-hourglasses, last accessed August 2, 2015). Detailed instructions for applications of the same analyses to any expression data set and any species with sufficient genome information can be found in the R packages myTAI (Drost 2014) and orthologr (https://github.com/HajkD/orthologr, last accessed August 2, 2015).
Construction of Phylostratigraphic Maps
Procedures for constructing phylostratigraphic maps have been presented previously (Domazet-Lošo et al. 2007; Domazet-Lošo and Tautz 2010; Quint et al. 2012). Here, we construct phylostratigraphic maps of Da. rerio, D. melanogaster, and A. thaliana based on the same data set and the following procedure. First, we define a set of PS for each of the three species according to the NCBI taxonomy database. Second, we extract all 17,582,624 amino acid sequences of all 4,557 species from the NCBI, ENSEMBL (Flicek et al. 2014), Flybase (St. Pierre et al. 2014), and Phytozome (Goodstein et al. 2012) databases. Third, we generate a target database from these sequences (http://msbi.ipb-halle.de/download/phyloBlastDB_Drost_Gabel_Grosse_Quint.fa.tbz, last accessed August 2, 2015) and BLAST each amino acid sequence of A. thaliana (TAIR10; 35,386), Da. rerio (ENSEMBL release 54; 24,147) and D. melanogaster (Flybase release 5.53; 29,357) with a minimum length of 30 amino acids against this target database using BLASTp (BLAST version 2.2.21). Fourth, we assign each gene to its PS by the following rule. If no BLAST hit with an E-value below 10−5 was identified, we assign the gene to the youngest PS. Otherwise, we assign it to the oldest PS containing at least one species with at least one blast hit with an E-value below 10−5. PS for the genomes of all three species are given in supplementary table S2, Supplementary Material online.
Construction of Sequence Divergence Maps
We construct sequence divergence maps of Da. rerio, D. melanogaster, and A. thaliana by the following procedure. First, we identify orthologous gene pairs of Da. rerio and As. mexicanus (NCBI annotation release 77; 23.698), D. melanogaster and D. simulans (Flybase Release 1.4; 15,415), and A. thaliana and A. lyrata (Phytozome v.9.0; 32,670) by choosing the best reciprocal hit using BLASTp (BLAST version 2.2.29). If the best reciprocal hit has an E-value below 10−5 , the gene pair is considered orthologous; otherwise, it is discarded. Second, we construct codon alignments of the orthologous gene pairs using PAL2NAL (Suyama et al. 2006). Third, we compute Ka/Ks values of the codon alignments using GESTIMATOR (Thornton 2003) and Comeron’s substitution model, which combines Li’s, Pamillo’s, and Bianchi's method with Kimura’s method for obtaining robust Ka/Ks estimates (Comeron 1995). Fourth, we discard all genes with a Ka/Ks value greater than 2 and sort the remaining Ka/Ks values into discrete deciles, which we call DS. DS values for the genomes of all three species are provided in supplementary table S4, Supplementary Material online. The same procedure is applied to generate sequence divergence maps for all other pairwise species comparisons (supplementary table S4, Supplementary Material online). The construction of sequence divergence maps is explained in detail in the advanced vignette of the myTAI R package (Drost 2014). It can be applied to any chosen species pair with available coding sequence genomes and can be computed using the orthologr package (https://github.com/HajkD/orthologr, last accessed August 2, 2015).
Processing of Expression Data
For Da. rerio we use the microarray expression data set by Domazet-Lošo and Tautz (2010) covering 40 stages corresponding to embryo development. The 16,188 probes of this data set correspond to 12,892 genes according to ENSEMBL predictions (Domazet-Lošo and Tautz 2010), and we compute the expression level of each gene as arithmetic mean of the expression levels of the corresponding probes (Piasecka et al. 2013). Intersecting these 12,892 genes with genes in the phylostratigraphic map and the sequence divergence map of Da. rerio and As. mexicanus yields 12,892 genes and 7,740 genes, respectively. Intersecting sequence divergence maps of Da. rerio and T. rubripes, Da. rerio and X. maculatus, and Da. rerio and G. morhua yields 6,807, 6,997, and 4,734 genes, respectively. For D. melanogaster we use the RNA-seq expression data set by Graveley et al. (2011) covering 12 stages corresponding to embryo development. Intersecting the 15,139 genes of this data set with genes in the phylostratigraphic and the sequence divergence maps of D. melanogaster and D. simulans yields 12,043 genes and 6,230 genes, respectively. Intersecting sequence divergence maps of D. melanogaster and D. yakuba, D. melanogaster and D. persimilis, and D. melanogaster and D. virilis yielded 6,961, 5,872, and 5,732 genes, respectively. For A. thaliana we use the microarray expression data set by Xiang et al. (2011) covering seven stages of embryo development. Intersecting the 26,173 genes of this data set with genes in the phylostratigraphic and sequence divergence maps of A. thaliana and A. lyrata yields 25,260 genes and 18,240 genes, respectively. Intersecting sequence divergence maps of A. thaliana and C. rubella, A. thaliana and B. rapa, and A. thaliana and Car. papaya yields 17,765, 16,122, and 9,427 genes, respectively. Expression values used for TAI and TDI computations are provided in supplementary tables S3 and Supplementary Data, Supplementary Material online. The introductory vignette of the myTAI R package describes how to define and process expression data sets (Drost 2014).
Transcriptome Age Index
Transcriptome Divergence Index
Essential Genes Expression Level Analysis
Essential genes are defined as genes that are required for normal growth and development which are associated with a loss-of-function phenotype in a standard genetic background (Meinke et al. 2008). For our analysis, we focus on genes causing embryo-defective phenotypes in A. thaliana. We took unique essential genes from www.seedgenes.org (Meinke et al. 2008) and only selected genes that were classified as embryo-defective. This procedure yielded 401 unique embryo-defective genes that were used to generate supplementary figure S8, Supplementary Material online. Mean expression levels were plotted for each stage (supplementary fig. S8A, Supplementary Material online) and a Dunn’s test of multiple comparisons (Dunn 1964) using Benjamini–Hochberg adjustment (Benjamini and Hochberg 1995) was performed to statistically quantify differences in essential gene expression for pairwise stage comparisons (supplementary fig. S8B, Supplementary Material online). Statistical significance of differences in essential gene expression across all stages was assessed by performing a Kruskal–Wallis rank sum test. Gene IDs, expression values and scripts are included in the accompanying GitHub repository.
Flat Line Test
The flat line test (Quint et al. 2012) is a permutation test based on the variance V of the TAI values of a given TAI profile as test statistic. For any pattern different from a flat horizontal line, V should be high. In order to determine the statistical significance of an observed variance V, we perform the following permutation test. We randomly permute the PS values of the original data set 10,000 times, compute the variance V from each of the 10,000 permuted data set s, approximate the histogram of the 10,000 variances V by a Gamma distribution, and report the probability of exceeding the observed variance V as P-value of the flat line test.
The flat line test can be applied to TDI profiles in exactly the same manner.
Reductive Hourglass Test
The reductive hourglass test is a permutation test based on the following test statistic. First, we partition the set of developmental stages into three modules—early, mid, and late—based on prior biological knowledge. Second, we compute the mean TAI value for each of the three modules, and we denote these mean TAI values by Tearly, Tmid, and Tlate. Third, we compute the two differences D1 = Tearly–Tmid and D2 = Tlate–Tmid. Fourth, we compute the minimum Dmin of D1 and D2 as final test statistic of the reductive hourglass test.
For a typical hourglass pattern, Tearly should be high, Tmid should be low, and Tlate should be high, so both differences D1 and D2 should be positive, so the minimum difference Dmin should be positive, too.
In order to determine the statistical significance of an observed minimum difference Dmin, we perform the following permutation test. We randomly permute the PS values of the original data set 10,000 times, compute the minimum difference Dmin from each of the 10,000 permuted data sets, approximate the histogram of the 10,000 minimum differences Dmin by a Gaussian distribution, and report the probability of exceeding the observed minimum difference Dmin as P-value of the reductive hourglass test (fig. 5A). Supplementary figure S10, Supplementary Material online, visualizes an example test statistic, the corresponding Gaussian distribution fitting the histogram of the 10,000 minimum differences Dmin, and the hourglass score of the observed phylotranscriptomic pattern.
The reductive hourglass test can be applied to TDI profiles in exactly the same manner.
Reductive Early Conservation Test
The reductive early conservation test is a permutation test conceptually identical to the reductive hourglass test. Specifically, steps one, two, and four are identical, and in step three we compute the two differences D1 = Tmid–Tearly and D2 = Tlate–Tearly. For a typical early conservation pattern, Tearly should be low, and Tmid and Tlate should be high, so both differences D1 and D2 should be positive, so the minimum difference Dmin should be positive, too. In order to determine the statistical significance of an observed minimum difference Dmin, we perform the same permutation test as in the reductive hourglass test, yielding the probability of exceeding the observed minimum difference Dmin as P-value of the reductive early conservation test.
Instructions on the application of the flat line test, the reductive hourglass test, and the early conservation test are described in the introductory vignette of the myTAI R package (Drost 2014). The entire process of building the test statistics for the three tests can be found in its intermediate vignette.
Acknowledgments
The authors thank Sarah Scharfenberg and Kristian Ullrich for valuable discussions and their contributions to the Ka/Ks pipeline, and Julia Bellstädt for graphical support. Furthermore, the authors are grateful to NCBI, ENSEMBL, flybase and Phytozome for providing extensive genome information. This work was supported by the Leibniz Association, the Deutsche Forschungsgemeinschaft (Qu 141/5-1 to M.Q. and Gr 3526/6-1 to I.G.) and the SKW Piesteritz research prize awarded to H.-G.D. and A.G.
References
Author notes
Associate editor: John True
