


Abstract
Functional genomics technologies have been widely adopted in the biological research of both model and non-model species. An efficient functional annotation of DNA or protein sequences is a major requirement for the successful application of these approaches as functional information on gene products is often the key to the interpretation of experimental results. Therefore, there is an increasing need for bioinformatics resources which are able to cope with large amount of sequence data, produce valuable annotation results and are easily accessible to laboratories where functional genomics projects are being undertaken. We present the Blast2GO suite as an integrated and biologist-oriented solution for the high-throughput and automatic functional annotation of DNA or protein sequences based on the Gene Ontology vocabulary. The most outstanding Blast2GO features are: (i) the combination of various annotation strategies and tools controlling type and intensity of annotation, (ii) the numerous graphical features such as the interactive GO-graph visualization for gene-set function profiling or descriptive charts, (iii) the general sequence management features and (iv) high-throughput capabilities. We used the Blast2GO framework to carry out a detailed analysis of annotation behaviour through homology transfer and its impact in functional genomics research. Our aim is to offer biologists useful information to take into account when addressing the task of functionally characterizing their sequence data.
INTRODUCTION
Functional genomics has emerged as a major field in applied bioinformatics. Microarray experiments, protein interaction network studies, genome meta-analysis or single nucleotide polymorphism (SNP) observations are promising approaches to gain new insights into molecular biology. Functional interpretation is a key step in the analysis of this data which cannot be done without the availability of extensive functional annotation of the datasets. Due to the fast development of high-throughput sequencing technologies and the number of “low-cost” expressed sequence tag (EST) sequencing projects worldwide, an increasing amount of novel, uncharacterized sequence data have arisen and created a requirement for fast and reliable functional annotation that would facilitate the biological interpretation of involved experiments. This makes standardized functional annotation essential. The most widespread and probably most extensive functional annotation schema for gene and protein sequences is the Gene Ontology (GO) ( 1 ) which has become the de facto standard in nearly all public databases. The accurate assignment of functional information to gene products is a complex, laborious and time-consuming task often performed manually by trained “bio-curators”. Manual curation guarantees a high level of annotation correctness ( 2 ). However, the speed of sequence data generation greatly exceeds the possibilities of manual functional assignment and recent work has demonstrated that the current labour-intensive curation taskforce alone will not be sufficient to complete the annotation of genomic databases ( 3 ). Therefore, genomic high-throughput technologies require automatic functional annotation alternatives to achieve a reasonable degree of biological interpretability.
Automatic functional annotation methods basically rely on sequence, structure, phylogenetic or co-expression relationships between known and novel sequences ( 4 ). Function transfer based on sequence similarity is the most extended approach as it is probably the methodology that best suits the desired high-throughput and high-coverage needs of functional sequence annotation at a genomic scale. However, function transfer from homologous sequences is comparatively highly error prone ( 2 , 5 ) and bioinformatics tools in this area should ideally optimize the difficult task of function mining and provide a useful balance between quality and quantity of the transferred knowledge. There are around a dozen of freely available tools for the de novo annotation of sequence data ( 6–21 ). A detailed survey on their characteristics is available as Supplementary Data ( http://blast2go.bioinfo.cipf.es/supplementary.html ). Most tools provide Gene Ontology annotation of sequences data through homology searches. Some resources include additional vocabularies (KEGG, InterPro, COG) or annotation algorithms ( 8–11 , 16 , 20 ) and in some cases, DAG (directed acyclic graph) visualization is provided ( 8 , 16 ). In general, these tools can be regarded as generators of annotations with a more or less elaborated strategy, but have limitations when used in large sequencing projects: most applications lack high-throughput capabilities and additional functionalities to assist the process of function assignment are commonly absent. Blast2GO is a bioinformatics tool for the automatic functional annotation of DNA or protein sequence data mainly based on the GO vocabulary. Blast2GO v.1 was released in September 2005 as a biologist-oriented, high-throughput, quality data-mining tool and has been involved during the last 2 years in a wide variety of functional annotation projects mainly regarding, but not only, non-model species. Apart from the automatic GO annotation of EST collections ( 22–24 ) and the functional interpretation of Microarray studies ( 25–28 ) Blast2GO has been applied to genome comparison studies ( 29 , 30 ) and general bioinformatics methodology descriptions ( 23 , 24 , 31 ) over a wide range of biological taxons ( Streptococcus suis, Citrus clementina, Zea mays, Sus scrofa, Glycine max, Trichoderma harzianum, Platichthys flesus, Schistosoma mansoni, Ancylostoma caninum, Dictyocaulus viviparus, Rattus norviegus, Apis mellifera, Gasterosteus aculeatus , etc.). During 2 years of use of Blast2GO, many questions and application requests arrived from users. These included requirements for additional powerful and user-friendly annotation and visualization functionalities, concerns on the accuracy of automatic annotation through sequence similarity and its impact on functional analysis as well as the effect of Blast2GO parameters on annotation results. In this paper, we present the Blast2GO v.2 software as a comprehensive suite for the high-throughput functional annotation and data mining of novel sequences. We describe new application functionalities, provide a deeper understanding on modulation of annotation and give practical insights on the potentials and risks of automatic annotation used as discovery tool in the functional genomics study of poorly characterized sequence data. The main goal of this work is to provide biologists with a suitable tool and sound know-how that they can take into account during the functional annotation of their sequence data.
APPLICATION FEATURES
Blast2GO v.1 highlights
Blast2GO first published as an application note, presented the basic concepts of the Blast2GO methodology plus some application features and performance. Briefly, Blast2GO integrates in one tool GO annotation and data mining on annotation results. GO annotation proceeds through BLAST ( 32 ) searches against public or private sequence databases, mapping of homologue sequences to GO terms and final GO term assignment applying the Blast2GO annotation rule. The Blast2GO annotation algorithm already took multiple parameters into account such as sequence similarity, BLAST HSP (highest scoring pair) length and e-values, the GO hierarchical structure and GO term evidence codes. Annotation mining tools included statistics, visualization for the generated GO sequence annotation as well as Fisher's Exact Test for enrichment analysis between two groups of annotated sequences. Blast2GO annotation rule parameters evaluated on an Arabidopsis thaliana annotated dataset provided optimal same-branch annotation coverage of 73% at a recall of 61% with default parameters. The user front-end was conceived for easy installation and user-friendliness.
New features in Blast2GO v.2
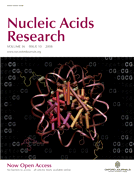
In the first version of Blast2GO (v.1) basic functionalities for sequence annotation and data mining were provided. With the developments in version 2 we have moved towards an extensive framework for an improved functional annotation and its further interpretation. New functionalities for obtaining and curating functional terminology, visualizing and synthesizing information and an optimized usability has been added in the version 2. The Blast2GO application design follows a service-oriented architecture which permits the incorporation of new features such as web services by integrating external resources when available. Our strategy therefore has been to integrate existing resources when possible and only to develop those for which a suitable solution could not be found ( Figure 1 ). New Blast2GO features are described in the following paragraphs.
Schematic representation of the Blast2GO application. GO annotations are generated through a three-step process: BLAST, mapping, annotation. InterPro terms are obtained from InterProScan at EBI, converted and merged to GOs. GO annotation can be modulated from Annex, GOSlim web services and manual editing. Enzyme Code and KEGG Pathway map annotations are retrieved through mappings from GO. Visual tools include sequence colour code, KEGG pathways and GO graphs with GO term highlighting and filtering options. Additional annotation data-mining tools include statistical charts and gene set enrichment analysis functions.
Tools controlling type and intensity of annotation
Hit coverage filter
At the annotation step, the user has the possibility to specify a minimum coverage between the hit and query sequence and to pre-select in this way only those hits for annotation which covers by the given percentage of overlap (%hit) the corresponding query sequence. This feature is valuable especially when trying to avoid possible cis annotations from modular proteins. This aspect will be illustrated in section 4.
BLAST description annotation
The primary goal of Blast2GO is to assign GO terms to nucleotide or protein sequences. However, a useful description (or name) for the novel sequences is normally also desired. To this end, a natural language text mining functionality has been included in Blast2GO v.2 which runs on the obtained set of sequence descriptions for the hits of a given query. Through this parsing approach, sequence descriptions such as ‘hypothetical protein’ or ‘expressed protein’ are avoided when a more informative name is available.
GO-slim
A GO slim is the definition of a mapping within the gene ontology, which permits the projection of certain specific terms into more generic ones. GO slims summarize a set of GO annotations from e.g. a whole-genome Microarray analysis to a simpler functional schema. The GO slim concept allows the definitions of different types of term mappings according to special needs since e.g. a set of mice annotations might be summarized in a different way than for example a plant genome. For this reason the CPAN go-Perl function map2slim ( http://search.cpan.org/~cmungall/go-perl-0.07/scripts/map2slim ) was integrated into Blast2GO and allows the ‘slimming’ of annotations based on various mapping files. At present GOSlim mappings for plants, a generic one as well the GOA (Gene Ontology Annotation)( 33 )-specific one is available.
Annex
Annex is essentially a set of relationships between the three GO categories ( 34 ). Annex consists of over 6000 manually reviewed relations between molecular function terms ‘involved in’ biological processes and molecular function terms ‘acting in’ cellular components. Annex-based GO term augmentation can be run in any annotation file uploaded in Bast2GO. Generally, between 10 and 15% extra annotation is achieved and around 30% of GO term confirmations are obtained through the Annex dataset (see Results section for details).
Enzyme code annotations and KEGG pathway visualization
Blast2GO v.2 includes a GO to Enzyme Code and KEGG ( 35 ) pathway mapping engine, plus a KEGG pathway visualization module. These features allow users to quickly obtain enzyme codes for their datasets and to identify and visualize the pathways. Enzyme codes are coloured in the pathways obtained via the web by the KEGG-API and are ordered considering their significance within the data.
InterProScan (IPS)
In order to complete the functional annotation based on BLAST with protein domain information, InterPro search functionality has been added to Blast2GO. Users, identified by their e-mail address, have the possibility of starting a controlled batch search of unlimited number of sequences making use of the InterProScan web service kindly provided by the EBI ( 31 ). Blast2GO sends, recovers, parses and visualizes the results returned by the server. Once protein domain information is obtained, the corresponding GO terms can be transferred to the query sequences and merged with existing annotation.
Manual curation tool
Blast2GO supports manual curation which means that the user may manually adjust GO term notations and sequence descriptions. Manual curation is supported by the available information on BLAST or InterPro results, which are linked out to their corresponding databases entries or web sites. A dialog box gives access to edit data and to label a sequence as manual curated. After modifications are made, the modified set of annotations is checked automatically for coherency (see below).
Annotation coherency
This function prevents two or more GO annotations sharing the same GO branch from being assigned to one sequence. The ‘true path rule’ defined by the Gene Ontology Consortium assures that all the terms lying on the pathway from a term up to the root must always be true for a given gene product. Therefore, any term is considered as redundant and removed if a child term coexists for the same sequence. In Blast2GO this method is always applied after a modification has been made to an existing annotation, such as merging GO terms from InterProScan search, after Annex augmentation or upon manual curation and can also be run independently.
Descriptive charts and sequence management features
Manage sequences
Blast2GO offers several functions to manage the sequence collections in a user-friendly way. Sequence sets may be selected manually, per file definition or based on the analysis status represented by colour codes. This property is especially useful when re-annotation or graphical display is desired only for a subset of sequences.
Annotation comparison tool
Blast2GO executes automatic comparison between groups of GO terms. This comparison counts the number of identical, more general, more specific and ‘other branch’ terms between two sets of annotations. An annotation similarity between the GO annotated sequences can be calculated in this way taking into consideration the characteristics of the hierarchical GO DAG structure.
Data statistics
Several statistics and pie charts have been added to the application to provide direct feedback about data composition. Charts such as mean sequence length, involved species distribution, BLAST e-value distribution or the standard deviation of GO level annotation distribution, allow the visualisation of intermediate and final result summaries.
Graphical features
Graph performance
Interactive graph visualization was added to Blast2GO to improve navigation of large and unwieldy graphs generated by the Combined Graph feature. This function generates joined GO DAGs to create overviews of the functional context of groups of sequences ( 8 ). Zoom and graph navigation is provided, thanks to a scalable vector graphic viewer based on ZVTM (Zoomable Visual Transformation Machine) ( 36 ).
Graph colouring and information content
Combined Graph terms are highlighted through a colour scale proportional to their annotation weight. A term annotation weight can be computed as the number of sequences annotated to that term or as an annotation confluence score. This confluence score (Blast2GO score) takes into account the number of sequences converging at one GO term and penalizes by the distance to the term where each sequence actually was annotated ( 8 ). Assigned sequences and Blast2GO scores can be also displayed at the terms level. Additionally, the visualization of Enriched Graphs (graphs showing only statistically enriched terms) has been enhanced by separating under- and over-represented terms in two different colours.
Graph term filtering
One of the core functions of Blast2GO is the ability to display the annotation result for a set of sequences on the Gene Ontology DAG. However, when the number of sequences is high, GO graphs can become extremely large and difficult to navigate. Additionally, the relevant information in these cases is frequently concentrated in a relatively small subset of terms. We have introduced graph-pruning functions to simplify DAG structures to display only the most relevant information. In the case of the Combined Graph function, a cut-off on the number of sequences or the score value can be set to filter out GO terms. Similarly, Enriched Graphs can be simplified to show only those terms considered significant by the Fisher's Exact Test. In both cases, the number of omitted GO terms is given for each branch, which is an indication of the level of local compression applied.
Multilevel pie
Blast2GO offers pie charts as summary representations of annotation results. The traditional single GO level pie has now been improved by the addition of a multi-level pie function. In this representation only the lowest GO terms per branch that fulfil a user-specified annotation weight criteria, i.e. sequence abundance or Blast2GO score are shown. In this way, the GO DAG can be ‘cut’ locally at different levels to provide an optimal view of the dataset's most relevant terms ( 37 ).
New high-throughput utilities
Pipeline version
One of the most extensive uses of Blast2GO is in the functional characterization of EST sequences. EST projects can be found for a very wide variety of organisms and numerous EST pipelines have been developed to address complete assembly and processing of EST collections ( 24 ). Consequently, an important feature for any annotation method would be to offer a programmable interface for further software integration. Blast2GO provides the Blast2GO4Pipe version (available from http://www.blast2go.org ) which permits easy integration to more extensive bioinformatics applications.
High-throughput BLAST
The major time-consuming step of the Blast2GO annotation process is in the initial BLAST search. We improved performance at this step through Grid technology, i.e. distributed online computing on multiple and independent CPU clusters. Blast2GO v.2 includes a module to launch BLAST searches against a grid environment that distributes both the amount of input sequences and the large sequence databases over the elements of a network of computers prepared to perform BLAST searches ( 6 ). With available resources, BLAST results of 20 000 sequences can be obtained within 24 h and retrieved asynchronously due to high-level grid session management. To access the grid functionality a personal account has to be requested. A detailed description of the Blast2GO-grid performance will be reported elsewhere.
MATERIALS AND METHODS
Thirty-two different annotation styles were defined by varying the values given to different Blast2GO annotation parameters. These settings were applied to seven different datasets and annotation results were evaluated by several metrics. Assigned terms for 300 sequences out of three distinct organisms were manually revised for a closer understanding of differences in annotation results. Annotation styles for three datasets were further analysed with the gene set enrichment analysis functionality using available experimental data. An additional assessment was included to gain insights in the phenomenon of cis annotation.
The annotation process
Before describing the different annotation styles, a more detailed explanation of the Blast2GO annotation procedure is required. GO annotation proceeds in Blast2GO through three basic steps: homologues search, GO term mapping and actual annotation. At the first step, typically NCBI-BLAST, the e-value cut-off (e-value), the number of retrieved BLAST hits and the minimum length value for the matching HSP are configurable parameters. Blast2GO then maps the BLAST hits to their corresponding GO annotations using the gene ontology database and several additional data files ( Table 1 ) Annotation is subsequently done by applying the annotation rule to all the GO terms (also parent terms) retrieved after the previous two steps. This rule seeks to find the most specific annotations with a certain level of reliability ( 8 ).
Data resources used by B2G to generate novel annotations
| Resources | Date | File | From | Entries |
|---|---|---|---|---|
| Gene Ontology DB | Jan.2008 | go_200801-assocdb-data | Gene Ontology ( http://www.geneontology.org ) | 3.484.490 (gene_products) |
| gene_info | 08.01.08 | gene_info.gz | NCBI Gene related data ( ftp://ftp.ncbi.nlm.nih.gov/gene/data/ ) | 3.352.373 |
| gene2accession | 08.01.08 | gene2accession.gz | NCBI Gene related data ( ftp://ftp.ncbi.nlm.nih.gov/gene/data/ ) | 10.405.867 |
| Non-redundant | ∼Aug 2007 | nr.tar.gz | NCBI ( http://www.ncbi.nlm.nih.gov/ftp/ ) | – |
| PIR mapping file | 01.26.06 | NREF2ids.dat | Protein Information Resource ( ftp://ftp.pir.georgetown.edu/pir_databases/nref/ ) | 8.002.357 |
| Annex | 2006 | annex.txt | Norwegian University of Science and Technology ( http://www.ntnu.no ) Annex project: ( http://www.goat.no ) | 6721 |
| EC2GO | Nov. 1008 | ec2go.txt | Gene Ontology ( http://www.geneontology.org ) | 3665 |
| Blast | v. 2.2.14 | – | NCBI ( http://www.ncbi.nlm.nih.gov/ftp/ ) | – |
| InterProScan | ∼Aug 2007 | – | EBI ( http://www.ebi.ac.uk/InterProScan/ ) | – |

Default weights given by Blast2GO to the evidence codes used by the Gene Ontology database
| EC | Description | Default |
|---|---|---|
| IDA | Inferred from direct assay | 1 |
| IMP | Inferred from mutant phenotype | 1 |
| IGI | Inferred from genetic interaction | 1 |
| IPI | Inferred from physical interaction | 1 |
| IEP | Inferred from expression pattern | 1 |
| TAS | Traceable author statement | 0.9 |
| NAS | Non-traceable author statement | 0.9 |
| IC | Inferred by curator | 0.9 |
| ISS | Inferred from sequence or structural similarity | 0.9 |
| RCA | Inferred from reviewed computational analysis | 0.9 |
| IEA | Inferred from electronic annotation | 0.7 |
| ND | No biological data available | 0.5 |
| NR | Not recorded | 0.5 |
Annotation styles
A number of annotation styles were defined to evaluate the impact of the similarity transfer and Blast2GO-specific annotation parameters on annotation results. The considered parameters were the degree of homology through the BLAST e-value cut-off (e-value), the sequence similarity-based annotation score (threshold) including the quality of transferred annotations through evidence code weights (ECw) and the intensity of abstraction to parent terms through a GO weight (GOw). Additionally the BLAST versus domain-based (InterPro) transfer and the automatic augmentation through the Annex strategy (Annex) was also included. Defined annotation styles were chosen over systematically varying annotation parameters, first to reduce the number of tested configurations and second to better resemble possible annotation policies. A total of 32 configurations were defined which ranged from very strict (only manual curated GO annotations with high BLAST e-value and annotation score cut-offs) to highly permissive (basically all the GO terms mapped to BLAST hits plus InterPro and Annex augmentations were transferred) ( Table 2 ).
Basic annotation styles
| Type | e -value | Threshold | GOw | ECw |
|---|---|---|---|---|
| InterPro | – | – | – | – |
| Strict | 10 | 75 | 0 | IEA, ND, NR to 0 |
| Manual (default) | 6 | 55 | 5 | IEA, ND, NR to 0 |
| Manual (all) | 6 | 1 | 0 | IEA, ND, NR to 0 |
| Default (GOw:0) | 6 | 55 | 0 | gradual |
| Default (GOw:5) | 6 | 55 | 5 | gradual |
| Default (GOw:10) | 6 | 55 | 10 | gradual |
| Default (GOw:15) | 6 | 55 | 15 | gradual |
| Automatic | 3 | 75 | 5 | all to 1 |
| Generous | 3 | 55 | 10 | all to 1 |
| All mapping | 0 | 0 | 0 | all to 1 |
The total 32 annotation styles consist of these configurations plus derived styles obtained after adding InterPro or Annex augmentations.
Datasets
Eight different datasets were used throughout this study, summing up a total of 66 773 sequences [ Meloidogine incognita (min), T. harzianum (tha), G. max (gma), P. flesus (pfl), C. clementina (ccl1, ccl2_FL(full length), ccl2_EST (EST collection)], Anaplasma phagocytophilum (aph) and the whale metagenome (wme)). Dataset information is summarized in Table 4 . Six datasets correspond to EST projects of organisms in different biological taxa, from lower to higher eukaryotes. The ccl2 dataset contains both ESTs and assembled full-length protein sequences. The wme dataset consisted of protein data from the whale metagenomics project ( 38 ) obtained by 454 sequencing (open reading frames pre-processed for homology on relaxed BLASTx (Tamames, personal communication).
Different datasets used to study the Blast2GO annotation method ( 8 )
| Dataset | Species | No. of sequences | Type | Reference |
|---|---|---|---|---|
| ccl1 | Citrus clementina | 6263 | EST | Forment 2005 |
| min | Meloidogine incognita | 3035 | EST | dbEST |
| tha | Trichoderma harzianum | 3476 | EST | Vizcaino 2006 |
| gma | Glycine max | 9764 | EST | Soja GeneChip |
| pfl | Platichthys flesus | 3286 | EST | Williams 2006 |
| ccl2_FL | Citrus clementina | 1556 | Protein | Terol 2007 |
| ccl2_EST | 4073 | EST | ||
| aph | Anaplasma phagocytophilum | 1369 | cDNA | TIGR |
| wme | Whale metagenome | 33951 | Protein | Tringe 2005 |
Evaluation task 1: annotation performance
The 32 annotation configurations were automatically applied to seven datasets (ccl1, min, tha, gma, pfl, aph, wme) and basic performance statistics were calculated. We computed the percentage of annotated sequences over the complete dataset, the percentage of annotated sequences over those potentially annotatable by homology transfer (with positive GO mapping or InterProScan result), the GO-term level distribution, the number of annotations per sequence and the GO augmentation by InterPro and Annex. Paired t -test and ANOVA (ANalysis Of Variance) analyses were carried out on performance data to assess significant contributions of annotation factors to variations in annotation results.
Evaluation task 2: manual curation
In order to get a closer insight in the process of sequence annotation, 100 sequences from each of the ccl1, pfl and min datasets were manually reviewed by scientists actively working in the study of the different species. The curation process involved eight out of the 11 basic annotation styles (default style was only considered at Gow = 5, see Table 2 ) and proceeded through a direct revision of BLAST and annotation results. For each query sequence the following aspects were documented: number and taxa of different species spanned in the BLAST result (in a maximum of 20 BLAST hits), consistency of gene product descriptions through different hits, number and coherency of annotated GO terms on the light of current expert knowledge and/or available literature over the hit sequences, ratio between correct-declared and wrong/doubtful-declared annotations, GO term type and hit of origin in case of wrong-declared annotations and a global evaluation of the correctness of the annotation. As a working procedure, the described evaluation was applied to the Blast2GO default annotation style (default, Gow = 5) and the remaining seven annotation types were compared to the standard for their increase or decrease in annotation correctness and coverage.
Evaluation task 3: cis annotation
One of the concerns when annotating incomplete EST sequences through BLAST-based methods is the danger of transferring functions located in a protein domain for which no homology comparison can possibly be done. We have referred to this as cis annotation. Since direct evaluation of this problem can be rather complicated we attempted an approximation by analysing changes in annotation results when different percentages of query and hit sequences are taken into account. Therefore, we implemented a filter (%hit) into the annotation module which allows selecting hit sequences which are spanned by the query sequence by at least the given percentage. For this assessment, we used the ccl2 unigene dataset which contains a set of 1556 full-length unigenes together with a varying number (2 to 46) of EST sequences associated to each of the full-length sequences, and the wme protein dataset. The ccl2_FL (full length) unigenes and wme protein sequences were annotated at various %hit values (80%, 70%, 60% and 0%) and annotation results were compared to results obtained at a %hit filter value of 90% (which indicates that practically the totality of the hit sequence is spanned by the query sequence). Furthermore, the EST fraction of the ccl2_EST dataset was also annotated at the same varying values of %hit filter and compared sequence-wise to the 90% hit filter result on full-length data. Finally, translated full-length sequences were directly annotated using BLASTp against the NCBI non-redundant protein database and compared to the annotation of their nucleotide counterparts. In all cases, the comparison between two annotation sets consisted of computing the number of exact matches, more specific terms, more general terms and terms in other GO branches or at other GO categories.
Evaluation task 4: functional genomics
Annotations generated by different annotation styles were used to assess GO term enrichment in expression data available for three EST datasets, using the Fisher's Exact Test function implemented in Blast2GO ( 39 ). Two evaluations related to differentially expressed unigenes (d.e.u.) obtained in stress-response studies were carried out on the CitrusChip (ccl1, 688 d.e.u's, Colmenero et al ., in preparation) and Flounder Chip platforms (pfl, 852 d.e.u's). The third evaluation corresponded to the T. harzianum EST project (tha) and assessed functional differences of the L06 library's unique genes (solid media-grown cultures) in comparison to L02, L03 and L05 libraries (liquid media-grown cultures). Significant GO term results, obtained using the Blast2GO Enrichment Analysis function with annotation sets generated by the different annotation styles, were contrasted within datasets by comparing most specific terms at different branches of the generated DAGs.
RESULTS
Annotation styles
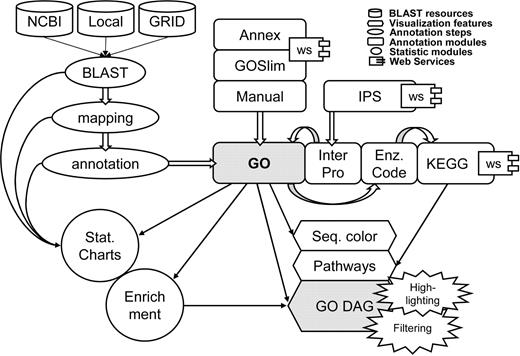
Annotations were generated for seven different datasets by applying all annotation styles automatically and recording performance criteria. Although absolute annotation values varied among datasets and a few local specificities were observed, the pattern of variability through annotation styles was basically the same for all seven species and the Blast2GO method was shown to be robust across different data sources. As a general rule, finding homologous sequences was the key step for obtaining functional results. In case a positive BLAST result was recovered, most sequences succeeded in obtaining GO information and only a small fraction of the data was discarded, specifically at the mapping step ( Table 5 ). Final annotatability was dependent on the annotation style of choice, but for all configurations a relationship was observed between the length of the query sequence and the annotation success ( Figure 2 ). The protein ccl2_FL dataset had a significantly lower percentage of sequences without BLAST result than those observed with the related ccl1 EST dataset, possibly due to the larger and cleaner sequences or to the higher commonality expected for full-length clones.
Percentages of annotated sequences in relation to their length shown in base pair. For all datasets, a positive correlation between sequence length and annotability is observed. The sudden drop of the gma, tha and ccl curves responds to the absence of sequences at long lengths for those datasets.
Annotatability statistics for sequence datasets
| Dataset | Length (nt) a | No BLAST | No mapping | No IPS (%) | No FI |
|---|---|---|---|---|---|
| ccl1 | 499[403–614] | 29.4 | 2.8 | 64.3 | 30 |
| min | 639[517–725] | 25.5 | 7.6 | 52.4 | 29 |
| tha | 613[580–691] | 18.7 | 23.8 | 63.3 | 39 |
| gma | 351[272–454] | 35.1 | 4.6 | 72.9 | 38 |
| pfl | 620[409–797] | 54.4 | 4.5 | 72.1 | 50 |
| aph | 791[201–1084] | 39.2 | 7.3 | 55.5 | 43 |
| wme | 470[219–669] | 17.0 | 13.6 | 45.4 | 24 |
| ccl2_FL | 1208[941–1422] | 1.21 | 1.22 | 25.5 | 1.4 |
a Mean sequence length in nucleotides and interquartile range. Percentage of sequences without BLAST (no BLAST), without Blast2GO mapping (no mapping), without InterProScan result (no IPS) and globally without any functional information (no BLAST + no mapping + no IPS = no FI) are given over the totality of the sequences.
From strict to all mapping annotation
As it was expected, increasing the stringency of the annotation style resulted in a lower number of annotated sequences and a reduced number of GO terms per sequence. The mean GO level was not greatly affected except for the ‘all mapping’ style which recovered a relatively large number of general terms ( Figure 5 ). An interesting phenomenon was observed with the restrictive annotation styles. The strict annotation style demands high sequence similarly (75%) and non-electronic GO annotation evidence. This style annotated on average only 17.4% of the total sequences (or 27.2% of the sequences when calculated over the number of sequences with some functional information, i.e. having a positive mapping or InterProScan result, from now on denoted as ‘over FI’). Two groups of datasets were evident at this configuration. On one hand, wme, tha and aph datasets obtained only 3 to 7% (5 to 11% over FI) of annotated sequences while the gma, pfl, ccl and min dataset had a coverage between 16% (25% over FI) and 35% (55% over FI). The annotatability of the first group remained poor at ‘manual-default’ and ‘manual-all’ styles which maintain the non-electronic EC configuration while lowering similarity requirements. However, the annotatability of the second group was dramatically improved at manual configurations (above around 45% and 70% over FI), surpassing even the performance obtained for the automatic configuration where no EC control is imposed but high sequence similarity is required. It should be mentioned, however, that when InterPro and Annex functions were included in the annotation configurations, differences between the two groups decreased greatly and annotation coverage was above 40% (63% over FI) in all datasets ( Figure 5 ).
InterProScan
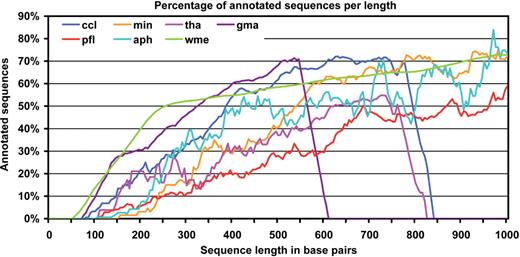
Function recovery from InterProScan was relatively time consuming in comparison to BLAST searches. Typically, the InterProScan function took 8.5 h to run 1000 sequences on the EBI's web service querying nine different available databases (BlastProDom, FPrintScan, HMMPIR, HMMPfam, HMMSmart, HMMTigr, ProfileScan, ScanRegExp, SuperFamily). In comparison, BLAST results for the same amount of sequences were available from NCBI non-redundant protein database within ∼3 h. On average around 40% of the query sequences obtained a GO functional assignment from InterProScan. The resulting annotation sets consisted of around 2.5 GO terms per sequence at a medium GO level of 4.8. Combination of BLAST and InterPro always improved data annotatability and logically, the added value of InterPro derived annotations was dependent on the annotation style. The number of annotated sequences at ‘strict’ and ‘manual’ annotation configurations was increased by a factor of 2–8 upon merging InterProScan results while less rigorous styles showed improvements of ∼10%. Statistical analysis of InterProScan augmentation (paired t -test) showed a significant increase in the number of annotated sequences ( P -value = 7e-13) and number of GO terms per sequence ( P -value = 3e-8) in the InterProScan-including annotation configurations compared to non-InterProScan counterparts. Term specificity (mean GO level) was not significantly affected. These results show that domain-based functional information is to a great extent, but not completely, comprised within homology-based function transfer and that BLAST-derived annotation collected functional information not available through InterPro.
Annex
The Annex tool proved to be another very interesting approach to improve annotation density. Annex annotation obviously did not result in an increased number of annotated sequences since this method ‘only’ adds related terms to sequences for which GO categories have been assigned previously. By applying the Annex function the number of annotating GO terms could generally be enriched by around 15% ( Figure 3 b). This means that much of the molecular function information obtained by either domain recognition or homologue sequences could be supplemented by implicit biological process or cellular component terms. Annex augmented the number of GO-terms per sequence on average by 1 and increased the all over term specificity by a mean of 0.17 levels, thus providing a higher quality in the resulting annotation. Both changes showed to be statistically significant (paired t -test P -values of 1e-18 and 1e-30, respectively).
Changes in the annotation results after applying InterProScan and Annex functions. Annotation increment was computed as the difference in annotation percentages with and without augmenting parameters. While Annex shows a general increase in GO terms InterPro augments the number of annotated sequences especially with restrictive annotation configurations.
GOw
The Blast2GO functionality to annotate at variable GO confidence levels was evaluated by varying the GO weight parameter of the default annotation style from 0 to 15. Increasing the GOw value resulted unequivocally in an increment of the annotation result. Up to 10% (15% over FI) more annotated sequences were obtained by increasing the GOw from 0 to 15. The mean GO term level also increased by 0.25, as would be expected from the abstraction procedure. These differences were statistically significant; ANOVA confirmed the significance of the GO weight parameter concerning the number of annotated sequences ( P -value = 8e-6), number of assigned GO terms ( P -value = 6e-6) and the term specificity ( P -value = 1e-7). ANOVA analysis also confirmed significant differences at the mean value of annotation performance metrics between different datasets/organisms.
Manual curation
Manual inspection of the annotation results of 300 sequences of three different organisms was carried out by species-specific expert curators. Data were vector-trimmed cDNA sequences originating from EST projects with lengths between 210 and 2825 nt and a median value of 610 nt. Manual curation consisted basically of a human review of BLAST results and of available electronic information on hit sequences, followed by crosschecking with the electronic annotation generated by Blast2GO.
GO term annotation with default Blast2GO parameters was in general in agreement with the computational review on available sequence information ( Figure 4 ). In nearly all cases, BLAST hits of a given query shared similar sequence descriptions and covered a plurality (∼8 on average) of organisms, which is an indication of the consistency within BLAST results. Moreover, BLAST sequences providing most annotation data tended to belong to species taxonomically related to the queried organism. In some cases (5%) human review suggested wrong or seriously doubtful GO assignments. Curiously, most of these rejected assessments corresponded to annotations at the cellular component GO category possibly due to a high false-positive rate in automatic determinations of cellular localization signals. Other annotation styles were compared to default configuration accordingly to the extent of their restrictive nature ( Figure 5 ). The ‘strict’ configuration failed to generate any annotations on average in ∼36% of the cases, and those terms assigned by this style were in general considered as reliable. On the other hand, permissive annotation configurations tended to generate richer annotations than default parameters, although frequently introduced doubtful assignments in the annotation result. For example, compared to the default style generous and all-mapping configurations retrieved more GO annotations for about 40% of the sequences. However, these more permissive annotation styles assigned functional terms that were considered inconsistent or clearly wrong on average in 16% of the cases. An additional interesting behaviour was the effect of the GOw parameter in the annotation of short sequences. Sequences below 400 nt were in general more difficult to annotate and obtained higher level GOs due to the abstraction term of the Blast2GO annotation formula. Finally, InterPro was in general more limited in providing GO annotations, either because of lack of domain information (most cases) or to the absence of a mapping between an InterPro identifier and a GO term. When available, InterPro-based annotation was in nearly all cases in agreement with BLAST-based annotation.
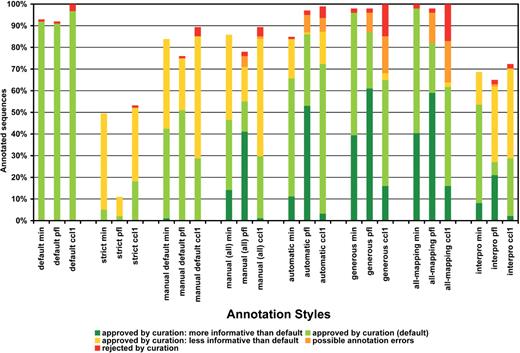
Summary statistics of manual curation study. Manual evaluation was applied on GO annotation results of eight basic annotation styles applied on cc1, pfl and min dataset. Annotation of 100 sequences per dataset was review and classified as: approved at default style, approved but more or less informative than default, rejected, generally approved with minor possible errors or missed (no GO terms recovered). Percentages of each class are given on the total number of sequences.
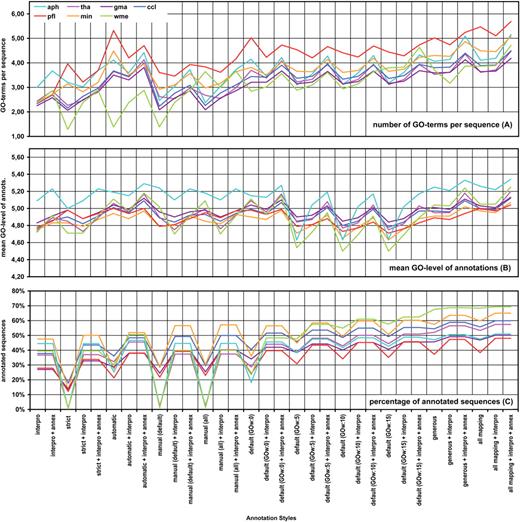
Results of the annotation performance evaluation task. The number of GO term per sequence ( A ), the average level of GO term ( B ) and the percentage of successfully annotated sequences over the full dataset ( C ) are given for seven different datasets annotated at 32 different annotation styles (see Methods section for details).
Cis annotation
Of the total of 1556 ccl2 full-length sequences, only 787 could be annotated when a %hit filter of 90 was applied. Similarly, only 1764 wme protein sequences resulted annotated with this setting. These sequences were further used in comparison to annotation results when lower hit coverage values were imposed in the analysis. Results are given in Tables 6 and 7 . Lowering the %hit filter parameters resulted, as expected, in an increase in the number of recovered annotations. However, the number of extra annotations obtained was relatively small (∼5%) and annotation results were to a great extent similar to those obtained using highly spanned hit sequences (%hit filter = 90). Equivalent annotations ranged between 84 (no %hit filter) and 89% (%hit = 80) for the ccl2_FL dataset and between 94 (no %hit filter) and 97% (%hit = 80) for wme ( Table 6 ). This indicates that a control of the hit sequence length spanned by the BLAST alignment has little influence on the annotation performance. Next, the ccl2_EST data fraction was annotated and compared to the annotation results on the ccl2_FL data ( Table 7 ). When no filter on the percentage of covered hit sequences was used 78% of GO terms found for EST sequences were also present in their full-length counterparts. This value dropped to 70% when only full-length sequences were annotated at a %hit filer value of 90. When ESTs were also required to fulfil this high coverage, again agreement between full-length and EST annotation was 78%. It should be mentioned, however, that only 207 sequences satisfied the filter criterion in this latter case. These results indicate that a difference of around 20% in the number of GO annotations could be expected when a partial query sequence (EST) is considered instead of the full length, and that around 30% of the functional annotations originated from BLAST results where the BLAST alignment misses some part of the hit sequence.
Comparison for full-length (FL) proteins of the ccl2 and wme datasets
| %hit | Compared sequences | GO terms | Exact match (EM) | More specific (MS) | Other branch (OB) | Other category (OC) | Equivalent annotations (%) |
|---|---|---|---|---|---|---|---|
| 0 (ccl2) | 787 | 3569 | 2863 | 118 | 308 | 280 | 84 |
| 60 (ccl2) | 787 | 3500 | 2872 | 111 | 271 | 246 | 85 |
| 70 (ccl2) | 787 | 3467 | 2881 | 98 | 255 | 233 | 86 |
| 80 (ccl2) | 787 | 3343 | 2894 | 84 | 196 | 169 | 89 |
| 0 (wme) | 1764 | 4576 | 4109 | 212 | 137 | 118 | 94 |
| 60 (wme) | 1764 | 4465 | 4145 | 158 | 81 | 80 | 96 |
| 70 (wme) | 1764 | 4441 | 4152 | 149 | 71 | 69 | 97 |
| 80 (wme) | 1764 | 4413 | 4169 | 127 | 59 | 58 | 97 |
Annotations were generated setting the %hit filter to 90, 80, 70, 60 and 0, and results were saved. Then, pairwise comparisons were done with each annotation result and the %hit=90 annotation result.
Comparison between annotation results of full-length (FL) unigenes and corresponding EST sequences of the ccl2 dataset, with varying treatments of the %hit parameter
| %hit FL–EST | Compared sequences | GO terms | Exact match (EM) | More specific (MS) | Other branch (OB) | Other category (OC) | Equivalent annotations (%) |
|---|---|---|---|---|---|---|---|
| 0–0 | 572 | 3074 | 2227 | 333 | 241 | 106 | 78 |
| 90–0 | 338 | 1944 | 1191 | 158 | 254 | 240 | 70 |
| 90–90 | 207 | 870 | 651 | 97 | 60 | 37 | 78 |
Finally, annotation of deduced protein or nucleotide sequences of full-length clones resulted in a mean annotation agreement of 99%, which indicates that possible (wrong) alternative open reading frames of nucleotide sequences do not have an impact on the annotation procedure.
Functional genomics
The effects of the annotation strategy of choice on functional genomics research was evaluated by monitoring changes in the list of significant features that result from a GO term Enrichment Analysis using the annotation sets generated by each of the different annotation styles. Three different datasets were employed for this evaluation. In two cases—Citrus (ccl1) and Flounder (pfl) datasets—the enrichment function was applied on the list of differentially expressed genes from Microarray studies, while the third one—Trichoderma (tha)—relates to the comparison of libraries of an EST project. Results are provided in detail in the Supplementary Data ( http://blast2go.bioinfo.cipf.es/supplementary.html ). The number of significant terms varied across the different annotation styles for all three datasets, with coefficient of variations between 0.2 and 0.3. In general, addition of InterPro annotation and Annex augmentation increased the number of significant features. In some cases, restrictive annotation styles (strict and manual) failed to provide any significant results and there was a weak positive relationship between the number of significant terms and the number of annotated sequences generated by the annotation configuration. However, when analysing the semantic content of the lists of significant features, a quite robust picture was obtained. The number of different DAG branches within the lists of significant terms was notably reduced in comparison to the initial number. For example, the tha results changed from a median value of 13 terms to 4 when the annotation coherency function was applied to the graph of significant results. This means that many parent–child relationships were present in the list of enriched GO terms. Similar behaviour was observed for the ccl1 and pfl datasets. In all three cases, a basic set of common enriched categories was present across all annotation configurations and some extra interesting terms were noted when specific annotation (intensive) styles were used. For example, in the case of the ccl1 dataset, which evaluated enriched GO categories in genes that respond to salty soil conditions in Citrus, the terms ‘ribosome’, ‘translation’ and ‘structural component of ribosome’ appeared significantly enriched in all annotation styles. In some cases, related terms such as ‘ribosome biogenesis and assembly’ were also within the results. These terms point to the known basic alterations in the protein turnover which are observed in stress conditions (Colmenero et al ., in preparation). Other processes like ‘thylakoi part’ and lipid metabolism related terms, indications of the modification in the energy balance in stressed plants, were also significant in most cases, varying the specific term that pointed to this functional aspect (eg. ‘lipid transport’ or ‘lipid biosynthetic pathway’). Similarly, ‘lipoxygenase activity’, a marker of response to stress, was frequently present in the list of significant terms, sometimes accompanied or replaced by redox- related terms such as ‘electron transport’, ‘iron ion transport’ and ‘oxidoreductase activity’. Finally, hormone-signalling terms (‘jasmonic acid biosynthetic pathway’ and ‘auxin-mediated signalling pathway’) were significant in strict and automatic configurations, while ‘response to chemical stimulus’ and ‘response to water’ were present in the results for ‘default’, ‘generous’ and ‘all mapping’ annotation styles. An equivalent discussion could be drawn for the lists of significant GO terms that were obtained with the other two datasets (see Supplementary Data for details: http://blast2go.bioinfo.cipf.es/supplementary.html ).
Summarizing, we can conclude from this analysis that the choice of annotation style influenced the results in enrichment analyses applied to the generated annotations, but that a common biological message was obtained throughout different configurations. Some specific functional aspects were highlighted by specific annotation styles and although InterPro and Annex contributions commonly increased significant results, there was no unequivocal ‘best’ or ‘most informative’ option.
DISCUSSION
The expansion in the use of functional genomics technologies in biological research has specific consequences in computational biology. Many labs that include functional genomics approaches in their research proposals are middle size and do not necessarily benefit from a strong bioinformatics supporting department. Still, a considerable amount of (novel) sequence data can be gathered and analysed by these research groups. This translates into a requirement for freely available computational tools that on one hand are technically accessible in terms of installation and use, and on the other hand are simultaneously high-throughput, reliable and flexible. User friendliness and transparency are key properties for the success of a bioinformatics solution within these research environments ( 40 ). When considering the functional annotation of uncharacterized sequences the balance between accuracy and intensity becomes an additional aspect. All these elements have been driving guidelines in the development of the Blast2GO application.
Blast2GO features
The adopted implementation accessible through Java Web Start technology links the higher power of a desktop application with the easy-to-use and easy-to-update web-based solution. The functionalities incorporated in version 2 have substantially reinforced these two basic aspects of the software. The annotation module can now be customized by a wide array of options. Some of them affect the BLAST procedure (database of choice, homology stringency, number of BLAST hits and relative HSP matching length) while others take advantage of Gene Ontology schema related information (Evidence Codes, GO weight, Second Layer database, GOSlim) or integrate alternative functional features, such as InterPro or KEGG. Many statistical and graphical functions gathered along the way permit an exhaustive evaluation of annotation results. Charts are available to inspect almost any possible element of the annotation procedure, from distribution plots on BLAST e-values or similarities, evidence codes or annotation sources to species in BLAST hits to summarize annotation results as well as GO levels or InterPro and Annex augmentations. The GO DAG highlighting, pruning and projection functions are additionally invaluable tools for understanding the overall biological meaning of the sequences under study.
Compared to related public functional annotation resources, a key distinguishing feature of Blast2GO is, in our opinion, its strong orientation to support functional genomics projects. While other tools can be basically regarded as mere generators of functional annotations at varying throughput ranges, Blast2GO has been conceived to widely assist and guide this process on the large scale. Blast2GO can be seen as a working platform to generate sequence functional data, and in fact many of the annotation aspects studied in the experimental part of this work could not have been addressed with any of the other tools.
Blast2GO annotation assignment
One aspect was the influence that the characteristics of the input data and the variations in annotation parameters have on the resulting annotation. We have shown that as a general rule, annotation trends are species and sequence-type independent, although there were features that were influenced by specific data. Annotatability was dependent on the length of the query sequence. In general, the longer the sequence, the higher the chance of annotation and the number of GO terms recovered. Consequently, full-length protein datasets reached the highest annotatability values ( Table 5 ). The bottom length values for annotatable sequences were dataset specific, which is possibly related to varying quality issues of the different EST collections. The relation between sequence quality and number of annotated GO terms was of interest when the annotation configuration included a positive GO weight and therefore enabled abstraction. In this case, short sequences at the edge of similarity requirements but mapping at multiple low hierarchy GO terms could obtain a sufficient annotation score at a higher hierarchy level due to the contribution of the abstraction term of the Blast2GO annotation formula.
The annotation behaviour in relation to other parameters such as ECWs and annotation cut-off showed some interesting results. While, in general, annotatability was proportional to the stringency of the configuration style, two types of patterns became apparent within the studied datasets. For some species, annotation coverage values were low (5–10%) at the strict configuration and remained poor at ‘manual-default’ and ‘manual-all’ styles, which maintain the non-electronic EC configuration while lowering similarity requirements. Another group obtained much better annotation results at the most restrictive style (around 40%) and notably improved annotatability at manual configurations (above 70%), surpassing even the performance achieved for the automatic configuration where no EC control is imposed but high similarity is demanded. This indicates two possible scenarios within the gene ontology database. For some species, electronic annotation records would be overwhelming and functional similarity transfer to related organisms will be greatly dominated by these unsupervised annotations. On the contrary, more intensively studied species may have a significantly higher amount of non-electronic functional assignments and similarity based annotation to close taxons would be more dependent on the homology parameter. Lower organisms (fungi, bacteria) seem to dominate in the first case, higher eukaryotes (Arabidopsis, human, rat) are among the second. In any case, charts available under the Blast2GO statistics menu give information on species and EC distributions among BLAST and mapping results, which are of help when deciding the type of annotation strategy recommendable for a particular dataset.
Annex and InterPro
Annex and InterPro augmentations resulted in quantitative—more terms—and qualitative—more specific and confirmed terms—improvements on annotation results. The information redundancy across GO main branches is a hot topic within the Gene Ontology community. The Second Layer database ( 34 )—used in the Annex function—was the first serious attempt to provide high-quality mappings between GO terms, and we are aware of similar efforts within the Gene Ontology consortium [E. Dimmer (UniProt, GOA( 33 ), personal communication]. Our results are indicators of the potential annotation gain and support the convenience of this type of strategies. On the other hand, functional assignments from the InterProScan searches were in general confirmatory of the BLAST-derived results. This is not surprising since most of the annotations within the GO database are assigned by the GOA( 33 ) project (which is part of the UniProtKB initiative at EBI) where most electronic annotations are based on InterPro domain information. Still, a significant amount of new functional information could be obtained through InterProScan which was not found through BLAST, and the magnitude of this improvement was inversely related to the strictness of the adopted BLAST strategy ( Figure 3 a). Two aspects are important to stress in this analysis: InterProScan annotation augmentation occurs mainly through the increase in the number of annotated sequences and the mean GO level (specificity) of the InterProScan-derived functional terms does not differ significantly of that obtained through BLAST. This suggests that an efficient annotation strategy would be to first launch the BLAST procedure over the whole dataset and submit only to the time-consuming InterProScan service those sequences that failed at the BLAST step. A final ANNEX run on the merged results would provide extra 10–15% of annotations within reduced computing time.
Evaluation of annotation quality
A substantial manual evaluation of 300 sequences from three different datasets was performed as a way to more precisely understand the annotation procedure and to gain a closer insight into the quality of the automatically generated information. At this point, it is important to state that the aim of this evaluation—and in general of the work presented in this paper—was not to provide a means of evaluating the correctness of an annotation method or to rate the exactness of the Blast2GO strategy. These points were addressed when the tool was first presented ( 8 ).
The risk and limitations of function transfer from sequence homology have been extensively studied and the Blast2GO method was shown to have a good performance within these limitations. Jones et al . ( 41 ) defined the basic metrics to evaluate the performance of an annotation method and showed that discriminant function approaches combining multiple information sources, such as Blast2GO, provided in general relatively high-quality functional predictions. The measurement of the performance of a annotation method (e.g. by recall, precision or harmonic mean) brings along several computational difficulties such as how to take into account (i) indirect re-annotation (ii) GO term comparison within GO hierarchy or (iii) the quality/specificity of existing annotations or even (iv) which datasets to choose for the study (e.g. model/non-model species). Furthermore, annotation evaluation methods are based, necessarily, in comparing the results of an annotation strategy to a true standard. However, when annotating novel sequences there is no possible comparison to true values. In this case, a more realistic question to ask is to how well the automatic method does in comparison to a human analysis with the available information, i.e. how the electronic annotation compares to a reviewed computational analysis. This idea has been pursued within the manual evaluation carried out in this work. This manual evaluation performed on three different datasets and by three different researchers showed that in general, annotations recovered by the Blast2GO default method were consistent with what one should conclude studying on-line information. BLAST results were coherent within each sequence and annotating hits tended to be of related species to the query organism. In most cases where PubMed and GeneBank/UniProt records were studied, documented evidence was found for the proposed functional terms. Doubtful or strongly suspicious functional assignments were found in a minority of cases ( Figure 4 ). These results are apparently in disagreement with recent work that estimated a 49% error rate on homology transfer annotations based on exact-match recall statistics against non_ISS annotations ( 2 ). We must argue that our evaluation indicates the agreement between automatic versus human/manual functional assignments based on homology analysis and not between putative true/false functionalities. Moreover, these figures refer to the Blast2GO default annotation style which optimally uses the parameters within the Blast2GO annotation algorithm ( 8 ). More restrictive styles dropped in coverage, while configurations that did not take Evidence Codes into considerations or had lower homology requirements, as is frequently seen in annotation pipelines, tended to generate richer but more insecure annotation results ( Figure 4 ).
Functional genomics
Many Blast2GO users deal with EST and cDNA sequences that are generated from approaches to genome characterization in non-model species. Expressed data are then used for functional profiling on Microarray experiments and for the characterization of tissue/process specific libraries. In these contexts, certain questions arise related to the functional annotation of the sequence data. As ESTs are typically incomplete transcripts, one major concern is the risk of function transfer from functional domains of hit sequences whose homology to the query sequence cannot be determined. Similarly, when using novel sequences in Microarray studies one might wonder how variations in the annotation procedure could affect the functional evaluation of a differential gene expression result. The last two evaluation tasks of this work aimed to provide insights to these issues. The possible extension of the cis -annotation risk was indirectly estimated by comparing the annotations of full-length contigs and individual EST clones and the differences in annotation results with and without control of the percentage of the hit sequence actually matched. Annotation equivalence between full-length and EST clones of 78% indicates that, provided a positive annotation result, the values obtained with ESTs highly resemble those which would be recovered if the complete coding sequence were available. Requiring a matching length of 90% on the BLAST hits produced annotation differences of 3–15% on full-length sequences and maximally 30% for ESTs. Taken together, these results indicate that functional transfer from non-functionally conserved domain, if occurring, is not dependent on the relative extension of the matching alignment and that possible noise introduced by incomplete ESTs could not be considered as worrying.
Moreover, our functional genomics evaluation tasks showed that enrichment analysis using automatic annotation files generate a basic functional picture that is robust through annotation styles but that extra information can be obtained dependent on the adopted annotation strategy. These differentially enriched GO terms illustrated additional aspects of the functional response and although the available data did not point to a ‘best’ functional annotation configuration, the use of rich annotation styles including Annex and InterPro augmentations tended to provide wide and meaningful functional enrichment results.
Concluding remarks
Following the mission of this work, we can now provide users with some recommendations for a good annotation practice using Blast2GO. As general annotation guideline, users should consider the quality of their sequence data (through BLAST e-value or similarity charts) and the final use of annotation results. When high similarities (above 65–70%) are dominant, application of Blast2GO default parameters is generally recommended. At lower similarity values, more permissive annotation style can be applied to obtain general functional information on the dataset, but individual sequence annotations should be taken with caution. Alternatively, high hierarchy level GO annotations can be recovered in these cases by setting a high GOw (e.g. 15) as annotation parameter. If high annotation confidence is desired and low coverage is not an issue, we recommend the modification of ECWs to consider only curated annotations, raising the annotation cut-off to 75 and applying a high %hit filter. In general, InterProScan and Annex augmentations are highly recommended. For large dataset, users might consider running InterProScan only on those sequences that failed the BLAST based annotation. Finally, an alternative strategy is to perform different runs of annotations at different stringency levels, selecting after each run the non-annotated sequences and submitting only those to a more permissive annotation style in the next run.
SUPPLEMENTARY DATA
Supplementary Data is available at http://blast2go.bioinfo.cipf.es/supplementary.html .
ACKNOWLEDGEMENTS
This work was funded by the Spanish Ramon y Cajal Program and work at the CIPF is supported by grants from the Centro de Investigación Biomédica en Red de Enfermedades Raras (CIBERER) ISCIII, grant BIO2005-01078 from the Spanish Ministry of Education and Science. The work at Centro de Genomica (IVIA) is supported by grant RTA04-013, INCO contract 015453 and grant AGL2007-65437-C04-01/AGR. S.H.N. is grateful to Macquarie University for the award of iMURS research scholarship. Funding to pay the Open Access publication charges for this article was provided by the National Institute of Bioinformatics ( www.inab.org ) a platform of Genoma España
Conflict of interest statement . None declared.

Comments