


ABSTRACT
The InParanoid project gathers proteomes of completely sequenced eukaryotic species plus Escherichia coli and calculates pairwise ortholog relationships among them. The new release 7.0 of the database has grown by an order of magnitude over the previous version and now includes 100 species and their collective 1.3 million proteins organized into 42.7 million pairwise ortholog groups. The InParanoid algorithm itself has been revised and is now both more specific and sensitive. Based on results from our recent benchmarking of low-complexity filters in homology assignment, a two-pass BLAST approach was developed that makes use of high-precision compositional score matrix adjustment, but avoids the alignment truncation that sometimes follows. We have also updated the InParanoid web site (http://InParanoid.sbc.su.se). Several features have been added, the response times have been improved and the site now sports a new, clearer look. As the number of ortholog databases has grown, it has become difficult to compare among these resources due to a lack of standardized source data and incompatible representations of ortholog relationships. To facilitate data exchange and comparisons among ortholog databases, we have developed and are making available two XML schemas: SeqXML for the input sequences and OrthoXML for the output ortholog clusters.
INTRODUCTION
Identifying orthologs is a critical goal in genomics, because orthologs, which are defined as genes in different species which derive from a common ancestor, are likely to perform the same function (1). We call genes within a species that have duplicated after the speciation event inparalogs, and they are by definition orthologous to one or more orthologs in another species since they descended from the same gene in the last common ancestor (2). In contrast, outparalogs have duplicated before the speciation event and are therefore not orthologs. Most ortholog-finding techniques are successful in cases where there is one copy of a gene in each species. By distinguishing between in- and out-paralogs, the InParanoid algorithm can identify one-to-many and many-to-many ortholog relationships.
There are now a large number of methods for predicting ortholog sets, reflecting the wide variety of applications over which these methods have specialized [reviewed in (3–9)]. Although these methods each have nuances in their approaches, one can broadly classify them into two groups: those which focus on building ortholog groups by clustering pairwise gene relationships and those which are based on tree reconstruction. The tree methods typically reconcile gene and species trees in order to assign duplication and speciation nodes, as well as detect gene losses. Both approaches have advantages and disadvantages. The pairwise methods are more applicable on a global scale, while the tree methods more directly try to reconstruct the evolutionary scenario. In three recent orthology database comparisons that seek to assess objectively the accuracy of functional annotation against a common gene set, the previous version of InParanoid ranked at the top (4,6,9). Altenhoff and Dessimoz (9) also did a phylogenetic test, in which InParanoid performed near the top. Tree-based methods generally performed worse than pairwise clustering methods, also sometimes in the phylogenetic test.
We here present InParanoid 7, comprising 99 eukaryotic species and Escherichia coli as a prokaryotic outgroup. We describe updates to the InParanoid algorithm and compare the results to the prior implementation. The new features of the web site such as the ortholog group view with sequence tree and domain architectures are delineated. We analyze the interspecies relationships in terms of orthology content, and a comparison of the source data sets relative to the previous version of InParanoid is provided. Finally, we introduce two new data formats, SeqXML and OrthoXML, designed to overcome the challenges of aggregating gene sets and benchmarking ortholog databases.
DATA AND IMPLEMENTATION
The proteomes were obtained from various sources. If possible we tried to download the data from Ensembl (10); this is mainly due to their regular updates of the data sets. In total, 23 genomes were retrieved from Ensembl, 17 from JGI (http://www.jgi.doe.gov/), 10 from FGI (http://www.broadinstitute.org/annotation/fungi/fgi/), 7 from Flybase (11), 7 from NCBI (12), 6 from WormBase (13), 6 from Sanger (http://www.sanger.ac.uk/), 4 from Génolevures Consortium (14), 3 from TIGR (http://www.tigr.org/db.shtml), 3 from VectorBase (15), 2 from PlasmoDB (16) and 2 from CryptoDB (17). Moreover, single proteomes were downloaded from GiardiaDB (18), Panther (19), Rice Genome Annotation Project (20), Dictybase (21), CGD (22), University of Tokyo (Cyanidioschyzon merolae Genome Project: http://merolae.biol.s.u-tokyo.ac.jp/), SilkDB (23), SGD (24), SGTC (25) and TAIR (26). Inparanoid 7 comprises 99 eukaryotic proteomes as well as one prokaryotic proteome. This set spans the range of sequenced eukaryotic species and includes 19 vertebrates, 35 invertebrates, 7 plants, 21 fungi and 17 protists. As we have traditionally done with InParanoid, the bacterium E. coli K12 is included as a token representative of the prokaryotes. A complete list of all species included in Inparanoid 7, as well as links to the respective data sources, can be found at the InParanoid web site (http://InParanoid.sbc.su.se/cgi-bin/summary.cgi). We aimed to include as many species as possible. However, in order to ensure a high level of completeness and quality, as in previous versions we have only considered genomes with at least 6X coverage and <1% of unknown amino acids (i.e. ‘X’ characters appearing in the protein sequence). Moreover, to avoid high levels of redundancy in the database, new genomes are only incorporated if at least 10% of the proteins are <90% identical from already included species. In practice, however, this rule did not cause rejection of any proteomes. To prevent different transcripts of the same gene from being assigned to different ortholog groups, only the longest protein for each gene was used.
Updates to algorithm
Overlap criteria
The InParanoid algorithm relies on BLAST as the underlying homology detection tool. As BLAST is a local alignment algorithm, high-scoring matches between parts of proteins, such as conserved domains, may receive high scores even though they do not reflect a common origin for the proteins as a whole. To avoid drawing conclusions from fragment matches of this type, BLAST homology inference is only accepted if the region aligned by BLAST corresponds to a large enough fraction of the lengths of the proteins. These overlap criteria have been made more stringent in version 4.0 of the InParanoid algorithm. For a match to be accepted as nonfragment, the following must be fulfilled. For both the query and the match sequence, the distance between the first and the last aligned residue must equal or exceed 50% of the length of the sequence. Furthermore, for both the query and the match sequence, the sum of the lengths of the aligned regions on that sequence must equal or exceed 25% of the length of the sequence. Note that when there are multiple high-scoring segment pairs (HSPs), InParanoid requires that they maintain the same relative order on both sequences, and that they do not overlap by >5%.
Low-complexity filters
A general issue in homology detection is the presence of false matches resulting from unrelated proteins sharing repetitive regions or regions with very biased amino acid composition. Based on an analysis of the effect that different filters have on precision and sensitivity (27), we adopted the following approach. Compositional adjustment (28,29) is applied, as is the SEG low-complexity filter (30), set so as to mask only during seeding but not during extension (soft masking). This more stringent low-complexity filtering permitted us to lower the score threshold from 50 to 40 bits. This results in high-quality homology inferences, increasing both InParanoid's; precision and sensitivity. However, as compositional adjustment often leads to shorter alignments (27), matches accepted in the first pass are realigned using BLAST with SEG and compositional adjustment switched off, before the overlap criteria mentioned previously are applied.
Evaluation of modifications to the algorithm
To ascertain that the above modifications do not produce dramatically different results, we evaluated the sets of clusters inferred by the current and previous algorithm between selected species pairs. As the underlying sequence base has been changed significantly in some cases, this evaluation was done by rebuilding parts of InParanoid release 6 using algorithm version 4.0, and then comparing the resulting cluster sets with the original InParanoid 6 (built with algorithm version 3.2). The comparison was limited to all combinations of Homo sapiens with all species included in InParanoid 6. The full results of this analysis are included in Supplementary Data. The average number of clusters across these species comparisons hardly changed between the algorithm revisions. On average, the cluster count was 2.3% smaller with the new algorithm. One-fourth of this reduction comes from a loss of 19% of the clusters with Apis mellifera, which is understandable as the version of this genome in InParanoid 6 was of low quality and subsequently was retracted by Ensembl. A large fraction of clusters are completely identical, from 72% for H. sapiens versus Oryza sativa, to 99% for H. sapiens versus Pan troglodytes, with the fraction increasing for more closely related species. Our interpretation of this is that the new, more stringent version of the algorithm infers fewer erroneous clusters of a type more often seen between distantly related species. While the difference between cluster sets can sometimes be substantial, we are confident that the stricter criteria produce orthology inferences that are biologically more sound.
Data processing with XML
With InParanoid 7, we have introduced a new data schema based on standardized XML files. This makes it easier to efficiently process data and, more importantly, to validate the content. We have replaced plain text files with XML files in as many places as possible throughout the InParanoid workflow (Figure 1). These changes, which the following sections describe in detail, dramatically increase the flexibility and robustness of the analysis pipeline and data exchange with the third parties.
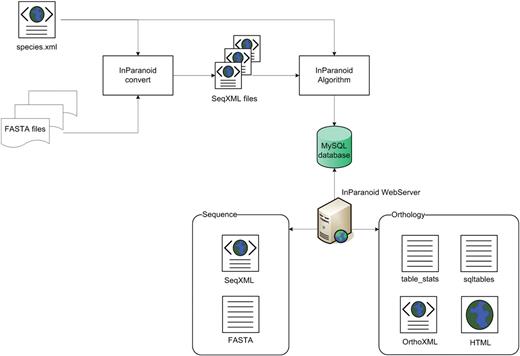
A diagram showing the use of XML in the InParanoid workflow. The InParanoid convert program starts with simple FASTA files that each have a different header line format. With the help of the species.xml file, it parses and converts them to SeqXML files, which can be easily processed and validated as input to the InParanoid algorithm. On the web site, the user can choose between different data formats; currently supported are SQL, TXT, HTML and OrthoXML.
Input
It is still common to provide sequence files in the FASTA format. Although it is a relatively easy format, being human readable and having only one header line, this simplicity causes data integrity problems due to the lack of standardization. There is no generally accepted way in defining the content of the header line. Furthermore, there can be invalid characters in the sequence and multiple entries of the same gene or protein in one file. A parser or a person has to safeguard against these issues; otherwise downstream analyses can produce erroneous results, often silently. By converting to a markup language like XML, it becomes a lot easier to avoid those issues.
In the conversion process, we also exploit XML to automatically process FASTA files. This is done by creating a file, species.xml, shown in Figure 1, containing regular expression patterns which are used to parse each type of FASTA header into appropriate data fields. In addition, the file also contains species metadata (taxon ID, database repository URL etc.) which makes it possible to track the sources and versions of each data set.
XML allows validation against a schema where one can exactly define how the content can be represented. For this purpose, we developed a new XML data schema called SeqXML. The SeqXML schema (XSD) defines the skeletal structure of the sequence files and allows one to set constraints for each type of data it contains: for example, one can limit a DNA sequence to consist only of {A,G,C,T,N}. If one then tries to import a DNA sequence containing a ‘Z’, this error will be detected automatically by any XML validator.
As with FASTA, a SeqXML file not only includes the gene or protein ID, a description and the sequence itself but also provides the option to add other data such as alternative identifiers or notes. It is our hope that SeqXML will be adopted by other sequence repositories and eventually replace FASTA for distribution of proteome data sets. The Reference Genome Annotation Project (31) has declared an intention to use SeqXML for standardized proteome sequences.
Output
InParanoid supports four different output formats: as an SQL table, plain text, HTML and a new, more general XML format called OrthoXML. The OrthoXML schema is defined broadly and supports orthology data not only from InParanoid but also from other sources as well. It is primarily aimed at holding nonhierarchical ortholog groups from pairwise clustering methods, but can in principle also hold hierarchical tree structures. As with SeqXML, the schema gives the ability to create a well-defined file with orthology data. The standardization of genome projects (Reference Genome Annotation Project) will create a set of genome datafiles available to all orthology methods. We hope that different orthology inference methods will use OrthoXML for their output, as this will make it substantially easier to parse their results and compare them. See http://www.OrthoXML.org for more information on OrthoXML and SeqXML.
Web interface
The InParanoid web site http://InParanoid.sbc.su.se has received a face-lift, resulting in a much brighter and clearer look. This new style is now uniform over all subpages. Without changing the basic functionality, we were able to significantly decrease the response times for all types of database requests. Both new and familiar users will find an intuitive and easy to use interface. As in the previous version, it is possible to browse all ortholog groups for every species pair and to search for the orthologs of a particular protein using identifiers, protein sequence or free text. In addition to visual and performance improvements, some minor features have been added. For instance, it is now possible to download the results of an identifier query as XML, and the free text search allows quoting of search strings and gives overall more accurate results. In addition to the primary identifiers taken from each proteome's; source, alternative identifiers from major databases like UniProtKB or GenBank are shown for each protein if available, and these identifiers are searchable.
Another new feature is the display of neighbor-joining bootstrap trees and domain annotations for each InParanoid cluster on the details page (Figure 2). To generate these trees, the sequences of a cluster are aligned using Kalign (32). The neighbor-joining tree is calculated with Belvu (33) where 100 bootstrap replicates are generated. Protein domains were predicted with HMMER (http://hmmer.janelia.org) by searching against Pfam 23 with Pfam_ls and Pfam_fs models. The visualization of the tree together with the Pfam domain architecture is written in Java and is shown as a Java applet or as an image if the browser does not support Java. The illustration of the domains follows the Pfam graphics guidelines (http://pfam.sbc.su.se/help, ‘Guide to Graphics’).
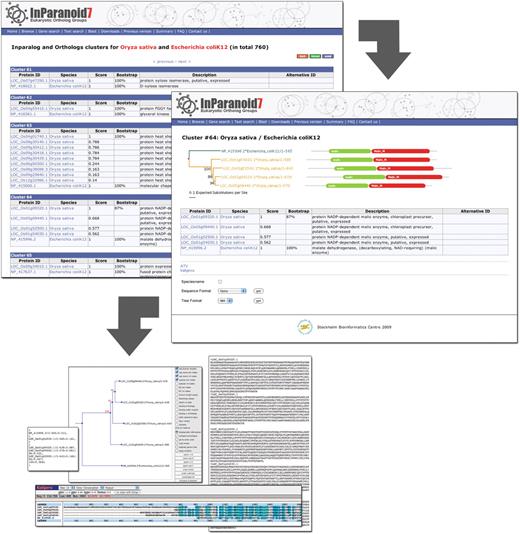
The new InParanoid web interface. The screenshot in the upper left corner shows the InParanoid clusters between O. sativa and E. coli. For every cluster, i.e. ortholog group, the members are listed with the identifiers of the proteome source and a description. The InParanoid score is shown for every cluster member and bootstrap values are given for the seed orthologs. The bootstrap value indicates the fraction of intracluster bootstrap runs that placed the seed ortholog as the best match. Clicking on the cluster number leads to the details page of the cluster (right), again listing the members and also presenting their domain annotations and a neighbor-joining bootstrap tree of them. In the tree, branches leading to sequences of the same species have the same color, and upon clicking a domain, one is redirected to its Pfam page. In addition, the details page provides a range of possibilities to further investigate the cluster. A multiple sequence alignment can be viewed in Kalignvu (37) or downloaded in various formats such as FASTA, Stockholm, MSF or SELEX. The protein tree can be can be downloaded as picture or in NH format, and it is possible to edit the tree interactively in the ATV tree viewer (38).
INPARANOID CONTENT
As in the previous release, we generated an orthology-based phylogenetic tree by UPGMA clustering of pairwise species distances derived from shared ortholog content. The distances were calculated as 1 minus the fraction of orthologous proteins, averaged over both directions (34). This ‘orthophylogram’ is now too large to be shown as a figure but can be accessed online at http://InParanoid.sbc.su.se/download/current/orthophylogram.gif.
The difference between this tree and sequence alignment-based trees is that it reflects the entire proteome's; content and the level of sequence similarity is not explicitly taken into account. Because of this, but also because of incompleteness in the proteomes themselves, it may differ from classical phylogenetic trees. For most species, it corresponds to the accepted phylogeny, but a number of noteworthy differences were observed. For instance, the guinea pig (Cavia porcellus), which is a new species in release 7, clusters with dog rather than with other rodents. The egg-laying venomous mammal platypus (Ornithorhynchus anatinus) is strangely placed at the root of all other vertebrates outside of birds, frog and fish.
Intriguingly, the macaque monkey (Macaca mulatta) is placed far outside of the other primates, even outside cow and horse. This was not the case in release 6 and appears to be an artifact of the proteome sequence. As seen in Table 1, drastic changes have been made to the proteomes of human and chimpanzee between release 6 and 7 (>25% of the sequences have been modified), but macaque is essentially unchanged. Comparing the average identity of the best BLAST HSP between H. sapiens, P. troglodytes, M. mulatta, Bos taurus and Canis familiaris in both the previous and current versions showed no major changes (see Supplementary Data).
Consistency for proteomes found in both InParanoid 6 and 7
| Species | Identical | Sequences v7/ | Identical | Average |
| sequences | Sequences v6 | IDs | identity | |
| Apis mellifera | 0.06 | 0.68 | – | 0.63 |
| Takifugu rubripes | 0.09 | 0.84 | – | 0.83 |
| Tetraodon nigroviridis | 0.09 | 0.70 | – | 0.80 |
| Danio rerio | 0.29 | 1.69 | – | 0.94 |
| Anopheles gambiae | 0.33 | 0.94 | – | 0.82 |
| Caenorhabditis remanei | 0.34 | 1.23 | – | 0.90 |
| Drosophila pseudoobscura | 0.34 | 1.62 | – | 0.95 |
| Bos taurus | 0.38 | 0.94 | 0.74 | 0.92 |
| Cryotococcus neoformans | 0.48 | 1.01 | – | 0.96 |
| Caenorhabditis briggsae | 0.48 | 1.13 | 0.48 | 0.94 |
| Mus musculus | 0.49 | 1.00 | – | 0.92 |
| Oryza sativa | 0.63 | 0.75 | – | |
| Entamoeba histolytica | 0.66 | 0.87 | 0.84 | |
| Pan troglodytes | 0.73 | 0.95 | 0.86 | |
| Homo sapiens | 0.75 | 0.94 | 0.75 | |
| Debaryomyces hansenii | 0.82 | 0.99 | – | |
| Drosophila melanogaster | 0.87 | 1.02 | 0.83 | |
| Caenorhibditis elegans | 0.90 | 1.00 | – | |
| Yarrowia lipolytica | 0.90 | 0.99 | – | |
| Canis familiaris | 0.92 | 1.00 | 1.00 | |
| Arabidopsis thaliana | 0.93 | 0.98 | – | |
| Monodelphis domestica | 0.94 | 0.99 | 0.99 | |
| Escherichia coli K12 | 0.96 | 0.98 | – | |
| Kluyveromyces lactis | 0.97 | 0.95 | – | |
| Gasterosteus aculeatus | 0.97 | 1.00 | 1.00 | |
| Candida glabrata | 0.97 | 1.00 | – | |
| Dictyostelium discoideum | 0.97 | 0.99 | 0.89 | |
| Schizosaccharomyces pombe | 0.97 | 1.00 | – | |
| Gallus gallus | 0.98 | 1.00 | 0.99 | |
| Xenopus tropicalis | 0.98 | 0.98 | 1.00 | |
| Ciona intestinalis | 0.99 | 0.99 | 1.00 | |
| Saccharomyces cerevisiae | 1.00 | 1.01 | 1.00 | |
| Rattus norvegicus | 1.00 | 0.97 | 1.00 | |
| Aedes aegypti | 1.00 | 1.00 | 1.00 |
The ‘Identical sequences’ and ‘Identical IDs’ columns show the sequence checksums and gene identifiers common to both versions as a fraction of the version with the lowest number of sequences. Most species have a high fraction of identical sequences; for those <50% the average identity using BLAST (see text) between release 6 and 7 is shown. Of those, only A. mellifera has a low average identity. Thus, although in some species a large fraction of the proteins has been modified, the modifications are generally minor. ‘—’, not applicable due to different identifier systems in the two versions
However, looking at one-way fractions of shared orthologs reveals the problem. The distance ‘to H. sapiens’ was higher for M. mulatta than for all other species in the group. Also, the distance to chimpanzee and to orangutan was highest or second highest for M. mulatta. This indicates that macaque contains a large number of proteins that did not find orthologs in closely related species. It is possible that these are fragments or short splice variants, preventing them from being detected as orthologs. Even if the same splice variant exists in human, it would not be used by InParanoid if a longer variant exists, and the orthology may be lost due to small overlap. It thus seems that the macaque gene annotations should be updated to be more in line with other primates.
One of the orthophylogram anomalies found with InParanoid 6 was that Danio rerio was not grouped with other fishes. This is, however, the case in release 7, although as an outlier of the other fishes, not far from its placement in the previous release. Opossum, which was grouped within placental mammals, is still found in this clade, although in a different place. The orthophylogram is thus a useful tool for identifying inconsistencies in the proteome data and will hopefully spur genome annotators to improve gene predictions.
The average number of inparalogs per cluster ranged from 1.00 (between Cryptosporidium hominis and parvum) to 5.31 (Trichomonas vaginalis when compared with Giardia lamblia, both protozoans). This is in concordance with the early divergence of T. vaginalis and G. lamblia (35) as well as with C. hominis and C. parvum being closely related (36). The overall mean number of inparalogs per species was 1.46, and the median was 1.27. The distribution of cluster sizes is shown in Figure 3.
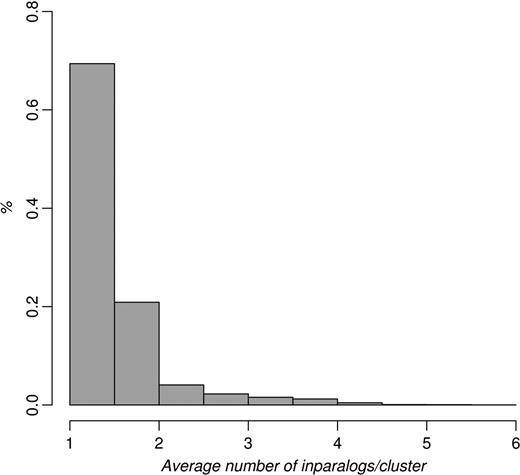
Histogram of the average number of inparalogs/cluster per species for all species–species comparisons in InParanoid 7. Vertebrates and fungi generally have a lower number of inparalogs per clusters—always <3, whereas invertebrates, protists and plants can have as many as five inparalogs/cluster on average.
Proteome consistency
The input sequences used by InParanoid often changes with new releases. This can be due to a change in our sources for the data and/or changes in the genome annotations themselves. As this could result in different orthology assignment between versions, we examined whether each proteome differed with its corresponding proteome used in the previous version. For each species found in both versions, we compared sequences using checksums and identifiers. We computed a checksum for each sequence and counted the fraction of matching checksums between versions. Similarly, we counted the number of identifiers common to both versions. A large change in the number of proteins between versions (due to extensive genome reannotation, for example) could prevent a large fraction of sequences in one version from being matched in the other. We therefore calculated the fractions by dividing the matches with the number of sequences which is lowest between the two versions.
Most proteomes showed a large fraction of shared identical sequences while a minority was drastically changed (Table 1). The source for some species was changed between releases 6 and 7 of InParanoid, while in other cases all identifiers were changed by the source. A comparison of identifiers was therefore not possible in most cases, but where identifiers were comparable the consistency between the versions was generally high (Table 1).
The changes to the proteomes with a low fraction of shared identical sequences could potentially be large enough to affect the orthology assignment. In order to determine if this was the case, we performed whole-proteome BLAST comparisons of the proteomes with a low consistency between versions. Using the version with the fewest sequences as query and the version with the most sequences as database, we computed the average match identity as the number of identical residues in the best HSP divided by the length of the query. The results varied between 63% for A. mellifera to 96% for Cryptococcus neoformans, with most being above 90% (Table 1). These changes should reflect improvements in proteome quality. For example, the A. mellifera proteome previously used has been deprecated and removed from Ensembl, so the orthology assignment in the new version should be more accurate.
FUTURE PERSPECTIVES
Although the InParanoid algorithm is fully automatic, building the latest InParanoid release involved many time consuming manual steps. Perhaps the most challenging task was to gather the proteomes from difference sources in different formats and making sure that the contents are error free and complete. We hope that by the introduction of standardized proteome repositories and usage of robust XML formats much of this labor will be reduced. Much of the workflow in the InParanoid pipeline and web site is now automated using XML. The pairwise nature of the method means that its time complexity scales O(N2). Compute resources may therefore become a problem in the future, which would require more time-efficient algorithms or an incremental updating scheme.
SUPPLEMENTARY DATA
Supplementary Data are available at NAR Online.
ACKNOWLEDGEMENTS
The authors thank Patrik Björkholm for assistance with gathering proteomes and Erik Sjölund for assistance with the web site back-end.
FUNDING
Funding for open access charge: Swedish Research Council.
Conflict of interest statement. None declared.
REFERENCES
Author notes
The authors wish it to be known that, in their opinion, the first two authors should be regarded as joint First Authors.
Present address: Tina Köstler, Center for Integrative Bioinformatics Vienna, Max F. Perutz Laboratories, Dr Bohr Gasse 9, A-1030 Wien, Austria.

Comments