-
PDF
- Split View
-
Views
-
Cite
Cite
Jan O. Andersson, Siv G. E. Andersson, Pseudogenes, Junk DNA, and the Dynamics of Rickettsia Genomes, Molecular Biology and Evolution, Volume 18, Issue 5, May 2001, Pages 829–839, https://doi.org/10.1093/oxfordjournals.molbev.a003864
Close - Share Icon Share
Abstract
Studies of neutrally evolving sequences suggest that differences in eukaryotic genome sizes result from different rates of DNA loss. However, very few pseudogenes have been identified in microbial species, and the processes whereby genes and genomes deteriorate in bacteria remain largely unresolved. The typhus-causing agent, Rickettsia prowazekii, is exceptional in that as much as 24% of its 1.1-Mb genome consists of noncoding DNA and pseudogenes. To test the hypothesis that the noncoding DNA in the R. prowazekii genome represents degraded remnants of ancestral genes, we systematically examined all of the identified pseudogenes and their flanking sequences in three additional Rickettsia species. Consistent with the hypothesis, we observe sequence similarities between genes and pseudogenes in one species and intergenic DNA in another species. We show that the frequencies and average sizes of deletions are larger than insertions in neutrally evolving pseudogene sequences. Our results suggest that inactivated genetic material in the Rickettsia genomes deteriorates spontaneously due to a mutation bias for deletions and that the noncoding sequences represent DNA in the final stages of this degenerative process.
Introduction
It has been suggested that horizontal gene transfers occur continuously in bacteria (Doolittle 1999 ; Jain, Rivera, and Lake 1999 ; Nelson et al. 1999 ). To counteract such a steady inflow of genetic material, reductive evolutionary processes must also occur at high frequencies. However, very little is known about the processes and patterns that result in genome size expansion and degradation in bacteria. One approach to studying the mechanisms that affect genome sizes makes use of pseudogenes or other kinds of selectively unconstrained sequences. For example, studies of nontransposing copies of non-LTR retrotransposable elements in Drosophila and Laupala suggest that differences in genome size in eukaryotes may result from variations in the rate of spontaneous loss of nonessential DNA (Petrov et al. 2000 ). The use of pseudogenes and noncoding DNA in these studies has resulted in reliable estimates of the spontaneous indel mutation patterns in higher organisms.
So far, only a few putative pseudogenes have been identified in bacterial genomes. Inactivated gene sequences have been observed in the genomes of Lactococcus lactis, Mycobacterium leprae, Neisseria sp., and Yersinia pestis (Delorme et al. 1993 ; Godon et al. 1993 ; Simonet et al. 1996 ; Fraser et al. 1997 ; Smith et al. 1997 ; Cole 1998 ; Buchreiser et al. 1999; Zhu, Morelli, and Achtman 1999 ). Plasmids may also contain pseudogenes, as noted in Borrelia burgdorferi, Buchnera aphidicola, and Yersinia pestis (Skurnik and Wolf-Watz 1989 ; Lai, Baumann, and Moran 1996 ; Baumann et al. 1997 ; Feavers and Maiden 1998 ; Perry et al. 1998 ; Van Ham et al. 1999 ; Casjens et al. 2000 ). However, the general scarcity of pseudogene sequences in closely related strains and species has hindered attempts to quantify the patterns and rates of neutral indel mutations in these organisms.
The 1.1-Mb genome of Rickettsia prowazekii is exceptional in that as much as 24% of it represents noncoding DNA and pseudogenes (Andersson et al. 1998 ). Rickettsia are obligate intracellular parasites, normally associated with arthropods but often pathogenic for humans (Raoult and Roux 1997 ; Azad and Beard 1998 ). The typhus group (TG) Rickettsia consist of the etiological agents of epidemic and murine typhus, R. prowazekii and Rickettsia typhi, respectively. Members of spotted fever group (SFG) Rickettsia include the causative agent of Rocky Mountain spotted fever, Rickettsia rickettsii, and Rickettsia montana, a species with an unknown pathology (Raoult and Roux 1997 ).
We have previously shown that one of the R. prowazekii pseudogenes, metK, is accumulating random mutations as expected for unconstrained, neutrally evolving DNA sequences (Andersson and Andersson 1999a, 1999b ). The ancestral metK gene sequence was partially reconstructed by the elimination of sites with frameshift mutations and stop codons. By superimposing modern metK pseudogene sequences onto the ancestral metK gene sequence, the indel mutation profile of inactivated genetic material in Rickettsia could be determined. We found that deletions predominated over insertions and that there was a strong mutation bias toward AT base pairs. A second pseudogene downstream of the metK gene showed a similar pattern of neutral sequence changes (Andersson and Andersson 1999a ).
In the present study, we systematically analyzed the regions surrounding all of the R. prowazekii pseudogenes in three representative species of the genus Rickettsia. We present examples of genes in different stages of degradation, and we demonstrate that sequences classified as noncoding DNA in R. prowazekii represent remnants of ancestral genes that are degraded to such an extent that they are no longer recognized as genes in single-genome analyses.
Materials and Methods
DNA Isolation, Amplification, and Sequencing
Genomic DNAs from R. prowazekii strain B, R. typhi strain Wilmington, R. rickettsii strain 84-21C, and R. montana, which were generous gifts from N. Balayeva, A. Azad, and D. Stothard, were prepared as previously described (Pretzman et al. 1987 ). The genomic regions were amplified by PCR in a two-step process. First, degenerate primer pairs were designed against the conserved regions of the genes located at the two ends of each region to be sequenced (data not shown). PCR reactions were performed with genomic DNAs from R. typhi, R. rickettsii, and R. montana as templates using the AmpliTaq Gold enzyme (Perkin-Elmer) with buffer conditions according to the manufacturer. The cycling conditions were as follows: 95°C for 10 min, followed by 35 cycles of 94°C for 1 min, 50°C for 30 s, and 72°C for 1 min, followed by 72°C for 10 min. The amplified 500-bp products were purified using the QIAquick PCR Purification Kit (Qiagen, and sequenced using the ABI PRISM BigDye Terminator Cycle Sequencing Kit (Perkin-Elmer). The sequencing reactions were analyzed on an ABI PRISM 377 DNA Sequencer (Perkin-Elmer).
The sequences obtained from the PCR products were used to design specific primers for each species, which were then used in long-range PCR to amplify the whole region of interest in a single step. The GeneAmp XL PCR kit (Perkin-Elmer), with buffer and cycling conditions according to the manufacturer, were used to perform long-range PCR with genomic DNA as templates. The long-range PCR products were purified as described. Both strands of several independently amplified PCR products were sequenced with the primer-walking method. In the cases in which the long-range PCR reactions failed, we designed degenerate primer pairs against a conserved gene in the middle of the region which was used as a bridge in the PCR reactions. Based on this approach, we successfully amplified all regions covering the R. prowazekii pseudogenes.
Definition of Genes, Pseudogenes, and Fossil-ORFs
Open reading frames (ORFs) were considered genes if they had a codon usage pattern compatible with Rickettsia genes (Andersson and Sharp 1996 ) and showed a significant database hit, or were longer than 100 amino acids, or were longer than 50 amino acids and conserved between at least two species in the data set. Sequences with database matches to a functional gene but spanning more than one ORF were considered pseudogenes. A set of partially overlapping short ORFs with sequence similarities to a hypothetical protein and/or to another set of short ORFs in the data set were designated as fossil-ORFs (forf). The 5′ end of the fossil-ORFs was located to the first conserved initiation codon, and the 3′ end was located to the first conserved termination codon. If a region with one or more partial ORFs continued after a termination codon was reached but no initiation codon could be identified for the downstream ORF, the length of the fossil-ORF was expanded to the termination codon of the downstream ORF.
Reconstruction of Ancestral Gene Sequences
For the purposes of this analysis, the pseudogenes were corrected for frameshift errors to produce a hypothetical translatable gene sequence. The nucleotide sequence of the pseudogene was aligned to a homologous copy of a nondisrupted gene within the data set. All insertions and all codons affected by deletions were removed from the sequence. If a complete copy of the gene sequence was not available within the data set, the amino acid sequence of a functional homolog from another bacterium was used as a guide for correcting the pseudogene sequence.
The forfs were corrected for frameshift errors to produce a hypothetical ancestral gene sequence using the following criteria: (1) In alignments with size differences, deletions or insertions were inferred so that the ORF was retained. (2) In alignments with a termination codon in one species and a sense codon in another species, the sense codon was used. (3) In alignments with a conserved termination codon within the defined forfs, the frameshift error was putatively located between the termination codon of the upstream correct reading frame and the nearest termination codon in the downstream correct reading frame.
Analysis of Genes, Pseudogenes, and Fossil-ORFs

The rate at which a pseudogene gradually decays was calculated using a continuous decay formula L = L0e−rt (Petrov and Hartl 1997, 1998 ). Here, L is the length of the modern gene, L0 is the length of the ancestral gene, and rt is the frequency of deletions per nucleotide. The ratio of deletions to nucleotide substitutions was estimated to be 0.18, and the average size of deletions was estimated to be 68.2 nt per event (Andersson and Andersson 1999a ). The frequency of substitutions at synonymous sites since the divergence of the ancestral species at the TG-SFG node was estimated to be 0.19 substitutions per nucleotide (see above).
Results
Amplification of Pseudogene Sequences in Rickettsia
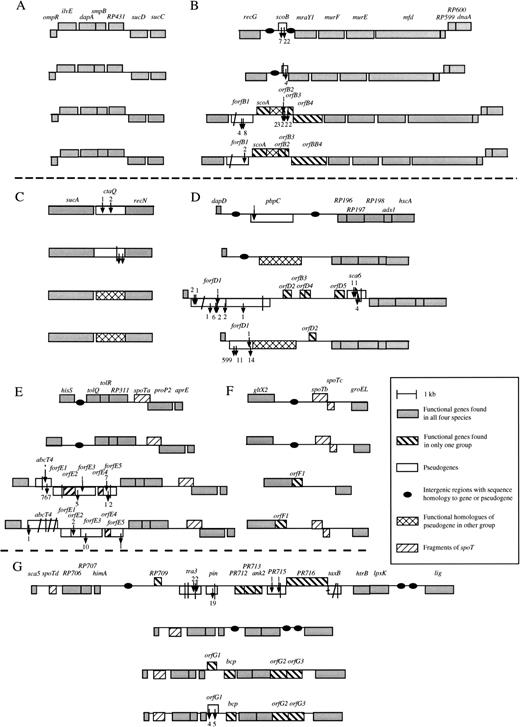
The R. prowazekii genome contains 12 sequences considered pseudogenes (Andersson et al. 1998 ), one of which (metK) has already been extensively analyzed (Andersson and Andersson 1999a ). In order to study the process of gene inactivation in a systematic manner, we here examined six genomic segments that covered all of the remaining pseudogenes in the R. prowazekii genome (fig. 1 ). The homologous genomic segments were amplified in R. typhi, another member of the TG, as well as in R. rickettsii and R. montana, two members of the SFG. Internal segments of conserved genes flanking the pseudogenes were first amplified by PCR with the use of degenerate primers. The unique sequences obtained from these genes were then used to design a set of species-specific primers that were used in long-range PCR to amplify the entire segments spanning the pseudogenes. For comparative purposes, we also amplified a segment in which no pseudogenes were identified in the R. prowazekii genome (fig. 1A ).
The sizes of the seven segments ranged from 56.1 kb in R. typhi to 68.8 kb in R. prowazekii (table 1 ). The overall G+C content values of these regions were 29% in the TG and 32%–33% in the SFG (table 1 ), which is in accordance with previous estimates (Andersson and Sharp 1996 ; Andersson et al. 1998 ; Andersson and Andersson 1999b ). The coding content ranged from 58.3% in R. prowazekii to 71.4% in R. montana (table 1 ). The exceptionally low coding content values are explained by the presence of a significant fraction of pseudogenes (from 3.0% in R. typhi to 14.2% in R. rickettsii) and noncoding DNA (from 17.8% in R. montana to 31.1% in R. prowazekii) (table 1 ).
We identified a total of 54 gene and pseudogene sequences in R. prowazekii, 43 of which had homologs in R. typhi, R. rickettsii, and R. montana. We also identified 17 genes that were represented by a pseudogene in one or more lineages, as well as another 17 genes that were uniquely present in either the TG or the SFG (table 2 ).
Description of Pseudogene Sequences in the TG Rickettsia
A closer examination of the amplified regions showed that 3 of the 12 annotated R. prowazekii pseudogenes (scoB, pbpC, and ctaQ) are represented by pseudogenes in one other species and by undisrupted ORFs in the other two species (fig. 1B–D ). As many as 4 of the 12 pseudogenes in the R. prowazekii genome (tra3, pin, RP715, and taxB) were absent from R. typhi, R. montana, and R. rickettsii (fig. 1G ). The initial set of sequences annotated as pseudogenes in R. prowazekii also included four highly truncated sequence copies (spoTa-d) with similarities to the spoT/relA genes, which are involved in the synthesis and hydrolysis of (p)ppGpp during the stringent response. These fragments were associated with complex patterns of changes in the other three lineages (fig. 1E–G ).
The truncated spoTa and spoTd genes encode short peptides that correspond to the first third and middle region of the SpoT protein. The sizes of the spoTa genes were highly conserved in all Rickettsia species analyzed here (fig. 1E ), whereas the spoTd gene showed a >twofold heterogeneity in size (fig. 1G ). The shortest version of spoTd, the one from R. prowazekii, lacked an initiation codon at the expected initiation site.
The spoTb and spoTc genes also represent truncated versions of the spoT gene. These two pseudogenes are located on different strands in the R. prowazekii genome, with the 3′ ends heading each other (fig. 1F ). This organization is also seen in R. typhi and R. montana. However, the spoTb gene is even further truncated by 105 amino acids at the 3′ end in R. montana, and no conventional initiation codon can be found upstream of the spoTc gene in this species. Finally, no sequences with similarities to spoTb and spoTc could be identified in R. rickettsii (fig. 1F ).
The short and variable sizes and the lack of initiation codons in the spoT gene fragments suggest that these are most likely not functional. However, it cannot be excluded that some of the spoT gene fragments may still retain some functional activity. For example, the pairwise combinations of the truncated spoT genes in Rickettsia yielded two putative peptides which roughly corresponded to the N-terminal catalytic domain (Gentry and Cashel 1996 ; Martinez-Costa, Fernandez-Moreno, and Malpartida 1998 ). A phylogenetic analysis of the combined amino acid sequences encoded by the spoTa/spoTd and spoTb/spoTc genes suggests that the four spoT gene fragments may be derived from two genes that duplicated long before the split of the TG and the SFG (data not shown).
Description of Pseudogene Sequences in the SFG Rickettsia
For as many as 18 homologous gene pairs in R. rickettsii and R. montana, no homologs could be identified in R. prowazekii and R. typhi (table 2 ). Half of the sequence pairs showed no signs of inactivation or degradation in the SFG (fig. 1 and table 2 ), whereas one third were represented by pseudogenes in R. rickettsii, as well as in R. montana. One of these displayed sequence similarity to an ABC-transporter (abcT4), while the other five had no homologs in the public databases (forfB1, forfD1, forfE1, forfE3, and forfE5) (fig. 1B, D, and E ). Finally, one sixth of the sequence pairs were represented by a pseudogenes in one lineage and an undisrupted ORF in the other lineage (orfB2, orfE2, and orfG1) (fig. 1B, E, and G ), none of which had homologs in other bacterial species.
In addition, four gene and pseudogene sequences (orfD3, orfD4, orfD5, and sca6) were uniquely present in R. rickettsii (fig. 1D ), one of which showed sequence similarity to a cell surface antigen of R. prowazekii (sca6). However, this region also contained several shorter ORFs that showed the expected codon-specific variation in nucleotide frequency statistics but lacked putative initiation codons. One or more fossil-ORFs are probably also present in this region, although this cannot be confirmed at present, since no comparative sequence data are available. In total, 11 novel pseudogene sequences were identified in the SFG; 10 of these were uniquely present in either R. rickettsii or R. montana. However, some of the neighboring sequences that we have classified here as unique ORFs or pseudogenes, such as, for example, orfD2–D5 and forfE1–E5, may be degraded remnants of one and the same ancestral gene sequence.
Nucleotide Frequencies in Pseudogene Sequences
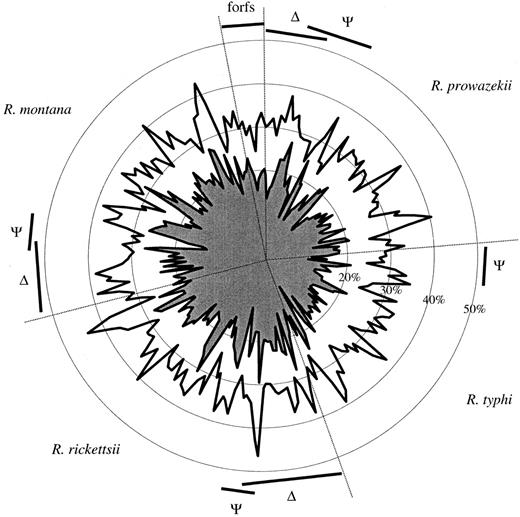
The overall G+C content values of the amplified sequence fragments were 29% in the TG and 32%–33% in the SFG (table 1 ), in accord with previous estimates (Andersson et al. 1998 ; Andersson and Andersson 1999a ). The G+C content values (GCc) and the G+C content values at third codon positions (GC3s) for all genes and pseudogenes described in this study are schematically shown in figure 2 . Here, it can be seen that the GCc values were consistently higher than the GC3s values for all genes and reconstructed ancestral genes, as expected for Rickettsia genes that are well equilibrated with the overall mutation bias (Andersson and Sharp 1996 ; Andersson and Andersson 1999a ). Furthermore, no differences were observed for genes that were unique to one of the two groups versus those that were present in all four species. However, the GC3s values were significantly different for sequences derived from the two groups: 16.3% in the TG and 21.0% in the SFG, on average. This suggests that the direction and/or magnitude of the mutation pressure have been slightly different for the two groups since their divergence from a common ancestor. However, the similarity between the nucleotide frequency patterns of the active genes and the reconstructed pseudogenes argues against the interpretation that the pseudogenes represent recent horizontal transfers from other bacteria.
Timing of the Inactivation Events
If the inactivation of the pseudogenes occurred prior to the divergence of the TG and the SFG, we would expect frequencies of nucleotide substitutions at nonsynonymous sites (Ka) to approach those at synonymous sites (Ks). The average Ks value for genes analyzed in this study was 0.37 (minimum, 0.15; maximum, 0.60) in comparisons across the TG and the SFG. The corresponding Ka value is 0.08 on average (minimum, 0.02; maximum, 0.20). For two pseudogenes, ctaQ and pbpC, we observed higher substitution frequencies at synonymous than at nonsynonymous sites (Ka = 0.10, 0.13; Ks = 0.38, 0.40). This indicates that selection has acted on these genes for at least some time since their divergence. Indeed, short deletion/insertion mutations were identified in the ctaQ gene of R. prowazekii and R. typhi, whereas no such mutations could be identified in R. rickettsii and R. montana. A more detailed inspection of the ctaQ genes of R. prowazekii and R. typhi showed that the Ka value was approaching the Ks value, as expected for neutralized sequences (Ka = 0.12; Ks = 0.16). The ctaQ gene was presumably inactivated subsequent to the divergence of the TG and the SFG but prior to the divergence of R. prowazekii and R. typhi. The pbpC gene was disrupted in two species (R. prowazekii and R. rickettsii) but seemingly complete in the other two species (R. typhi and R. montana). Again, the inactivation event probably occurred subsequent to the separation of the TG and the SFG.
The fixation rates for mutations in the spoT gene fragments were also higher at synonymous sites than at sites causing amino acid replacements, as would be expected for functional genes. The Ka values were 0.03, 0.06, 0.06, and 0.12 for spoTa, spoTb, spoTc, and spoTd, respectively, whereas the corresponding Ks values were 0.28, 0.22, 0.15, and 0.25, respectively. However, the spoT genes were highly fragmented, not conserved in length (spoTb and spoTd) and/or absent from one species (spoTb and spoTc). This makes it unlikely that the spoT gene fragments are currently subjected to strong selective constraints, although it cannot be excluded that some functional activity has been retained for some fragments in some lineages. For example, the size of spoTa is conserved among all species. The final clues to the mysterious presence of the spoT gene fragments will have to await further experimental analyses.
Insertion/Deletion Profiles in Pseudogene Sequences
To reconstruct the patterns of degradation, we aligned the nucleotide sequences of 26 pseudogenes with their functional orthologs in the other species. In total, we inferred that as many as 1,536 nt had been deleted, whereas only 31 nt had been inserted into these genes since they were inactivated (table 3 ). However, most deletions were small in size, and the large number of nucleotides affected was mainly due to two large deletions of 599 bp (forfD1 in R. montana) and 767 bp (abcT4 in R. rickettsii) (fig. 1 ). The median and mean sizes of deletions were estimated to be 4 and 51.2 nt per event, whereas the median and mean sizes of insertions were estimated to 1 and 1.6 nt per event (table 3 ). The bias for deletion mutations implies that inactivated genes will be eliminated from the Rickettsia genomes solely through a series of mutational events.
Noncoding DNA Represents Extensively Degraded Genes
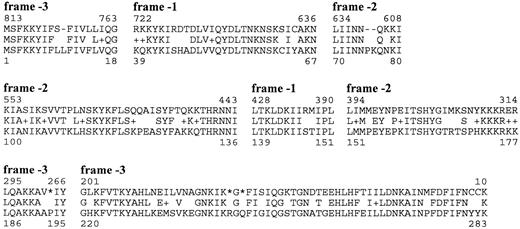
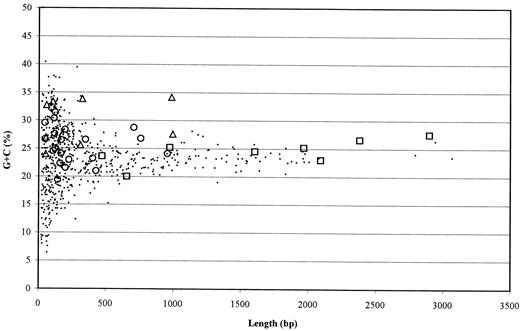
If we assume that genes have been inactivated continuously since the divergence of the TG and the SFG, we expect some genes to have been degraded to such an extent that they are no longer recognizable as pseudogenes. Indeed, we found several examples of weak but significant sequence similarities between unique genes in one species and intergenic regions located at the corresponding sites in other lineages (fig. 1 and table 2 ). For example, the forfD1 pseudogene sequence, which is located in between dapD and pbpC in the SFG gave a hit to the intergenic region of dapD and pbpC in the TG (E < 1e−10). Similarly, many short stretches of sequences in the lpxK-lig intergenic region of R. prowazekii showed similarities to the orfG2 and orfG3 gene sequences that are located between lpxK and lig in the SFG (fig. 3 ). A summary of the intergenic regions in R. prowazekii that have been associated with genes or pseudogene sequences in the SFG is presented in figure 4 . These results confirm that the noncoding DNA in R. prowazekii represents highly fragmented remnants of ancestral gene sequences.
Discussion
The size and coding content of a bacterial genome reflects the balance between the inflow and outflow of genetic material (Andersson and Andersson 1999b ). How much of each process can be detected in a genome at any given time depends on the rates of horizontal gene transfer events versus the rates of gene inactivation and elimination (Andersson and Andersson 1999b ). Because inactivated gene sequences accumulate mutations in a random manner, they also provide insights into the process of neutral sequence evolution in bacteria. For example, the gradual process of gene inactivation, degradation, and elimination described in this and a previous paper (Andersson and Andersson 1999a ) provides data for correlating rates and stability of mutations that affect base composition patterns and insertion/deletion profiles. Comparative analyses of rickettsial genomes, therefore, provide an outstanding opportunity to study key features of degenerative processes as well as neutral sequence evolution.
We can think of two alternative ways to explain the existence of genes that are uniquely present in a few closely related species but not in their neighbors. Such genes may have been either introduced recently by lateral gene transfer to the former set of species, or lost from the other set of lineages. Recent horizontal gene transfers can in principle be distinguished from differential gene losses by an analysis of how well the unique genes are equilibrated with the base composition patterns of the genomes in which they reside (Lawrence and Ochman 1998 ). However, the interpretation of the results obtained from such an analysis requires information about the direction of the mutation pressure and the nucleotide frequencies at equilibrium. Great caution should therefore be taken when trying to infer the presence or absence of horizontal gene transfers based solely on nucleotide composition patterns.
However, nucleotide frequency patterns are well characterized for genes in Rickettsia (Andersson and Sharp 1996 ; Andersson and Andersson 1997, 1999a; Andersson et al. 1998 ). The G+C content values at synonymous third codon positions for the genes analyzed in this study range from 16.3% in the TG to 21.0% in the SFG. We have previously shown that transitions from a GC pair to an AT pair are almost fivefold higher than those from AT to GC in the SFG, and we have estimated the G+C content for members of the SFG to be around 25% at equilibrium (Andersson and Andersson 1999a ). Thus, we have, in principle, all the information required for quantifying how fast the base composition patterns of a foreign gene will change upon incorporation into a rickettsial genome.
To get a first rough estimate of these parameters, we examined the extent to which G+C content values at silent sites would be reduced in an extreme situation in which the G+C content at equilibrium would be as low as 0%. It can be calculated (Lawrence and Ochman 1997 ) that a maximally expressed A+T mutation bias would drive the G+C content at silent sites from values of 30%, 40%, and 50% in the common ancestor to values of 25%, 33%, and 42% in the modern lineages. This estimation is based on a transition/transversion ratio of 3 for neutral substitutions in Rickettsia (Andersson and Andersson 1999a ) and a distance of 0.19 (this study) to the node at which the TG and SFG diverged. Thus, even under such an extreme mutation bias, a recently introduced gene with an initial G+C content above 30% would easily be identified as an outlier in the modern genomes.
This suggests that the identified unique genes and pseudogenes, all of which have G+C content values below 30% at silent sites (fig. 2 ), have resided in the Rickettsia genomes since long before the divergence of the TG and the SFG. Accordingly, we favor the interpretation that the genes uniquely present in a single species or in a few species have been lost from the other genomes. Indeed, we have ample evidence for extensive recent gene loss in Rickettsia. For example, all of the 11 R. prowazekii pseudogenes analyzed in this study were found to be represented by pseudogenes, gene fragments, and/or lost genes in the three other Rickettsia lineages. In addition, 10 novel pseudogenes were detected in R. rickettsii and R. montana, making up a total of 21 sequences represented by a pseudogene copy in one or more Rickettsia species (fig. 1 and table 2 ).
In this analysis (table 3 ), as well as in an earlier study (Andersson and Andersson 1999a ), we have shown that deletions predominate over insertions with respect to frequencies as well as numbers of nucleotides affected per event. Likewise, higher frequencies of deletions than of insertions have been observed in Drosophila as well as in mammals (Graur, Shuali, and Li 1989 ; Petrov, Lozovskaya, and Hartl 1996 ; Petrov and Hartl 1998 ). The overall ratios of deletions to insertions have been estimated to be 3.3 for Rickettsia, 4.7 for mammals, and 8.7 for Drosophila (Andersson 1999 ). The differences should be taken with caution, since they have been inferred from too small a number of events to be statistically significant. Nevertheless, these estimates show that a continuous turnover of genetic material is to be expected in all of these species.
How long an inactivated gene will be present as a pseudogene or as a stretch of noncoding DNA depends on the rates and biases of insertion versus deletion mutations (Andersson and Andersson 1999b ). The rate of decay for rickettsial pseudogenes can be estimated using a continuous decay formula (Petrov and Hartl 1997, 1998 ). In an earlier study, we determined the ratio of deletions to nucleotide substitutions as 0.18 and the average size of deletions as 68.2 nt per event in the SFG Rickettsia (Andersson and Andersson 1999a ). Thus, it can be estimated that a gene that was inactivated at the time of divergence between the TG and the SFG should have decreased in size to 10% of its original gene length on average. This estimate is based on an average distance value of 0.19 between the modern species and the TG-SFG node (this study). Indeed, we have found examples of gene sequences that are so extensively degraded that their ancestral gene status can only be inferred by sequence comparisons of closely related species (table 1 and figs. 3 and 4 ).
By extrapolating from these results, it can be assumed that most of the 159 intergenic regions longer than 500 bp in the R. prowazekii genome represent short fragments of old genes in their final stage of decay. However, similarities between sequences classified as noncoding in both the TG and the SFG were only rarely detected. One such unusually well conserved region was found upstream of sca6, which may be explained by the presence of conserved regulatory functions. Sequence similarities were also detected for approximately half of the intergenic regions of R. rickettsii and R. montana. These were due to short dispersed imperfect repeated sequences of a typical length of 30 bp, often in the form of inverted repeats (data not shown). However, no repeated sequences could be detected in the TG, in accordance with previous studies (Andersson and Andersson 1999a ).
It has previously been suggested that identical deletion mutations have arisen independently in phage T7 as a result of selection (Cunningham et al. 1997 ). No examples of shared deletion events were detected in this study, although such events have been noted in a previous analysis of the metK pseudogenes in Rickettsia (Andersson and Andersson 1999a, 1999b ). However, the identical deletions in the metK pseudogenes are most likely the result of speciation rather than parallel evolution, since they were associated with recently diverging pairs of taxa (Andersson and Andersson 1999a, 1999b ). The heterogeneity in the sizes of the pseudogene sequences analyzed in this study suggests that the deletion process occurs in a random manner, rather than being driven by selection for a subset of deletion events.
Why can an intracellular parasite like Rickettsia afford to lose genes at such a seemingly high rate? One explanation may reside in its ability to exploit host cell metabolites. This will cause reduced levels of purifying selection on a large number of genes involved in the biosynthesis of various metabolites. Indeed, we have earlier speculated that the inactivation of the metK gene, coding for AdoMet synthetase, was catalyzed by the invention of an AdoMet import system (Andersson and Andersson 1999a, 1999b ). Similarly, the loss of amino acid and nucleotide biosynthetic genes may be explained by the presence of transport systems for amino acids and nucleoside monophosphates (Andersson et al. 1998 ; Zomorodipour and Andersson 1999 ).
Another explanation may be that the intracellular specialists do not need the entire battery of regulatory functions that the generalists require in order to be able to quickly respond to shifts in nutrient conditions (Andersson and Kurland 1998 ). For example, the full-length spoT genes may previously have served an important role during starvation periods but may no longer be required for survival in the rich intracellular milieu. These degenerative processes may be further accelerated by the so-called Muller's ratchet (Muller 1964 ), which postulates that the fixation rates for slightly deleterious mutations may increase in small populations that undergo recurrent bottlenecks (Felsenstein 1974 ; Moran 1996 ; Andersson and Kurland 1998 ). It can also not be excluded that a reduced genome size per se confers a selective advantage on organisms that replicate within the cytoplasm of a eukaryotic host cell (Andersson and Kurland 1995, 1998).
Taken together, our analysis provides strong evidence for a reductive mode of evolution in obligate intracellular parasites with high rates of DNA loss. Such a process may have drastic effects on the lifestyle of an organism. For example, extensive gene loss may push an organism into dependence to such an extent that the ability to return to a free-living lifestyle is lost. Much has previously been said about the importance of communities and horizontal gene transfer events in the evolutionary history of bacteria (Doolittle 1999 ). However, gene degradation and elimination may be balancing these processes by promoting adaptation to restricted environments, isolation, and speciation. As we have shown in this study, these degenerative processes are intimately linked to the dynamics of noncoding DNA.
Supplementary Material
The EMBL accession numbers for the sequences reported in this paper are AJ293310–AJ293330.
Julian Adams, Reviewing Editor
Present address: Department of Biochemistry and Molecular Biology, Dalhousie University, Halifax, Nova Scotia, Canada.
Keywords: genome degradation molecular evolution noncoding DNA pseudogenes Rickettsia
Address for correspondence and reprints: Siv Andersson, Department of Molecular Evolution, Evolutionary Biology Center, Norbyvägen 18C, 752 36 Uppsala, Sweden. siv.andersson@ebc.uu.se.
Table 1 Sizes, Nucleotide Frequencies, Coding Fractions, and Substitution Frequencies of the Amplified Pseudogene Fragments in Four Rickettsia Species
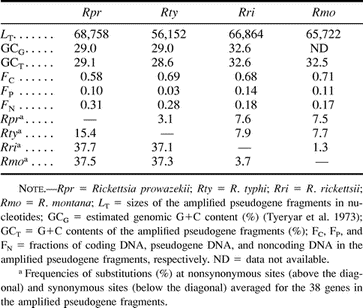
Table 1 Sizes, Nucleotide Frequencies, Coding Fractions, and Substitution Frequencies of the Amplified Pseudogene Fragments in Four Rickettsia Species

Table 2 Gene Status and Database Matches for Pseudogenes, Fossil-ORFs, and Genes Unique to the TG or the SFG
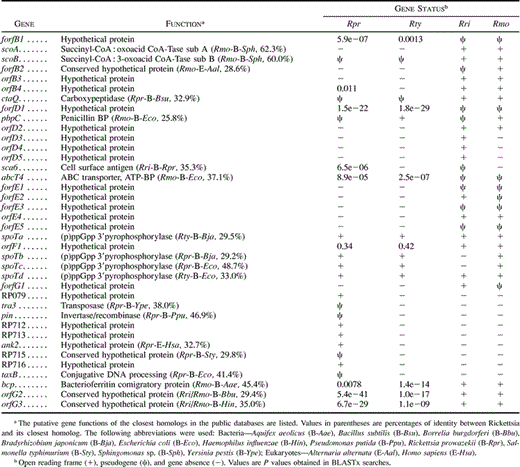
Table 2 Gene Status and Database Matches for Pseudogenes, Fossil-ORFs, and Genes Unique to the TG or the SFG

Table 3 Pseudogenes: Frequencies of Insertions and Deletions in Four Rickettsia Species
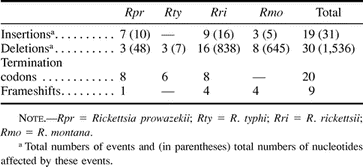
Table 3 Pseudogenes: Frequencies of Insertions and Deletions in Four Rickettsia Species

Fig. 1.—Schematic representation of genes, pseudogenes, fossil-ORFs, and intergenic regions in Rickettsia species. The fragments represent (A) a region with no pseudogenes and (B–G) regions containing pseudogenes. The fragments contain the R. prowazekii pseudogenes scoB (B), ctaQ (C), pbpC (D), spoTa (E), spoTb (F), and tra3, pin, and taxB (G). The organisms are, from top to bottom, R. prowazekii, R, typhi, R. rickettsii, and R. montana. Arrows pointing into boxes indicate sites of insertions, and arrows pointing out of boxes indicate sites of deletions. Numbers next to the arrows represent the estimated sizes of the deletions and insertions in base pairs. Diagonal lines through the boxes indicate sites of frameshifts for which the exact position of the frameshift event could not be determined. Vertical lines through the boxes indicate sites of in-frame termination codons. Horizontal lines through the ends of boxes indicate that a large part of the homologous gene is missing and/or that a proper initiation codon could not be identified
Fig. 2.—Schematic illustration of base composition patterns in genes and reconstructed pseudogenes. The outer circle shows the overall G+C content (GCc), and the inner circle shows the G+C content at third codon synonymous sites (GC3s) for all genes, unique genes (triangles), and sequences which have been reconstructed from pseudogenes (ψ) and fossil-ORFs (forfs)
Fig. 3.—Alignment of the putative gene product of orfG2 from Rickettsia rickettsii with the most similar protein fragments derived from the lpxK-lig intergenic region of Rickettsia prowazekii by translation of the nucleotide sequence in all possible reading frames. The numbering refers to amino acid positions in the gene product of orfG2 (lower lines) and to nucleotide positions in the intergenic regions (upper lines). Stars indicate termination codons
Fig. 4.—G+C content in intergenic regions longer than 20 bp in the Rickettsia prowazekii genome. Open markers represent the intergenic regions analyzed in this study. Rectangles represent intergenic regions in R. prowazekii with sequence similarities to genes or pseudogenes in the other Rickettsia species. Circles represent intergenic regions in R. prowazekii that also correspond to intergenic regions in the other Rickettsia species but for which no sequence similarities among species could be identified. Triangles represent intergenic regions in R. prowazekii that are absent in the other Rickettsia species
We thank Charles Kurland for support and stimulating discussions. This work was financed by the Foundation for Strategic Research, the Natural Science Research Council, and the Knut and Alice Wallenberg Foundation.
literature cited
Altschul, S. F., T. L. Madden, A. A. Schaffer, J. Zhang, Z. Zhang, W. Miller, and D. J. Lipman.
Andersson, J. O.
Andersson, J. O., and S. G. E. Andersson.
———. 1999b. Insights into the evolutionary process of genome degradation. Curr. Opin. Genet. Dev. 9:664–671.
Andersson, S. G. E., and C. G. Kurland.
Andersson, S. G. E., and P. M. Sharp.
Andersson, S. G. E., A. Zomorodipour, J. O. Andersson, T. Sicheritz-Pontèn, U. C. M. Alsmark, R. M. Podowski, A. K. Näslund, A.-S. Eriksson, H. H. Winkler, and C. G. Kurland.
Azad, A. F., and C. B. Beard.
Baumann, L., M. A. Clark, D. Rouhbakhsh, P. Baumann, N. A. Moran, and D. J. Voegtlin.
Buchrieser, C., C. Rusniok, L. Frangeul, E. Couve, A. Billault, F. Kunst, E. Carniel, and P. Glaser.
Casjens, S., N. Palmer, R. van Vugt (14 co-authors).
Cunningham, C. W., K. Jeng, J. Husti, M. Badgett, I. J. Molineux, D. M. Hillis, and J. J. Bull.
Delorme, C., J. J. Godon, S. D. Ehrlich, and P. Renault.
Feavers, I. M., and M. C. Maiden.
Fraser, C. M., S. Casjens, W. M. Huang et al. (38 co-authors).
Galtier, N., M. Gouy, and C. Gautier.
Gentry, D. R., and M. Cashel.
Godon, J. J., C. Delorme, J. Bardowski, M. C. Chopin, S. D. Ehrlich, and P. Renault.
Graur, D., Y. Shuali, and W. H. Li.
Jain, R., M. C. Rivera, and J. A. Lake.
Lai, C. Y., P. Baumann, and N. Moran.
Lawrence, J. G., and H. Ochman.
———.
Li, W.-H.
Lloyd, A. T., and P. M. Sharp.
Martinez-Costa, O. H., M. A. Fernandez-Moreno, and F. Malpartida.
Moran, N. A.
Nelson, K. E., R. E. Clayton, S. R. Gill et al. (24 co-authors).
Perry, R. D., S. C. Straley, J. D. Fetherston, D. J. Rose, J. Gregor, and F. R. Blattner.
Petrov, D. A., and D. L. Hartl.
———.
Petrov, D. A., E. R. Lozovskaya, and D. L. Hartl.
Petrov, D. A., T. A. Sangster, J. S. Johnston, D. L. Hartl, and K. L. Shaw.
Pretzman, C. I., Y. Rikisha, D. Ralph, J. C. Gordon, and S. Bech-Nielsen.
Raoult, D., and V. Roux.
Simonet, M., B. Riot, N. Fortineau, and P. Berche.
Skurnik, M., and H. Wolf-Watz.
Smith, D. R., P. Richterich, M. Rubenfield et al. (24 co-authors).
Thompson, J. D., D. G. Higgins, and T. J. Gibson.
Tyeryar, F. J. J., E. Weiss, D. B. Millar, F. M. Bozeman, and R. A. Ormsbee.
Van Ham, R. C., H. J., Martinez-Torres, D. Moya, and A. Latorre.
Zhu, P., G. Morelli, and M. Achtman.


