


Abstract
Through a single genetic transformation in onion (Allium cepa), a crop recalcitrant to genetic transformation, we suppressed the lachrymatory factor synthase gene using RNA interference silencing in six plants. This reduced lachrymatory synthase activity by up to 1,544-fold, so that when wounded the onions produced significantly reduced levels of tear-inducing lachrymatory factor. We then confirmed, through a novel colorimetric assay, that this silencing had shifted the trans-S-1-propenyl-l-cysteine sulfoxide breakdown pathway so that more 1-propenyl sulfenic acid was converted into di-1-propenyl thiosulfinate. A consequence of this raised thiosulfinate level was a marked increase in the downstream production of a nonenzymatically produced zwiebelane isomer and other volatile sulfur compounds, di-1-propenyl disulfide and 2-mercapto-3,4-dimethyl-2,3-dihydrothiophene, which had previously been reported in trace amounts or had not been detected in onion. The consequences of this dramatic simultaneous down- and up-regulation of secondary sulfur products on the health and flavor attributes of the onion are discussed.
Allium species synthesize a unique set of secondary sulfur metabolites derived from Cys. Most notable are the S-alk(en)yl-l-Cys sulfoxides, including S-2-propenyl-l-cysteine sulfoxide (alliin; 2-PRENCSO) and trans-S-1-propenyl-l-cysteine sulfoxide (isoalliin; 1-PRENCSO; Rose et al., 2005). When the tissues of any Allium species are disrupted, these amino acid derivatives are cleaved by the enzyme alliinase (EC 4.4.1.4) into their corresponding sulfenic acids, and volatile sulfur compounds are produced that give the characteristic flavor and bioactivity of the species. In garlic (Allium sativum), 2-PRENCSO is the major sulfoxide (Fritsch and Keusgen, 2006), and this produces di-2-propenyl thiosulfinate (allicin) upon tissue disruption. The decomposition product of allicin, di-2-propenyl disulfide, is the dominant volatile component liberated (Block et al., 1992a, 1992b; Rose et al., 2005). In onion (Allium cepa), 1-PRENCSO is the major sulfoxide (Fritsch and Keusgen, 2006). This would be predicted to produce di-1-propenyl thiosulfinate and di-1-propenyl disulfide. However, di-1-propenyl thiosulfinate has never been reported in onion, and di-1- propenyl disulfide has only tentatively been reported in trace amounts (Boelens et al., 1971). Instead, propanthial S-oxide (lachrymatory factor [LF]), 1-propenyl methane thiosulfinate, and di-propyl disulfide are dominant (Block et al., 1992a, 1992b; Rose et al., 2005). LF is a critical practical point of difference between onion and garlic. It is the chemical responsible for inducing tearing in onion, an undesirable irritant, and it is hypothesized that LF production causes the absence of otherwise predicted sulfur volatiles (Randle and Lancaster, 2002), analogues of which in garlic are known for their health attributes (Griffiths et al., 2002).
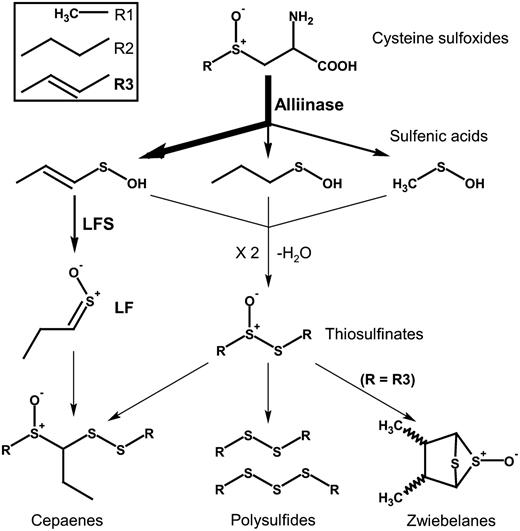
The main sulfur pathway following tissue disruption in onion.
Onion is a very difficult biological system to work with; it has a large genome, is heterozygous, has a slow generation time, and has a poor capacity for manipulation (Eady, 2002; Eady and Hunger, 2008). However, Allium is a genus with a unique, complex, and important secondary sulfur pathway that has no model counterpart. Current “tearless” onion cultivars (e.g. ‘Vidalia’) are achieved through deficient uptake and partitioning of sulfur and/or growth in sulfur-deficient soils, but in so doing they accumulate fewer secondary sulfur compounds in the bulb (Randle and Lancaster, 2002), reducing their sensory and health qualities compared with more pungent high-sulfur cultivars. In this research, we set out to genetically manipulate the sulfur secondary metabolite pathway of onion using RNAi. Unlike previous research aiming to overregulate or underregulate a particular enzyme within a secondary pathway to either increase consumer-desirable compounds (Davuluri et al., 2005) or remove deleterious ones (Capell and Christou, 2004; Sunilkumar et al., 2006), we aimed to achieve both. By reducing LFS and stopping the conversion of 1-propenyl sulfenic acid to the undesirable LF, we tested the hypothesis that this would allow 1-propenyl sulfenic acid to be available for spontaneous conversion into thiosulfinate and thiosulfinate-derived sulfur compounds, analogues of which are renowned for their desirable sensory and health-promoting attributes.
RESULTS
Three onion cultivars were studied: a mild hybrid (H) mid-daylength fresh onion (‘Enterprise’), a pungent open-pollinated (O) fresh onion (‘Pukekohe LongKeeper’), and a pungent dehydration (D) mid-daylength onion (Sensient Dehydrated Flavors). Eleven plants were evaluated, three nontransgenic plants (HN, ON, and DN) and eight transgenic plants (H1, H2, H3, O1, O2, O3, D1, and D2), from the hybrid, open-pollinated, and dehydration cultivars as indicated. These were the transformants recovered from approximately 15,000 immature embryos used in 16 transformation experiments (approximately 0.05% transformation frequency).
Plant Selection and Regeneration
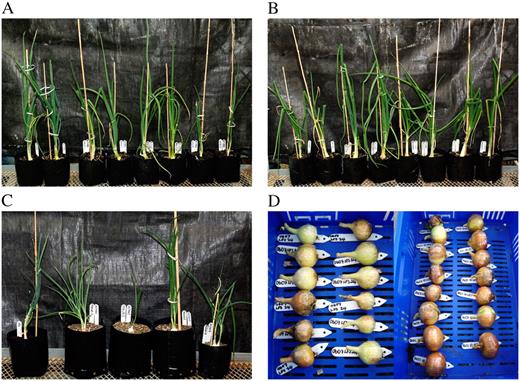
A to C, Ex-flasked intermediate daylength open-pollinated (O lines; A), hybrid (H lines; B), and dehydration (D lines; C) onions transformed with the lfsRNAi construct. D, LFS-silenced bulbs.
T-DNA Integration and Integrity
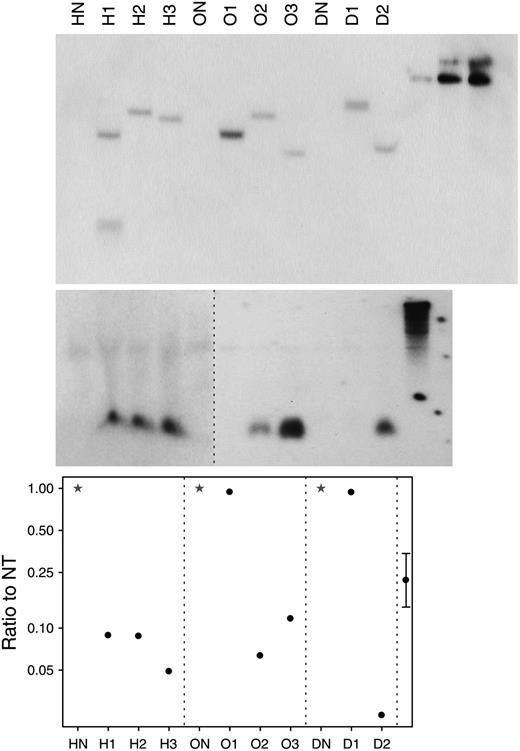
Molecular analysis. Top, Southern analysis of lfsRNAi transgenic onion plants probed with gfp probe. Center, RNAi analysis of small RNA probed with lfs probe. Bottom, Quantitative RT-PCR measurement of lfs transcript compared with nontransgenic (NT). HN, ON, and DN indicate nontransgenic hybrid, open-pollinated, and dehydration control, respectively (stars); H1, H2, H3, O1, O2, O3, D1, and D2 represent specific transgenic hybrid, open-pollinated, and dehydration onion plants (circles). Far right lanes show one-, five-, and 10-copy control, respectively (on Southern-blot gel) and LFS sequence control (on RNAi gel). The 95% confidence limit is calculated from an ANOVA of logged data using the within-bulb variation. Data were log-transformed to adjust for variance heterogeneity between lines.
Summary of molecular and biochemical data for transgenic onion plants
|
Analysis |
Plants |
||||||||||||||
|---|---|---|---|---|---|---|---|---|---|---|---|---|---|---|---|
|
|
H1
|
H2
|
H3
|
O1
|
O2
|
O3
|
D1
|
D2
|
|||||||
| PCR | Intact T-DNA | CaMV 35S deleted | Intact T-DNA | Intact T-DNA | Intact T-DNA | nptII deleted | Intact T-DNA | Intact T-DNA | |||||||
| Southern blot | Two at different loci | Single insert | Single insert | Multiple inserts at one locus | Single insert | Single insert | Two at different loci | Single insert | |||||||
| lfsRNAitranscripts | Present | Present | Present | Absent | Present | Present | Present | Present | |||||||
| siRNAs | Present | Present | Present | Absent | Present | Present | Absent | Present | |||||||
| lfs transcripts | Reduced | Reduced | Reduced | Normal | Reduced | Reduced | Normal | Reduced | |||||||
| LFS protein | Reduced | Reduced | Reduced | Normal | Reduced | Reduced | Normal | Reduced | |||||||
| LFS activity
|
Reduced
|
Reduced
|
Reduced
|
Normal
|
Reduced
|
Reduced
|
Normal
|
Reduced
|
|||||||
|
Analysis |
Plants |
||||||||||||||
|---|---|---|---|---|---|---|---|---|---|---|---|---|---|---|---|
|
|
H1
|
H2
|
H3
|
O1
|
O2
|
O3
|
D1
|
D2
|
|||||||
| PCR | Intact T-DNA | CaMV 35S deleted | Intact T-DNA | Intact T-DNA | Intact T-DNA | nptII deleted | Intact T-DNA | Intact T-DNA | |||||||
| Southern blot | Two at different loci | Single insert | Single insert | Multiple inserts at one locus | Single insert | Single insert | Two at different loci | Single insert | |||||||
| lfsRNAitranscripts | Present | Present | Present | Absent | Present | Present | Present | Present | |||||||
| siRNAs | Present | Present | Present | Absent | Present | Present | Absent | Present | |||||||
| lfs transcripts | Reduced | Reduced | Reduced | Normal | Reduced | Reduced | Normal | Reduced | |||||||
| LFS protein | Reduced | Reduced | Reduced | Normal | Reduced | Reduced | Normal | Reduced | |||||||
| LFS activity
|
Reduced
|
Reduced
|
Reduced
|
Normal
|
Reduced
|
Reduced
|
Normal
|
Reduced
|
|||||||
siRNA Production
Detection of lfsRNAi transcript by reverse transcription (RT)-PCR was used to indicate functionality of the transgene. All transgenic plants except O1 produced lfsRNAi transcript (Table I). Such observation of transgene inactivation due to multiple-copy inserts at a single locus is common (Muskens et al., 2000; Tang et al., 2007). Detection of lfs siRNA using a lfs probe (Fig. 3, center) showed that six plants (H1, H2, H3, O2, O3, and D2) produced siRNA fragments corresponding to the LFS gene sequence. Interestingly, plant D1, which produced lfsRNAi transcript, failed to produce lfs siRNA at detectable levels. We are unaware of other research that has used RT-PCR to detect hairpin transcripts and suggest that it is a valuable tool to differentiate reasons for hairpins failing to silence. In this case, we can assert that the cause was not transcriptional inactivation.
LFS Levels
lfs transcript levels (Fig. 3, bottom) were compared in cDNA samples from transgenic and nontransgenic plants by quantitative RT-PCR. Low levels of transcript corresponded well with the presence of lfs siRNA fragments.
No LFS protein could be detected in plants that produced lfs siRNA. Plants O1 and D1, with no observable lfs siRNA, had LFS protein levels that fell well within the range of their respective control nontransgenic plants (Fig. 4, top).
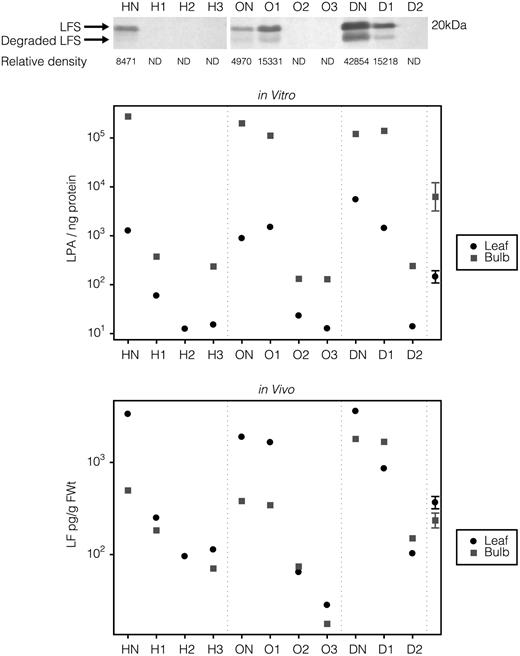
Biochemical analysis. Top, Western-blot analysis of LFS. Middle, In vitro LF peak area (LPA). Bottom, In vivo LF measurements. HN, ON, and DN indicate nontransgenic hybrid, open-pollinated, and dehydration control, respectively; H1, H2, H3, O1, O2, O3, D1, and D2 represent specific transgenic hybrid, open-pollinated, and dehydration onion plants. The 95% confidence limit is calculated by analysis of log-transformed data of within-bulb and within-leaf variation to account for the variance difference between the low and high LF values. ND, Not detected.
Precursor 1-PRENCSO Levels and Alliinase Activity
Biochemical analysis showed that the 1-PRENCSO levels in the transgenic and control plants were between 4 and 13 mg g−1 dry weight. Alliinase activity was between 15.8 and 42.4 nkat mg−1 protein. These substrate and enzyme levels are within the normal physiological range reported for onion (Kitamura et al., 1997; Kopsel and Randle, 1999). This suggests that in our transgenic onions, silencing lfs transcripts did not affect alliinase activity or 1-PRENCSO levels.
Phenotype Analysis of Secondary Sulfur Chemistry
In order to identify all of the possible changes to onion secondary sulfur metabolism, three established techniques were used: gas chromatography (GC) with flame photometric detection, solid-phase microextraction (SPME) GC-mass spectrometry (MS), and solvent extraction GC-MS. In addition, to detect the previously undetected in onion di-1-propenyl thiosulfinate, a novel colorimetric (“pinking”) assay was developed and used.
Volatile Sulfur Compounds
GC-flame photometric detection analysis of LF levels from freshly crushed leaf material demonstrated that H1, H2, and H3 were reduced by 13.5-, 35.5-, and 30-fold, respectively, compared with HN, that O2 and O3 were reduced by 30- and 67-fold compared with ON, and that D2 was reduced by 36-fold compared with DN. In bulb material, LF was reduced by 10.2- and 28.2-fold for H1 and H3 compared with HN (H2 was not measured, as the bulb was infected), by 6.4- and 28-fold for O2 and O3 compared with ON, and by 12.8-fold for D2 compared with DN (Fig. 4, bottom). Analysis of F1 progeny from line D2 has demonstrated that the reduced LF level is inherited along with GFP expression (data not shown).
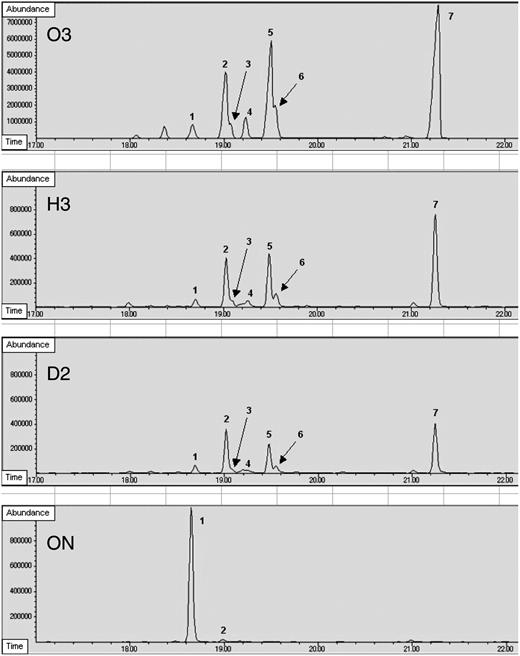
GC analysis of solid-phase microextraction sulfur components from the head space of vials containing cut onion leaf material. Peak 1, Dipropyl disulfide; peak 2, 1-propenyl propyl disulfide; peak 3, di-1-propenyl disulfide isomer 1; peak 4, di-1-propenyl disulfide isomer 2; peak 5, di-1-propenyl disulfide isomer 3; peak 6, syn-2-mercapto-3,4-dimethyl-2,3-dihydrothiophene; peak 7, anti-2-mercapto-3,4-dimethyl-2,3-dihydrothiophene.
Subjective sensory evaluation of the reduced-LF plants by the authors supported the GC analysis. Onion leaf and bulb samples (0.5 cm2) crushed between fingernails and placed touching the eyelashes caused a stinging and tearing sensation with control tissue but no tearing or stinging when reduced-LF material was used. The same material when placed next to the nose revealed an aroma in the reduced-LF plants that was less pungent and sweeter than that given off by the nontransgenic counterparts.
Thiosulfinate Detection and Abundance
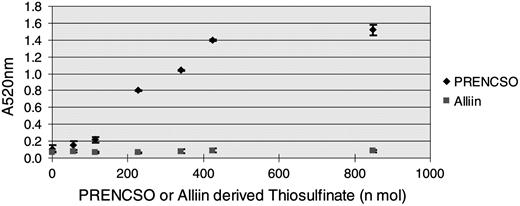
Pinking assay results showing specificity for 1-PRENCSO over alliin (2-PRENCSO).
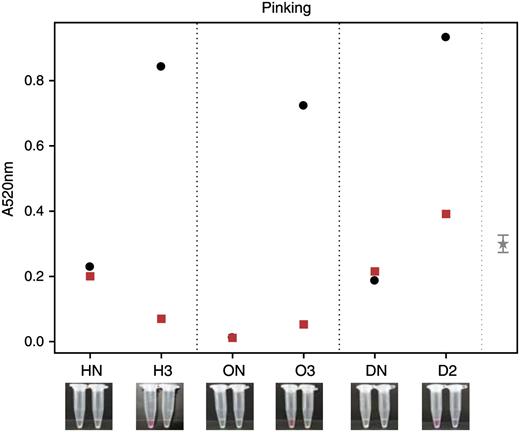
Pinking assay results showing thiosulfinate abundance in transgenic and nontransgenic plants. Thiosulfinate abundance shown in nontransgenic (HN, ON, and DN) and transgenic (H3, O3, and D2) onion extracts with (squares) and without (circles) the addition of recombinant LFS. Images below show pinking color for the respective plants (the left Eppendorf is without recombinant LFS, the right is with recombinant LFS). The 95% confidence limit is calculated from an ANOVA using the within-bulb variation.
Nonenzymatic Thiosulfinate-Derived Reaction Products
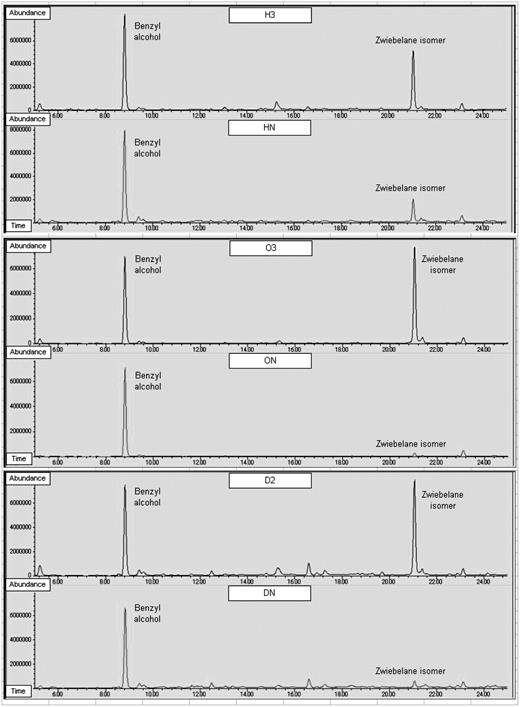
Total ion chromatograms of incubated onion extract. Chromatograms for H3 and HN, O3 and ON, and D2 and DN show the control benzyl alcohol and the zwiebelane isomer.
DISCUSSION
This report is the first demonstration, to our knowledge, of gene silencing in an Allium species. It also shows that the manipulation of plant secondary metabolite pathways can result in dramatic simultaneous down- and up-regulation of products within that pathway and the production of novel products upon tissue disruption.
Earlier work using antisense technology to silence the alliinase gene in onion produced some transgenic plants, but conclusive proof of silencing was not obtained (Eady et al., 2004). In this work, we successfully decreased endogenous LFS production through a single simple transformation event. This unambiguously lowered LFS activity in the plant, and the consequence of this was a significant reduction in the production of the irritant LF. This caused a large shift in the 1-PRENCSO breakdown pathway such that much more 1-propenyl sulfenic acid was available for conversion into thiosulfinates. Raised levels of 1-propenyl-containing thiosulfinate (detected using the novel pinking assay) predictably increased levels of the nonenzymatically produced downstream product, a zwiebelane isomer and di-1-propenyl disulfides. However, much more surprising and unpredicted was the production of 2-mercapto-3,4-dimethyl-2,3-dihydrothiophenes.
Silencing the lfs transcript has confirmed the hypothesis that LF production prevents the spontaneous production, from 1-propenyl sulfenic acid, of 1-propenyl-containing thiosulfinates in crushed onion. This demonstrates the specificity and affinity of LFS for 1-propenyl sulfenic acid and would indicate that alliinase and LFS must work in close proximity, as negligible amounts escape conversion into LF.
The development of the pinking assay reported here originated from in-depth studies of the cause of “off colors” in processed onion and garlic products (Imai et al., 2006a, 2006b). It provides a unique and simple method for detecting the 1-PRENCSO-derived thiosulfinate. Unlike the N-ethylmaleimide method of Lee and Parkin (1998), which detects all thiosulfinates, this pinking method is specific to 1-propenyl thiosulfinate. The development of a high-throughput protocol for this assay will provide Allium breeders and processors with a simple tool to quantify this important precursor.
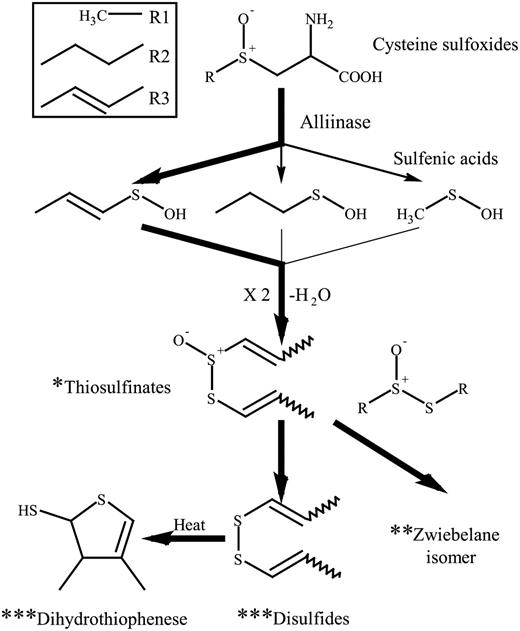
The proposed sulfur pathway following tissue disruption in transgenic onion. * Detected by pinking assay; ** detected by solvent extraction GC-MS; *** detected by SPME-GC-MS.
The presence of 2-mercapto-3,4-dimethyl-2,3-dihydrothiophenes was not predicted. The dihydrothiophenes were first reported to be formed by heating di-1-propenyl disulfide (Block and Zhao, 1990). Thus, the dihydrothiophenes detected in reduced-LF plants are likely to be formed from di-1-propenyl disulfide in thermally severe SPME-GC-MS analysis. The results presented here indicate that the di-1-propenyl thiosulfinate and its corresponding di-1-propenyl disulfide are thermally very unstable and as such difficult to assess quantitatively, despite the use of standard GC-MS protocols (Arnault et al., 2000, 2004; Hori, 2007). Thus, while the disulfides and dihydrothiophenes may not be present in raw reduced-LF onion, they are likely to be produced in a cooked reduced-LF onion. Further research will clarify the levels of these reaction products in onion.
The impact on flavor of the lower LF levels combined with the raised levels of thiosulfinate-derived sulfur compounds in the reduced-LF onion can be predicted from the existing literature. LF is the cause of the unpleasant pungent aroma associated with cut onions and the cause of heat and pungency flavor notes (Randle, 1997). Disulfide and dihydrothiophene compounds are associated with the sweeter aroma of cooked or fried onions (Lancaster and Boland, 1990; Albanese and Fontijne, 2002). Trans- and cis-zwiebelanes are associated with sweet raw onion sulfur tastes and sweet brown saute flavor notes, respectively (Block et al., 1996b). Initial olfactory assessment by the authors (smelling the crushed onion samples) indicated that the pungent aroma was absent in the reduced-LF plants and that the sweeter aroma of cooked onions was present. The literature suggests that the reduced-LF onions will have low heat and pungency combined with enhanced sweet raw onion and saute flavor notes. Formalized taste evaluation of the transgenic plants requires regulatory approval, and this has not yet been granted. Sensory evaluation panels are planned to test these predictions. We also hope to determine the precise olfactory or flavor roles of the other polysulfur volatiles that have been produced.
Allium sulfur compounds are renowned for their human health-giving attributes. We predict that the altered profiles present in the reduced-LF plants are likely to have significant consequences for these attributes; as such, they are being further investigated. For example, thiosulfinates have antiasthmatic activity (Griffiths et al., 2002). There is a clear rank order of pharmacological activity, with saturated thiosulfinates being less active than unsaturated ones. The unsaturated 1-propenyl-containing thiosulfinate in the reduced-LF onions may confer health properties to onion that have previously been associated with the unsaturated allicin thiosulfinate in garlic. In addition, zwiebelanes have been associated with anti-platelet-aggregation activity (Block, 1992; Block et al., 1996b; Keusgen, 2002). We are currently investigating the role of the zwiebelane isomer from our reduced-LF plants on platelet aggregation. Benavides et al. (2007) demonstrated that di-2-propenyl disulfide from garlic is converted after ingestion, by red blood cells, into hydrogen sulfide, a powerful signaling molecule that has an ideal physiological profile for cardiovascular protection (Lefer, 2007). The nature and similarity of garlic disulfides to the disulfide compounds produced in the reduced-LF plants warrants investigation to determine if they are also converted to hydrogen sulfide in the blood.
In summary, these reduced-LF onions are a unique resource for understanding the role of specific sulfur secondary metabolites in plant biology, in human health, and in terms of their potential value to the agrifood industry.
MATERIALS AND METHODS
Generation and Molecular Analysis of Transgenic Plants

The T-DNA region of the pART27-lfsRNAi-mgfp5ER silencing cassette used to silence LFS in onion. A 521-bp DNA fragment derived from lfs cDNA (AB089203) at positions 56 to 576 was selected for a sense lfs region of an RNAi construct and inserted into the XhoI and KpnI sites in pHANNIBAL. Similarly, a 512-bp DNA fragment at positions 63 to 574 was selected for an antisense lfs region and inserted into the ClaI and BamHI sites. The RNAi construct was excised from pHANNIBAL using the restriction enzyme NotI and inserted into the NotI site in the pART27-mgfp5ER. The gfp marker gene was used to aid the selection of transgenic events. LB, Left border; RB, right border.
For transcript analysis, total RNA was isolated from approximately 10 mg of freeze-dried onion leaf tissue using an RNeasy Plant Mini Kit (QIAGEN) following the manufacturer's instructions. RNA was quantified using a ND-1000 spectrophotometer (Nano Drop Technologies) after treatment with TURBO DNA-free (Ambion). Two hundred nanograms of the total RNA was reverse transcribed to first-strand cDNA using the Omniscript RT Kit (QIAGEN) and oligo(dT)21 primer.
For qualitative PCR to confirm the presence of lfsRNAi transcripts, the border region between antisense lfs of the lfsRNAi cassette and the ocs terminator was selected as a target to be amplified using specific primers (forward, 5′-CTCTTCGATTTTCTGACCTATCTCAGTAGC-3′; reverse, 5′-TGCACAACAGAATTGAAAGC-3′). The target sequence was amplified in a 25-μL reaction volume containing the first-strand cDNA, equivalent to 10 ng of total RNA, using a HotStarTaq Master Mix Kit (QIAGEN) according to the manufacturer's instructions. PCR, performed in a GeneAmp 9700 (Applied Biosystems), was set with the following PCR cycle program: 15 min at 95°C and 40 cycles of 1 min at 94°C, 1 min at 55°C, 1 min at 72°C, and 10 min at 72°C.
For quantitative real-time PCR, the 5′ region of lfs (accession no. AB089203) was selected as a target to be amplified using specific primers (forward, 5′-ACGTTATATCAAGAAGATTGTCCAA-3′; reverse, 5′-TCCGTTAGCACTATCAGCGAC-3′) and putative ubiquitin sequence (accession no. AA451588) was selected as an internal control gene to be amplified using specific primers (forward, 5′-ACGATTACACTAGAGGTGGAGAGCTC-3′; reverse, 5′-CCTGCAAATATCAGCCTCTGCT-3′). Each sequence was amplified in a 25-μL reaction volume containing the first-strand cDNA, equivalent to 10 ng of total RNA, using the QuantiTect SYBR Green PCR Kit (QIAGEN) according to the manufacturer's instructions. PCR, performed in an ABI PRISM 7700 (Applied Biosystems), was set with the following PCR cycle program: 15 min at 95°C and 40 cycles of 15 s at 94°C, 30 s at 57°C, and 30 s at 72°C. Each standard curve was calibrated using five concentrations of RT-PCR amplicon containing lfs or putative ubiquitin sequence, such as 100, 1,000, 10,000, 100,000, and 1,000,000 copies per reaction. The lfs mRNA level was determined by dividing the lfs copy number by the internal standard gene copy number as a relative mRNA level.
Biochemical Analysis of Plants
Western Analysis of LFS Protein
Total protein was extracted from approximately 20 mg of freeze-dried onion leaf tissue by PBS buffer and quantified using a protein assay (Bio-Rad) with bovine serum albumin (Sigma) as a standard. One hundred micrograms of protein in Laemmli Sample Buffer (Bio-Rad) was loaded onto a 15% polyacrylamide gel and electrophoresed. The protein was electrically blotted using a Trans-Blot SD Cell (Bio-Rad) onto a polyvinylidene difluoride membrane (Bio-Rad) following the manufacturer's instructions. The blot was blocked by BSA solution and incubated for 1 h with an LFS polyclonal antibody raised in a rabbit. Excess antibody was removed by two 20-min washes in PBS buffer, and the membrane was incubated for 1 h with an anti-rabbit IgG solution. Again, excess antibody was removed by three 20-min washes in PBS buffer, and the LFS protein was detected using the HRP Conjugate Substrate Kit (Bio-Rad) according to the manufacturer's instructions. The detected membranes were incorporated by ChemiDoc XRS (Bio-Rad) according to the manufacturer's instructions. Both LFS and degraded LFS bands were selected and quantified using Quantity One Software version 4.6 (Bio-Rad) according to the manufacturer's instructions.
LF Analysis
Approximately 2 g of young leaf from the second or third innermost leaf of actively growing glasshouse plants and mature bulb samples (top half bisected longitudinally) was harvested into liquid N2. Samples were stored at −80°C until ready for analysis. Half of each leaf and bulb sample was freeze dried, stored at room temperature in a desiccator, and used for LF assays and precursor evaluation (in vivo LF leaf assays used fresh frozen material).
In Vivo LF Assays
Sample preparation and GC analysis for LF were modified from a previously reported method (McCallum et al., 2005). Samples of leaf (20–100 mg) were crushed rapidly in 500 μL of deionized water in 1.5-mL microcentrifuge tubes. The tubes were held at room temperature (approximately 20°C) with stirring every minute. Three minutes after the initial mixing, 500 μL of dichloromethane (containing 0.06 μL mL−1 heptane thiol as an internal standard) was added. The tubes were gently rolled for 2 min to extract the sulfur compounds. A 300-μL sample of the dichloromethane phase was removed to a GC autoinjector vial for immediate analysis.
Samples of bulb powder (10–30 mg) were prepared as above, except that in addition to 500 μL of deionized water, seven times the sample weight of water was added to the sample to replace the water removed by freeze drying.
GC operating conditions were modified from the previous method as follows: 1-μL splitless injection with injector at 160°C; hydrogen carrier gas at constant 60 cm s−1 flow; isothermal 55°C oven temperature; flame photometric detector at 180°C. The detector was calibrated against heptane thiol. Three samples were prepared for analysis from each leaf and bulb powder sample, and duplicate GC runs were done for each of the replicate samples. Mean (n = 6) LF levels are expressed as picograms of LF per gram fresh weight using the dry weights of the bulb samples to adjust to a fresh weight basis.
In Vitro LF Assays
LFS enzyme activity was evaluated by LF-forming capability. Samples of freeze-dried powder (5–15 mg) were mixed with PBS buffer (137 mm NaCl, 8.1 mm Na2HPO4, 2.68 mm KCl, and 1.47 mm KH2PO4) at a concentration of 1 g per 100 mL. The mixture was centrifuged for 5 min at 15,000 rpm at 4°C, and the resulting supernatant was used for the activity assay. Protein quantification was performed as above. For the LF-forming capability assay, 10 μL of the extracted protein solution, 40 g μL−1 purified garlic (Allium sativum) alliinase (555 nkat mg−1 protein), and 20 g μL−1 of 20 mg mL−1 trans-PRENCSO purified from onion were mixed and left for 3 min at room temperature. Two microliters of the resulting mixture was analyzed by HPLC using an ODS column at 35°C. The column was eluted with 30% (v/v) acidic methanol (pH 3.3) at a flow rate of 0.6 mL min−1, and LF was monitored by the A 254. LFS enzyme activity was assessed by calculating LF peak area per nanogram of protein in 2 μL of the reaction mixture.
PRENCSO Substrate and Alliinase Activity
PRENCSO precursor levels were assayed as thiocarbamate derivatives by reverse-phase HPLC following the protocol of Randle et al. (1995) Alliinase activity levels were determined following a modified Schwimmer and Mazelis method (Lancaster et al., 2000) further adapted by the use of propyl-Cys sulfoxide as the substrate and a higher, 30°C reaction temperature.
Pinking Assay
The range and reliability of the pinking assay were examined. Several volumes of 20 mg mL−1 1-PRENCSO or alliin (0–850 nmol) were mixed with 40 μL of 5% Gly solution and 145 μL (20 nkat) of purified garlic alliinase (555 nkat mg−1 protein). After 30 min at 25°C, insoluble matter was removed by centrifugation and 10 μL of 100 μL L−1 formaldehyde solution was added to 100 μL of the supernatant. This was then incubated at 40°C for 6 h, and then A 520 was measured by spectrophotometry. Each assay was performed in triplicate.
The pinking assay was developed as follows: 30 mg of freeze-dried bulb powder was resuspended in 200 μL of 1% Gly solution with and without 15 μg of recombinant LFS. After 30 min at 25°C, insoluble matter was removed by centrifugation and 10 μL of 100 μL L−1 formaldehyde solution was added to 100 μL of the supernatant. This was incubated at 40°C for 6 h, and then A 520 was measured by spectrophotometry. Increasing absorbance (pinking) demonstrated the relative abundance of 1-propenyl-containing thiosulfinates.
Head Space SPME-GC-MS Analysis
Head space analysis was performed according to Hori's method (2007) with slight modifications. Five grams of sliced fresh leaf material from each plant was put into 20-mL SPME vials and covered with a lid immediately, then left for 30 min at room temperature. The head space of the vial was extracted with SPME (100 μ m polydimethylsiloxane; Supelco) at room temperature for 10 min. The fiber was inserted into a 5975C inert XL MSD MS system (Agilent Technologies) equipped with a 7890A GC system (Agilent Technologies). Data processing used MSD ChemStation Data Analysis (Agilent Technologies). GC separation was achieved using a 30-m × 0.25-mm i.d. DB-5ms column with 0.25-μm film (Agilent Technologies). The carrier was 99.999% helium at a column pressure of 100 kPa, and the column temperature program was 5 min at 35°C, 4°C min−1 to 200°C, 16 min at 200°C, and 10°C min−1 to 250°C. Transfer line and detector temperature was held at 150°C, and total ion chromatograms and mass spectra were analyzed with the electron-impact mode. The compounds were identified by matching their mass spectra to the U.S. National Institute of Standards and Technology and Wiley mass spectral libraries and previous studies (Hiramitsu, 1989; Sinha et al., 1992; Block et al., 1996a).
Solvent Extraction GC-MS Analysis
GC-MS analysis was performed according to Arnault's method (2000) with slight modifications. Forty milligrams of freeze-dried bulb powder from each plant was incubated in 400 μL of deionized water at room temperature and vortexed gently. After 80 min, 200 μL of diethyl ether (containing 0.01 μL of benzyl alcohol as an internal standard) was added and vortexed briefly. After 1 min of centrifugation at 15,000 rpm, the diethyl ether phase was transferred to a GC autoinjector vial for immediate analysis. One microliter was injected into a 5975C inert XL MSD MS system (Agilent Technologies) equipped with a 7890A GC system (Agilent Technologies). Data processing used MSD ChemStation Data Analysis (Agilent Technologies). GC separation was achieved using a 15-m × 0.32-mm i.d. DB-1 column with a thick coating (5 μm; Agilent Technologies). The carrier was 99.999% helium at 3.5 mL min−1, and the column temperature program was 5°C min−1 from 70°C to 250°C. Transfer line and detector temperature was held at 150°C, and total ion chromatograms and mass spectra were analyzed with the electron-impact mode. The compounds were identified by matching their mass spectra to the U.S. National Institute of Standards and Technology and Wiley mass spectral libraries and previous studies (Block et al., 1992b; Arnault et al., 2000).
Sequence data from this article can be found in the GenBank/EMBL data libraries under accession number AB089203.
Supplemental Data
The following materials are available in the online version of this article.
Supplemental Figure S1. Mass spectral data.
Supplemental Figure S2. Proposed reaction mechanism for producing a pink pigment.
ACKNOWLEDGMENTS
We thank Peter Waterhouse of the Commonwealth Scientific and Industrial Research Organization for the use of RNAi technology and critical review of the manuscript. Within Crop and Food Research, we thank Ruth Butler for statistical analysis, Doug Taylor for plant maintenance, and Daniel Park for editing.
LITERATURE CITED
Albanese GP, Fontijne LN, inventors. June 18,
Arnault I, Mondy N, Diwo S, Auger J (
Block E (
Block E (
Block E, Bayer T, Naganathan S, Zhao SH (
Block E, Naganathan S, Putman D, Zhao SH (
Block E, Putman D, Zhao SH (
Block E, Thiruvazhi M, Toscano PJ, Bayer T, Grisoni S, Zhao SH (
Block E, Zhao SH (
Boelens M, de Valois PJ, Wobben HJ, van der Gen A (
Eady C, Hunger S (
Eady CC (
Eady CC, Truman L, McCallum J, Shaw M, Pither-Joyce M, Davis S, Reader J (
Hiramitsu T, inventor. May 10,
Hori M (
Keusgen M (
Kopsel DE, Randle WM (
Kuo MC, Ho CT (
Kuo MC, Ho CT (
Lancaster JE, Boland MJ (
Lee CH, Parkin KL (
McCallum J, Porter N, Searle B, Shaw M, Bettjeman B, McManus M (
Morimitsu Y, Morioka Y, Kawakishi S (
Randle WM (
Randle WM, Lancaster JE (
Randle WM, Lancaster JE, Shaw ML, Sutton KH, Hay RL, Bussard ML (
Sinha KN, Guyer ED, Gage AD, Lira TC (
Tang W, Newton RJ, Weidner DA (
Author notes
This work was supported by the New Zealand Foundation for Research, Science, and Technology and by House Foods Corporation of Japan.
Corresponding author; e-mail eadyc@crop.cri.nz.
The author responsible for distribution of materials integral to the findings presented in this article in accordance with the policy described in the Instructions for Authors (www.plantphysiol.org) is: Colin C. Eady (eadyc@crop.cri.nz).
The online version of this article contains Web-only data.
Open Access articles can be viewed online without a subscription.
