


Abstract
PCR-ribotyping, a typing method based on polymorphism in the 16S-23S intergenic spacer region, has been recently used to investigate outbreaks due to Clostridium difficile. However, this method generates bands of high and close molecular masses which are difficult to separate on agarose gel electrophoresis. To improve reading of banding patterns of PCR-ribotyping applied to C. difficile, a partial sequencing of the rRNA genes (16S and 23S) and intergenic spacer region has been performed, then a new set of primers located closer to the intergenic spacer region has been defined. The new PCR gave reproducible patterns of bands easy to separate on agarose gel electrophoresis. Each of the 10 serogroups and 11 subgroups of serogroup A produced a different pattern. This typing method has evidenced major qualities such as easiness, rapidity and reproducibility. However, its discriminatory power has to be evaluated to validate its importance as a typing tool for C. difficile.
1 Introduction
Clostridium difficile is a major enteropathogen responsible for 95% of pseudomembranous colitis and most cases of antibiotic-associated diarrhea [1]. This bacterium is considered to be the main agent of nosocomially acquired diarrhea among adults [2]. Many various typing methods have been developed to investigate nosocomial outbreaks of C. difficile, some based on phenotype (lysotyping [3], serogrouping [4], SDS-PAGE [5], immunoblotting [6]) and others on genotype (plasmids [7], REA [8], ribotyping [9], PFGE [10], RAPD [11]). Recently, Kostman et al. developed a method of PCR-ribotyping that was shown to be reproducible, easy to perform and cost-effective [12]. It has been adapted to C. difficile by Gürtler et al. [13]. This typing method is based on the presence, on the bacterial chromosome, of several alleles of the rRNA operon differing by the length of the intergenic spacer region located between the 16S and the 23S rRNA genes [14]. Thus, a PCR using one primer in the 16S rRNA gene and the other in the 23S rRNA gene amplifies as many DNA fragments of different sizes as there are different alleles of the rRNA operon on the bacterial chromosome. As the large size of PCR DNA fragments produced patterns difficult to read, the method was modified by O'Neill et al. by choosing primers closer to the intergenic spacer region [15]. But the lack of data concerning the rRNA operon of C. difficile led them to define the 23S primer on a sequence of Clostridium botulinum. The aim of the present study was to sequence this region in several strains of C. difficile in order to choose new primers for PCR-ribotyping.
2 Materials and methods
2.1 Bacterial strains and culture conditions
Strains of C. difficile subjected to sequencing and used for PCR development were kindly supplied by M. Delmée, University of Louvain, Brussels, Belgium. These strains belong to the following 20 serogroups [16]: A1 (ATCC 43594); A2; A3; A4; A5; A6; A7; A8; A9; A10; A11; B (ATCC 43593); C (ATCC 43596); D (ATCC 43597); F (ATCC 43598); G (ATCC 43599); H (ATCC 43600); I (ATCC 43601); K (ATCC 43602); X (ATCC 43603). In addition, other strains isolated from feces of patients and belonging to the same serogroups were used in some experiments.
C. difficile strains were cultured in an anaerobic atmosphere on TCCA plates (brain-heart infusion agar supplemented with 5% defibrinated horse blood, 0.1% taurocholate, 10 mg ml−1 cefoxitin and 10 mg ml−1 cycloserine).
2.2 DNA extraction
DNA was extracted by use of a chelex resin-based DNA extraction commercial kit (InstaGene Matrix™, Bio-Rad, France) as recommended by the manufacturer, after growth on TCCA plates. Extracted DNA resulted in the harvesting of three large C. difficile colonies in a final volume of 200 µl (10 µl being used as template DNA for PCR reactions).
2.3 Ribosomal RNA gene sequencing
DNAs of the following serogroups were subjected to the sequencing PCR: A4, D, F, G and K. The sequencing PCR used the 16S upper primer defined by O'Neill et al. [15](5′-CTGGGGTGAAGTCGTAACAAGG-3′) and the 23S lower primer defined by Kostman et al. [12](5′-GGTACCTTAGATGTTTCAGTTC-3′). Amplification reactions were performed in 100 µl volume containing 10 mM Tris-HCl (pH 8.8), 50 mM KCl, 1.5 mM MgCl2, 200 µM of each dXTP, (Pharmacia), 100 pmol of each primer, 2.5 units of Taq polymerase (Pharmacia) and 10 µl of DNA extract. Amplifications were carried out in the thermal cycler (Perkin Elmer Cetus 480) for 1 cycle of 6 min at 94°C for denaturation, followed by 35 cycles (1 min at 94°C, 1 min at 56°C and 1 min at 72°C) and a final extension of 7 min at 72°C. Amplification products were fractionated by electrophoresis through 1.5% standard agarose (Eurobio) for 16 h at 50 V in Tris-borate-EDTA buffer (Eurobio) with a distance of 35 cm between electrodes and analyzed on a UV table after ethidium bromide staining. Isolated bands were cut and transferred to preweighed tubes. DNA was extracted using the kit GFX™ (Pharmacia Biotech, France). DNA sequencing was performed on an Applied Biosystems 373A DNA sequencer using the DNA Sequencing™ kit (Applied Biosystems). Sequences were then analyzed and aligned on the Sequence Navigator 1.0.1™ software (Applied Biosystems).
2.4 New PCR-ribotyping conditions
Primers were defined on the basis of DNA sequencing results, using Oligo 4™ software (National Bioscience Inc., ©Wojciech Rychlik 1992). The primer sequences were 5′-GTGCGGCTGGATCACCTCCT-3′ (16S primer) and 5′-CCCTGCACCCTTAATAACTTGACC-3′ (23S primer) and corresponded to bases 1482–1501 of the 16S ribosomal RNA gene of C. difficile and bases 1–24 of the 23S ribosomal RNA gene of C. difficile. Amplification reactions were performed in 100 µl volume containing 10 mM Tris-HCl (pH 8.8), 50 mM KCl, 1.5 mM MgCl2, 200 µM of each dXTP (Pharmacia), 50 pmol of each primer, 2.5 units of Taq polymerase (Pharmacia) and 10 µl of DNA extract (or distilled water as negative control). A comparison was performed with and without the addition of 5% DMSO (dimethyl sulfoxide) to the reaction mix. Amplifications were carried out in the thermal cycler (Perkin Elmer Cetus 480) for 1 cycle of 6 min at 94°C for denaturation, followed by 35 cycles (1 min at 94°C, 1 min at 57°C and 1 min at 72°C) and a final extension of 7 min at 72°C. Amplification products were fractionated by electrophoresis through 3% Resophor™ agarose (Eurobio) for 6 h at 85 V in TBE with a distance of 24 cm between electrodes and analyzed on a UV table after ethidium bromide staining. Gel images were acquired by CCD camera and analyzed by Image Master™ software (Bio-Rad). Reproducibility was studied by repeated PCR assays of the same DNA extract and of DNA extract from 10 subcultures of serogroups B and F.
2.5 Touchdown PCR
Touchdown PCR was performed using the same conditions described above with a modified thermal cycler program. After 6 min at 94°C for denaturation, 35 cycles were performed using the same program except that the annealing temperature decreased during the steps of amplification (66°C for 2 cycles, 64°C for 2 cycles, 62°C for 2 cycles, 60°C for 2 cycles, 58°C for 2 cycles and finally 57°C for the remaining 25 cycles). The program ended with a final extension of 7 min at 72°C as previously.
2.6 Nested PCR
Three strains were amplified with the primers and conditions previously defined by Kostman et al. [12] and 1:1000 dilutions of the PCR products were then subjected to the new PCR whose primers are located within the sequence amplified by Kostman's primers. Band patterns generated by this nested PCR and by the direct PCR were compared.
2.7 Previously described PCR-ribotyping method
The PCR-ribotyping method described by O'Neill et al. [15] was run in the same thermal cycler (Perkin Elmer Cetus 480) according to the conditions described by the authors.
3 Results
3.1 Sequencing
Seven sequences of variable quality were read (Fig. 1). In four of them (D1, F1, K1, A4), the end of the 16S ribosomal RNA gene, the intergenic spacer region and the beginning of the 23S ribosomal RNA gene were entirely readable with a complete double sense reading for one (sequence D1; accession number AJ132322). In the other sequences, only the end of the 16S ribosomal RNA gene and the beginning of the 23S RNA gene were readable in one sense (G1, G3, D2).
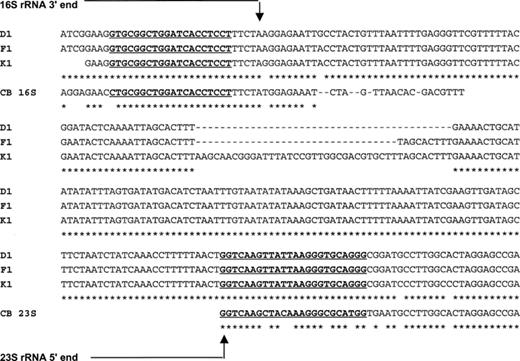
Alignment of three ribosomal RNA gene allele sequences (D1 {EMBL, accession number AJ132322}, F1, K1) belonging to C. difficile serogroups D (ATCC 43597), F (ATCC 43598) and K (ATCC 43602). CB 16S and CB 23S: corresponding sequences of C. botulinum at the 3′ end of the 16S rRNA gene (EMBL M97696) and the 5′ end of the 23S rRNA gene (EMBL X65602) respectively. In bold and underlined: localization of the new PCR-ribotyping primers. *: consensus nucleotides.
Sequence alignment has enabled the choice of new primers, specific for C. difficile and closer to the intergenic spacer region (Fig. 2). The 16S primer has been defined at the very end of the 16S ribosomal RNA gene. The 23S primer is the result of mismatch correction with respect to the 23S primer defined by O'Neill et al. and it was elongated at its 5′ end to fit with the new 16S primer annealing temperature.
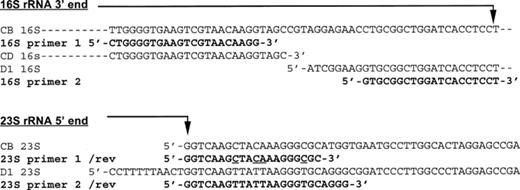
Localization of PCR-ribotyping primers. CB: C. botulinum rRNA gene sequences (16S: cbitsb (M97696), 23S: cb23rrng (X65602) of EMBL). CD: C. difficile 16S rRNA gene sequence (cd16srna (X73450) of EMBL). D1: 16S and 23S rRNA genes of C. difficile strain ATCC 43597 of serogroup D (EMBL, accession number AJ132322). /rev: reverse complementary sequence. 16S/23S primer 1: O'Neill's PCR-ribotyping primers (underlined on the 23S primer: the four mismatches observed with C. difficile sequences). 16S/23S primer 2: New PCR-ribotyping primers.
3.2 PCR-ribotyping
This new PCR generated reproducible banding patterns easily fractionable on high discriminatory power agarose gel electrophoresis. The bands generated ranged in size from 225 bp to 700 bp (Fig. 3). All the serogroups showed different patterns except for serogroup H (ATCC 43600) and serogroup A8. Reproducibility of the patterns after 10 subcultures was 100% (data not shown). All the bands generated by direct PCR-ribotyping were identical to those obtained by nested PCR-ribotyping (Fig. 4). Use of touchdown PCR and DMSO reduced neither the number of bands nor the banding pattern (Fig. 4). Comparison of the fingerprints obtained by the new PCR-ribotyping method with those obtained by O'Neill's method is shown in Fig. 5.
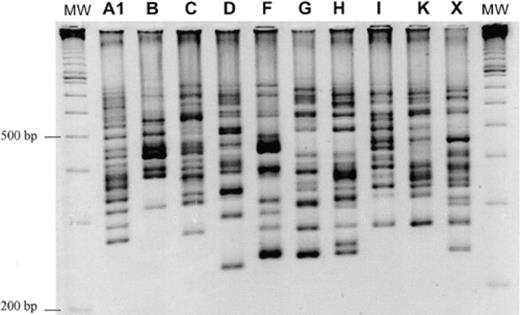
New PCR-ribotyping fingerprints of 10 C. difficile serogroups. MW: 100-bp molecular mass marker (Pharmacia).
![Comparison of fingerprints obtained with three strains belonging to serogroups D, F and G by use of the new PCR-ribotyping primers with: direct PCR (lanes 2, 7 and 12), nested PCR using 1/1000 dilution of Kostman et al.'s [12] PCR-ribotyping amplification products as template DNA (lanes 3, 8 and 13), direct PCR with addition of 5% DMSO (lanes 4, 9 and 14) and touchdown PCR (lanes 5, 10 and 15). Lanes 1, 6 and 11: 100-bp molecular mass marker (Pharmacia).](https://oup.silverchair-cdn.com/oup/backfile/Content_public/Journal/femsle/175/2/10.1111_j.1574-6968.1999.tb13629.x/1/m_FML_261_f4.jpeg?Expires=1716374196&Signature=Yrc8e94WHeHjWYdpfc3-xi-euG92j-dOk3B7HAPogro57S~QYQMEgZQJuHrQzyItv9rS8oVrn4Lgs9vtHW5Gzcs2nkIHC-2jETTlDvO9hFn~9Ij9LxUDv1PQLOjkfv5T~ne5P~eMHJilos8WzHwIp-JO-LTZr25rNeZJZbnTybUiai74cmnXX7NFo5cH1kxr4W82Uso8Izx1VLESjABBjCPOAve7C8pX4196ji3i4b8FZ~a-JyiF~dzoa0JSd8bc0CH4NvxOqUo-NJSEeBAUBHlV5zHVtHuJN4pV~ybD15rHSvQ8rmJg~EwM2WunRUobXF3h9o~kO9~enzq8gYWaLg__&Key-Pair-Id=APKAIE5G5CRDK6RD3PGA)
Comparison of fingerprints obtained with three strains belonging to serogroups D, F and G by use of the new PCR-ribotyping primers with: direct PCR (lanes 2, 7 and 12), nested PCR using 1/1000 dilution of Kostman et al.'s [12] PCR-ribotyping amplification products as template DNA (lanes 3, 8 and 13), direct PCR with addition of 5% DMSO (lanes 4, 9 and 14) and touchdown PCR (lanes 5, 10 and 15). Lanes 1, 6 and 11: 100-bp molecular mass marker (Pharmacia).
![Comparison of the new PCR-ribotyping fingerprints with those of the PCR-ribotyping described by O'Neill et al. [15]. Lanes 1, 6 and 11: 100-bp molecular mass marker (Pharmacia). Lanes 2, 4, 7, 9, 12: PCR-ribotyping fingerprints generated by use of the new primers with strains belonging to serogroups C, F, G, H and K. Lanes 3, 5, 8, 10 and 13: PCR-ribotyping fingerprints generated by use of the primers described by O'Neill et al. with the same strains (lane 3 corresponding to lane 2, 5 to 4 and so on).](https://oup.silverchair-cdn.com/oup/backfile/Content_public/Journal/femsle/175/2/10.1111_j.1574-6968.1999.tb13629.x/1/m_FML_261_f5.jpeg?Expires=1716374196&Signature=4gj4vf6DI2GTbnbxU6eLLX4aV9dBGtrZczi3Apd~wm7rQGruqafP9K6HjvK4R0bq-VdqWcVm1cRoI8Fqo637ZPqYvZrxHfs0ZZ1MKyVmwsX2C3hEkLspj0qZYlIKncXWM6585nkbmj6KRQs7JJX0GWm754TSx5hV-Sv~H2m4kVow0wg3kZeuue~anugvWELyodWJjRtUnznUFdslhoMZ1SHd5iERwqkSyQSMHU8deCXleJAxwVraoJ3hmMvR-HCb~Joy3RHnGpUtDx25bIzlBAUnqdWeWPyERwVMNiL3X9Cr5VZVHHq5lUN1upuIhQZCBYOTKU6N~81JP87iNoqAbg__&Key-Pair-Id=APKAIE5G5CRDK6RD3PGA)
Comparison of the new PCR-ribotyping fingerprints with those of the PCR-ribotyping described by O'Neill et al. [15]. Lanes 1, 6 and 11: 100-bp molecular mass marker (Pharmacia). Lanes 2, 4, 7, 9, 12: PCR-ribotyping fingerprints generated by use of the new primers with strains belonging to serogroups C, F, G, H and K. Lanes 3, 5, 8, 10 and 13: PCR-ribotyping fingerprints generated by use of the primers described by O'Neill et al. with the same strains (lane 3 corresponding to lane 2, 5 to 4 and so on).
4 Discussion
Intergenic spacer regions may differ in size by less than 10 nucleotides in C. difficile[13]. In these conditions, the smaller the DNA fragments generated by PCR-ribotyping, the more easily they are separated on an agarose gel matrix which lacks resolution to readily differentiate between two high molecular mass DNAs differing in size by a few nucleotides. The bands generated by the PCR-ribotyping methods of Kostman et al. [12] and Gürtler [13] exhibited high and close molecular masses, thus the patterns were difficult to read on agarose gel electrophoresis. A modification of the method was developed by O'Neill et al. in order to reduce the size of PCR-generated fragments by choosing new primers closer to the intergenic spacer region thus reducing the amount of ribosomal RNA gene of constant size in the amplification products [15]. The upper primer, defined on a C. difficile 16S RNA gene sequence, was still 37 nucleotides upstream of the end of the 16S rRNA gene. The lower primer was defined on a C. botulinum 23S RNA gene sequence. This new method gave good results with bands ranging from 260 to 585 bp that could be separated on agarose gel electrophoresis. However, it was noted by the author that some of the bands were unstable which was supposed to be a result of heteroduplex formation. Defining new primers based on the C. difficile genome and located closer to the intergenic spacer region could likely improve the method. However, the only 16S rRNA gene sequence of this bacterium available in gene data banks (EMBL: cd16srna, accession number X73450) was truncated at its 3′ end and there was no 23S rRNA gene sequence available. This led us to sequence rRNA operons of various C. difficile strains. Multiple alignments allowed us to choose new primers. The 16S primer could be brought closer to the intergenic spacer region. Comparison of the 23S primer defined on C. difficile sequences with the one defined on the C. botulinum sequence by O'Neill et al. shows four mismatches, highlighting that variations occur even between close species. The new PCR has improved readability of banding patterns with separation of bands that were formerly superposed or difficult to distinguish (Fig. 5). To assess the specificity of the bands various experiments have been performed such as the use of DMSO as cosolvent and the touchdown PCR program which are known to inhibit non-specific amplification [17]. The results showed no modification of banding patterns under these conditions. Using the primers defined by Kostman et al. [12], which are specific for well-conserved regions of rRNA genes among eubacteria, we amplified specifically rRNA operons and used a 1:1000 dilution of this product as template DNA for a nested PCR using our primers. As all the bands generated by direct PCR were identical to those generated by nested PCR, which could only amplify rRNA operons, we considered that the bands generated by our PCR did not result from non-specific amplification. Among different modes of DNA extraction (phenol-chloroform, silica columns, chelex-based extraction), a commercial kit based on chelex resin was chosen because of its excellent results, identical to those obtained by phenol-chloroform, and its ease of performance. The reproducibility of banding patterns between different PCRs, different modes of DNA extraction and after multiple subcultures has proven to be excellent (100%) and is a major advantage of this method in comparison with arbitrarily primed PCR (AP-PCR) [18]. However, discriminatory power was reported to be low among some serogroups [18] but further studies are needed. It is noticeable that two of the reference strains belonging to serogroup A8 and H displayed the same banding pattern. To better evaluate the importance of the PCR-ribotyping method in C. difficile, a comparison of this method with AP-PCR and pulsed field gel electrophoresis is currently being performed.
Acknowledgements
We are grateful to Dr. Véronique Barbu for her technical advice. Sequencing was performed in the Laboratoire commun de Biologie moléculaire Centre Hospitalo-Universitaire Saint Antoine, AP-HP, Paris. This work was supported by grants from INSERM (PARMIFR 9609) and the UPRES research group on C. difficile.
References
