A Spatial-Socioeconomic Urban Development Status Curve from NPP-VIIRS Nighttime Light Data
by
 ,
,
,
,
,
,
Chengshu Yang
1,2,

Bailang Yu
1,2,*,
Zuoqi Chen
3,4,
Wei Song
5,
Yuyu Zhou
6 ,
,
Xia Li
1,2 and
Jianping Wu
1,2
1
Key Laboratory of Geographic Information Science (Ministry of Education), East China Normal University, Shanghai 200241, China
2
School of Geographic Sciences, East China Normal University, Shanghai 200241, China
3
Key Laboratory of Spatial Data Mining and Information Sharing of Ministry of Education, National & Local Joint Engineering Research Center of Satellite Geospatial Information Technology, Fuzhou University, Fuzhou 35002, China
4
The Academy of Digital China, Fuzhou University, Fuzhou 350002, China
5
Department of Geography and Geosciences, University of Louisville, Louisville, KY 40292, USA
6
Department of Geological and Atmospheric Sciences, Iowa State University, Ames, IA 50011, USA
*
Author to whom correspondence should be addressed.
Remote Sens. 2019, 11(20), 2398; https://doi.org/10.3390/rs11202398
Submission received: 9 September 2019 / Revised: 3 October 2019 / Accepted: 14 October 2019 / Published: 16 October 2019
(This article belongs to the Section Urban Remote Sensing)
Abstract
:
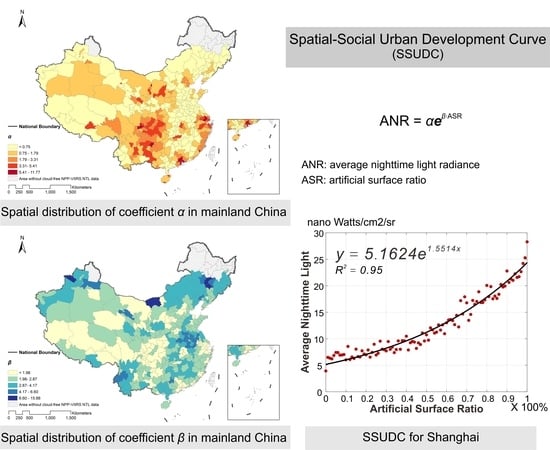
Urban development status is closely related to the urban economy, environment, ecology, and health. Spatial and socioeconomic processes are the two key aspects of urban development, so the absence of any of them will affect the assessment of urban development status. In this study, using both spatial and socioeconomic information from land cover data and nighttime light data, respectively, we proposed an exponential model, Spatial–Socioeconomic Urban Development Curve (SSUDC), to provide a quantitative expression of the relationship between the two key processes of urban development and analyze urban development status. The SSUDC was calculated from the artificial surface ratio at 1% intervals obtained from Globeland30 land cover data and the corresponding average NPP-VIIRS nighttime light radiance data, using a nonlinear least-squares method. We generated SSUDCs for 330 prefecture-level cities in Mainland China, 208 of which had coefficients of determination (R2) greater than 0.6. Taking Ordos and Guiyang as two typical examples, we analyzed the importance and advantages of SSUDC. The coefficients α and β of the exponential SSUDC were shown to indicate the base intensity socioeconomic activity and the concentration of socioeconomic activities, respectively, and can be used to reveal the urban socioeconomic development status and functional type of cities. At the internal urban level, the residuals of SSUDC can imply the demand for urban physical or economic construction in different areas of the city, and even the urban growth type, together with the distribution of the artificial surface ratio. In summary, the proposed SSUDC provides a simple way to combine the spatial and socioeconomic processes of urban development, which is beneficial to the analysis of urban development at different scales and a rewarding tool for urban planning.
1. Introduction
The modern world is becoming rapidly urbanized, with over half of the world’s population (54%) living in urban areas. Global urbanization is expected to continue so that, by 2050, the global urban population is projected to reach 6.3 billion and account for 66% of the world’s population [1]. Urbanization is not only linked to the appearance of urban areas and population growth but is also responsible for many economic, social, and environmental changes [2,3]. Previous research has proved that cities with different development patterns, or in different stages of development, can have different impacts on the economy, human health, and the environment [4,5]. Therefore, a correct and precise understanding of the status of urban development is important for evaluating the urbanization process and planning future urban development.
Urban development contains two main processes: spatial and socioeconomic [6]. The spatial process refers to increasing urban area and population growth. Urban expansion is the main spatial process [7,8,9,10,11]. The socioeconomic process, on the other hand, refers to changes in socioeconomic activities as a result of people living in cities, such as economic growth, industrial structure adjustment, and even lifestyle changes [12,13,14,15]. Both processes are key for assessing urban development status. Considering only spatial features will lead to erroneous estimations if the city expands rapidly and has a high house vacancy rate. Conversely, in the absence of spatial features, urban spatial development information will be lost.
The level of urbanization is commonly defined from the demographic perspective and embodied by urban populations [16,17]. The physical growth of urban areas can sometimes represent urbanization, and city size is considered a measure of urban development status [18,19]. However, these measurements of the urbanization level focus on either the socioeconomic or spatial process, which suffers from the limitation mentioned above. Due to the differences in the definition and census method of the urban population, the urbanization level of cities in different regions and countries lacks comparability [20]. On this basis, some scholars have attempted to combine the features of both spatial and socioeconomic processes to conduct a more comprehensive assessment of urban development in small areas [21,22]; however, two challenges remain. First, socioeconomic indices are typically derived from statistical data and lack spatial information; thus, they are problematic for the spatial distribution analysis of urban development. Second, it is difficult to find a universal way to depict the relationship between the two processes and analyze urban development status under various circumstances, especially for a large area.
Remote sensing methods are one of the most effective and widely used measures for urban mapping and analysis of urban development status from a spatial perspective [23]. Since the 1970s, due to its advantages of broad coverage, high efficiency, and objectivity, remote sensing combined with Geographic Information Systems (GIS) has provided enormous urban spatial information and led to extensive research achievements in built-up area extraction [24,25,26,27], land-expansion detection [7,8,11], land-use mapping [28,29,30], land cover change analysis [29,31], urban landscape structure detection [32,33,34], and analysis of urban spatial structure [35,36,37,38]. Among these research directions, urban built-up area evaluation using direct detection or land cover datasets is most representative of urban spatial development.
Nighttime light (NTL) remote sensing data, which record nighttime lights on the Earth’s surface by sensors, can detect the artificial lights from cities, towns, and industrial areas [39,40] and have shown good performance for human socioeconomic-activity detection [40]. The Defense Meteorological Satellite Program’s Operational Linescan System (DMSP-OLS) data have been widely used in remote sensing of NTL since the 1990s. In 2011, the Visible Infrared Imaging Radiometer Suite (VIIRS) on satellite Suomi NPP was launched by the National Oceanic and Atmospheric Administration (NOAA), constituting a new generation of nighttime light remote sensing data. Compared with DMSP-OLS NTL data, NPP-VIIRS NTL data are greatly improved in terms of spatial resolution, data magnitude, minimum detection radiance, calibration, and saturation [41]. These NTL datasets have been used to estimate gross domestic product (GDP) [42,43,44], population [45,46], CO2 emission [47], electric power consumption [46,48], total freight traffic [49,50], house vacancy rates [51], and poverty [52,53]. Undoubtedly, NTL data represent a significant proxy for socioeconomic activities and even human development [54], and can also provide the corresponding spatial distribution information. Combined with the socioeconomic data, NTL data have been used to comparatively estimate urban development [55]; nevertheless, NTL data and urban spatial data have rarely been used together to explore urban development status, especially for a wide range of cities.
Therefore, in this study, NTL data were treated as an index of the socioeconomic process of urban development, while the artificial surface from a land cover dataset functioned as an index of the spatial process. The goal of this research is to propose a universal way to depict the relationship between land cover and NTL data within an administrative city and then develop a Spatial-Socioeconomic Urban Development Curve to monitor urban development status.
The rest of this paper is organized as follows. Section 2 introduces the study area and data. Section 3 describes the details of the method used to create the SSUDC. The results, analyses, and discussion of the SSUDCs for all study areas are presented in Section 4 and Section 5. Finally, we present our conclusions in Section 6.
2. Study Area and Data
2.1. Study Area
Due to rapid urbanization, cities in China have developed a rich diversity of development forms and states, which provide a variety of examples for the study of urban development. In this study, we focused on urban development within administrative cities, which involves not only urban areas but also rural areas. In accordance with administrative boundaries, more than 330 prefecture-level cities in Mainland China were chosen as study areas to explore urban development status; 13 cities were removed due to poor quality NTL data in high-latitude zones. For further analysis of diverse urban development status, four cities (Shanghai, Urumqi, Zhangjiakou, and Linfen) were selected that display significant differences in economy, size, and location (Figure 1). Because of the important role of urban agglomeration in modernization and urbanization in China [56], we also selected five super-urban agglomerations (Beijing-Tianjin-Hebei, Yangtze River Delta, Pearl River Delta, Middle Yangtze Region, and Chengdu-Chongqing) and three typical urban agglomerations (Harbin-Changchun, Central Plains, and Beibu Gulf). Based on national core cities, the five super-urban agglomerations played momentous roles in the national economic development and had global influences. The three typical urban agglomerations were commonly viewed as the regional-level urban agglomerations and drove the regional economic development. The administrative boundaries of cities that were parts of urban agglomerations in Fang’s study [57] were regarded as the boundaries of the urban agglomerations, as the urban development status within prefecture-level administrative cities is the focus of our attention. Based on the socioeconomic development and geographical position, the Mainland of China was divided into three regions (eastern region, central region, and western region), which is helpful for the validation and the analysis of the results (Figure 1). The eastern region has flat and fertile plains, good conditions for agriculture, and rich resources, such as petroleum, iron ore, and salt. Due to its long history of development, this region plays a leading role in the national economic development with the great industrial and agricultural foundation. The central region is located inland with plateaus, hills, and plains, in which energy and mineral resources are abundant, and the heavy industry has a good foundation. In the western region, the topography is varied, and most areas are cold and water-deficient, which is not conducive to crops. The economic development in this region lags far behind the central and eastern regions, but the large area and the plentiful mineral resources provide great developmental potential.
2.2. Data
The key data used in this study include Globeland30-2010 land cover data, NPP-VIIRS NTL monthly composite data from April 2012, and the administrative boundaries. Globeland30-2010, produced by the National Geomatics Center of China (NGCC) (http://www.globeland30.com/), was the first global land cover dataset at the 30 m resolution for 2010 [58]. Its classification system includes 10 land cover types, namely cultivated land, forest, grassland, shrubland, wetland, water bodies, tundra, artificial surfaces, bare land, and permanent snow and ice, whose overall accuracy reaches 80.33% [31]. The type of artificial surface that indicates land modified by human activities (including all types of habitation, industrial and mining areas, transportation facilities, interior urban green zones, water bodies, etc.) was used to represent the spatial characteristics of urban development in this study.
NPP-VIIRS NTL composite data were obtained from the Earth Observation Group, National Oceanic and Atmospheric Administration’s National Geophysical Data Center (NOAA/NGDC) [59]. This dataset is the annual or monthly average of VIIRS Day/Night Band data, excluding those impacted by stray night, lightning, lunar illumination, and cloud cover. The version 1 monthly products span the globe from 75°N to 65°S latitude and store radiance values with units in nano-Watts/cm2/sr in 15 arc-second (about 500 m) geographic grids from April 2012 to July 2019. Another file that records the integer counts of the number of cloud-free observations in the average radiance image can also be downloaded. Considering the year of Globeland30 data (2010) and the influence of snow and cloud on data quality [60,61], we selected the first NPP-VIIRS NTL monthly composite data of April 2012, which had rare snow and few cloudy days in China, to reveal the urban socioeconomic characteristics. The largest number of cloud-free observations in April 2012 NPP-VIIRS NTL data is 21, and nearly 85 percent of the areas of Mainland China have more than 3 cloud-free observations. Despite this, we excluded 13 cities from the study areas in Mainland China where the proportion of cloud-free NPP-VIIRS NTL pixels was less than half (Figure 1).
Administrative boundary data at the prefecture level were extracted from the GADM dataset (Version 2.8, http://www.gadm.org/), which is a widely used spatial database of global administrative boundaries.
3. Methodology
3.1. Spatial–Socioeconomic Urban Development Curve
Generally, the intensity of socioeconomic activities increases with increasing urban area density [62,63]. In order to provide a quantitative expression of this relationship, we proposed the Spatial–Socioeconomic Urban Development Curve (SSUDC). After it was compared with other growth models, the exponential model performed the best in regard to calculating the SSUDC, where the urban area density is the independent variable and the intensity of socioeconomic activities is the dependent variable. In this study, the artificial surface ratio (ASR) and the average NTL radiance (ANR) represent these two variables, respectively. The total area within an administrative city was overlaid with square grids of 500 m, the same size as the NTL data pixel. Then, the ASR is the proportion of artificial surfaces in a grid, and the ANR is the mean value of the NTL radiance of the grids with the same ASR. The SSUDC can, therefore, be expressed as Equation (1):
where α and β are the coefficients in the equation. Figure 2 shows the SSUDC for Shanghai, China, a global economic, financial, trade, and transportation center. In the following sections, we provide details on the implementation procedures used to generate the SSUDC (Figure 3).
3.2. Generating the SSUDC
3.2.1. Data Preprocessing
Although the NPP-VIIRS NTL data have excluded data impacted by stray light, lightning, lunar illumination, and cloud cover, and we have also rejected areas with poor data quality in Mainland China, there were also multiple lights from fires, gas flares, and other unknown sources [41]. To remove the temporal lights and noise from NPP-VIIRS NTL data, we adopted the data correction method developed by Shi et al. [43]. Four cities (Beijing, Shanghai, Guangzhou, and Shenzhen) were chosen as the reference areas where we assumed that nighttime light values were higher than elsewhere in Mainland China. Any pixel whose value is larger than 238.613, the maximum nighttime light intensity of these four cities, was replaced with the maximum value from its eight neighboring pixels. In addition, all negative values were set to 0, and the NPP-VIIRS NTL data were projected into the Albers Conic Equal Area Projection with a central meridian of 105°E and a spatial resolution of 500 m.
Globeland30-2010 data were also projected into the Albers Conic Equal Area Projection. To fit the 500 m grid of NTL data, the nearest neighbor interpolation was used to resample the original 30 m data to 10 m spatial resolution, without any change of pixel value. As water bodies can reflect nearby light, which leads to some noise in NPP-VIIRS NTL data, we used water bodies from Globeland30-2010 data to calculate the water area ratio in each NPP-VIIRS NTL pixel; NPP-VIIRS NTL pixels with more than half covered by water were removed without further consideration.
3.2.2. Fitting the SSUDC
The SSUDC was calculated from the ASR and ANR according to Equation (1). To calculate the ASR in each NPP-VIIRS NTL pixel, we overlaid the artificial surfaces with the NPP-VIIRS NTL data. The pixels located on city boundaries were eliminated because they could be lit up by light sources outside the city. Thus, the ASR of each NPP-VIIRS NTL pixel was calculated by dividing the number of artificial surface pixels with the total number of pixels (Equation (2)):
where ASR is the artificial surface ratio for an NPP-VIIRS NTL pixel, Na is the number of artificial surface pixels, and Nt indicates the total number of pixels. Then, we calculated the average NTL radiance at 1 % ASR intervals (Equation (3)):
where i is the integer from 0 to 100. For all pixels where the ASR is between i % and (i + 1) %, ANRi is the average NTL radiance of those pixels, Ni is the number of total pixels, j is from 1 to Ni, and NRij is the NTL radiance of pixel j that belongs to those pixels with ASR from i % to (i + 1) %. Finally, the nonlinear least-squares method was used to derive the SSUDCs of ASR and corresponding ANR for all studied cities.
4. Results
4.1. Performance of SSUDC Fitting
To evaluate the goodness of fit, the coefficients of determination (R2) were calculated for 330 prefecture-level cities; 208 are greater than 0.6. Their spatial distribution in Mainland China is shown in Figure 4. Most of the cities with R2 values below 0.6 are distributed in Western China, such as Xinjiang, Tibet, and Qinghai, where there are large administrative areas, severe environments, and low population densities, and urban areas are too small and sparse [64] to have enough pixels for SSUDC. Figure 5 shows the numbers of pixels in each ASR interval for Lhasa, Urumqi, and Jinhua, whose R2 values are 0.2142, 0.6984, and 0.8858, respectively. Lhasa, as the capital city of Tibet, has few urban areas. There are more urban pixels in Urumqi, the capital city of Xinjiang; thus, its R2 value is larger than Lhasa’s. The small city of Jinhua, in the province of Zhejiang, has the most urban pixels and the largest R2 value among the three. Our results reveal a positive correlation between urban pixels and R2 and that small urban areas affect the performance of SSUDC. In summary, we suggest that the SSUDC results are acceptable and can effectively reflect the relationship between artificial surface ratio and nighttime light radiance.
4.2. Significance and Spatial Distribution of SSUDC Coefficients
Each city has its own SSUDC with different coefficients (α and β), which indicate the urban development status. In this study, the real average NTL radiances in the non-artificial surface area are very low and derived from the overflow of neighboring pixels and light from non-artificial surfaces, such as cropland. Coefficient α actually is the intercept of SSUDC and indicates the night light radiance in areas with the lowest ASR, so we suggest that α implies the base intensity of socioeconomic activity in a city. In general, the more developed the city, the higher the base intensity of socioeconomic activity. To validate the significance of α, we collected the statistical gross domestic product (GDP) per capita of all cities and conducted a correlation analysis between α and GDP per capita in the eastern region, central region, and western region, respectively. Figure 6 shows that α and GDP per capita have the positive linear correlations in the western region, central region, and eastern region, and the correlation coefficients (R) are 0.1737, 0.6656, and 0.5558. The T-test was used to test the significance of R. The P-values of eastern and central regions are both less than 0.01. In the western region, the correlation between α and GDP per capita is not as strong as in the eastern and central regions, but the P-value is still less than 0.05. Therefore, the coefficient α can reflect the base intensity of socioeconomic activity in a city.
Coefficient β, as the growth rate of SSUDC, represents how fast the nighttime light radiance increases with ASR growth in a city. Analogizing with the Lorenz curve [65], the exponential model indicates the aggregation of the dependent variable in the high-value range of the independent variable. The lager the β, the steeper the curve, the greater concentration of the dependent variable. Therefore, coefficient β can be used to measuring the concentration of nighttime light radiance in the high ASR urban areas. In other words, β indicates the concentration of socioeconomic activities. The larger the β, the greater the concentration in areas with high ASR, the more socioeconomic imbalances between the areas with low and high ASR. Furthermore, through SSUDC, we can quantify the socioeconomic activity intensity that a city can support at any ASR.
Figure 7 shows the distributions of coefficients α and β in Mainland China. Two coefficients obviously have different characteristics in spatial distribution. The regional agglomerations of these two coefficients appear in different urban agglomerations. In general, cities with large α are typically located in developed regions (Figure 7a); i.e., the southeast coast and middle Yangtze region of China. After years of development, these regions have laid a good economic foundation. It is noteworthy that some cities in the southwestern region of China with a low GDP also have large α. This phenomenon can be attributed to the terrain of these cities. For example, Guiyang is the capital city of the province of Guizhou and lies in the hilly area of Yunnan Guizhou Plateau, so its spatial development is confined by hills as its socioeconomic activity intensity increases. We explain more details of Guiyang’s urban development analysis in Section 5.4. All five super-urban agglomerations have relatively large α, especially the cities in their core regions, which corroborated the achievement of the urban agglomeration policy.
As shown in Figure 7b, most cities with large β are located in underdeveloped and developing areas, such as Central and Northwest China, and under the rapid development with economic vitalities that benefit from the growth strategy of Central China and western development. In these cities, the rises of socioeconomic activities are sharper in the urban area than the rural area, which results in a great concentration of socioeconomic activities in the areas with high ASR. Three typical urban agglomerations, Harbin-Changchun, Central Plains, and Beibu Gulf, have developed relatively rapidly in the first ten years of the 21st century and have relatively large β. Harbin-Changchun urban agglomeration was an important industrial center in the mid-20th century and declined in the late 20th century. After 2000, Harbin-Changchun began to accelerate its development again, relying on the reconstruction strategy. Central Plains and Beibu Gulf urban agglomerations were proved by the State Council in 2016 and 2017, respectively. The large β in these two new urban agglomerations demonstrates that they were already in the period of rapid development in 2010.
To further explore the relationship between α and β, we created a scatter plot (Figure 8), which shows that β decreases with increasing α. A power function was used to fit the scatter, revealing a determination coefficient (R2) of fitting of up to 0.79. Naturally, there is a conflict between the base intensity and concentration of socioeconomic activity. In different stages of development, the α and β cannot be large at the same time. Cities with large α and small β are generally well developed and have sound economic bases evenly distributed throughout the urban area, so the concentrations of socioeconomic activities in these cities are lower than in developing cities. As shown in Figure 8, cities with adequate development in their region, such as Shenzhen, Chengdu, Xiamen, Shanghai, and Beijing, belong to this category. It should be noted that the coefficients α of Beijing and Shanghai are smaller than those of the other cities. For megacities, the development of the urban core area has a vital impact on the economy, and the base intensity of the socioeconomic activities is low compared with the development status. Conversely, cities with small α and large β, such as Bortala, Songyuan, Bayan Nur, Fuyang, and Bengbu, usually have poor socioeconomic bases and are under rapid development. These are prominent cities in underdeveloped or developing regions. Naturally, for most cities, both coefficients are not large, which implies that urban development in China is steady.
5. Discussion
5.1. Urban Socioeconomic Development Status
As mentioned in Section 2, Shanghai, Urumqi, Linfen, and Zhangjiakou, which have diverse urban development status, were selected for SSUDC evaluation, and this is depicted in Figure 9. It is clear that Shanghai, the economic and technological center of China, has a large α and a small β because the economy is almost fully developed in Shanghai and the socioeconomic activities difference between low and high ASR areas is relatively small. As the capital city of the province of Xinjiang, Urumqi does not have small coefficients, even though it is located in Northwest China, which is in a state of underdevelopment. It is noteworthy that the β value for Urumqi is larger than that of Shanghai, which means that the distribution of socioeconomic activities in Urumqi is more unequal than in Shanghai. Linfen and Zhangjiakou are cities in the provinces of Shanxi and Hebei, respectively, and both exhibit a comparatively low GDP for 2012 (113605.73 and 111861 million CNY, respectively [66]). It follows that the α values for these two cities are both small. However, the β value of Zhangjiakou is larger, even than Shanghai and Urumqi. The main cause of this phenomenon is the establishment of an industrial cluster in Zhangjiakou in 2010, which resulted in vigorous economic development. As for Linfen, the optimization of industrial structure in order to move away from a coal-based economy has placed this city in a transitional period, which leads to a small value of β.
5.2. Urban Internal Development Status and Spatial Structure
By considering both spatial and socioeconomic processes of urban development, further information on urban development status within cities can be provided by the residual of SSUDC, in addition to its coefficients. A positive residual signifies a surplus of socioeconomic activity, and a negative residual corresponds to a surplus of urban spatial construction. A residual of close to 0 represents an ideal development status. Combined with the distribution of ASR, residual analysis can provide further information on urban internal development status and spatial structure.
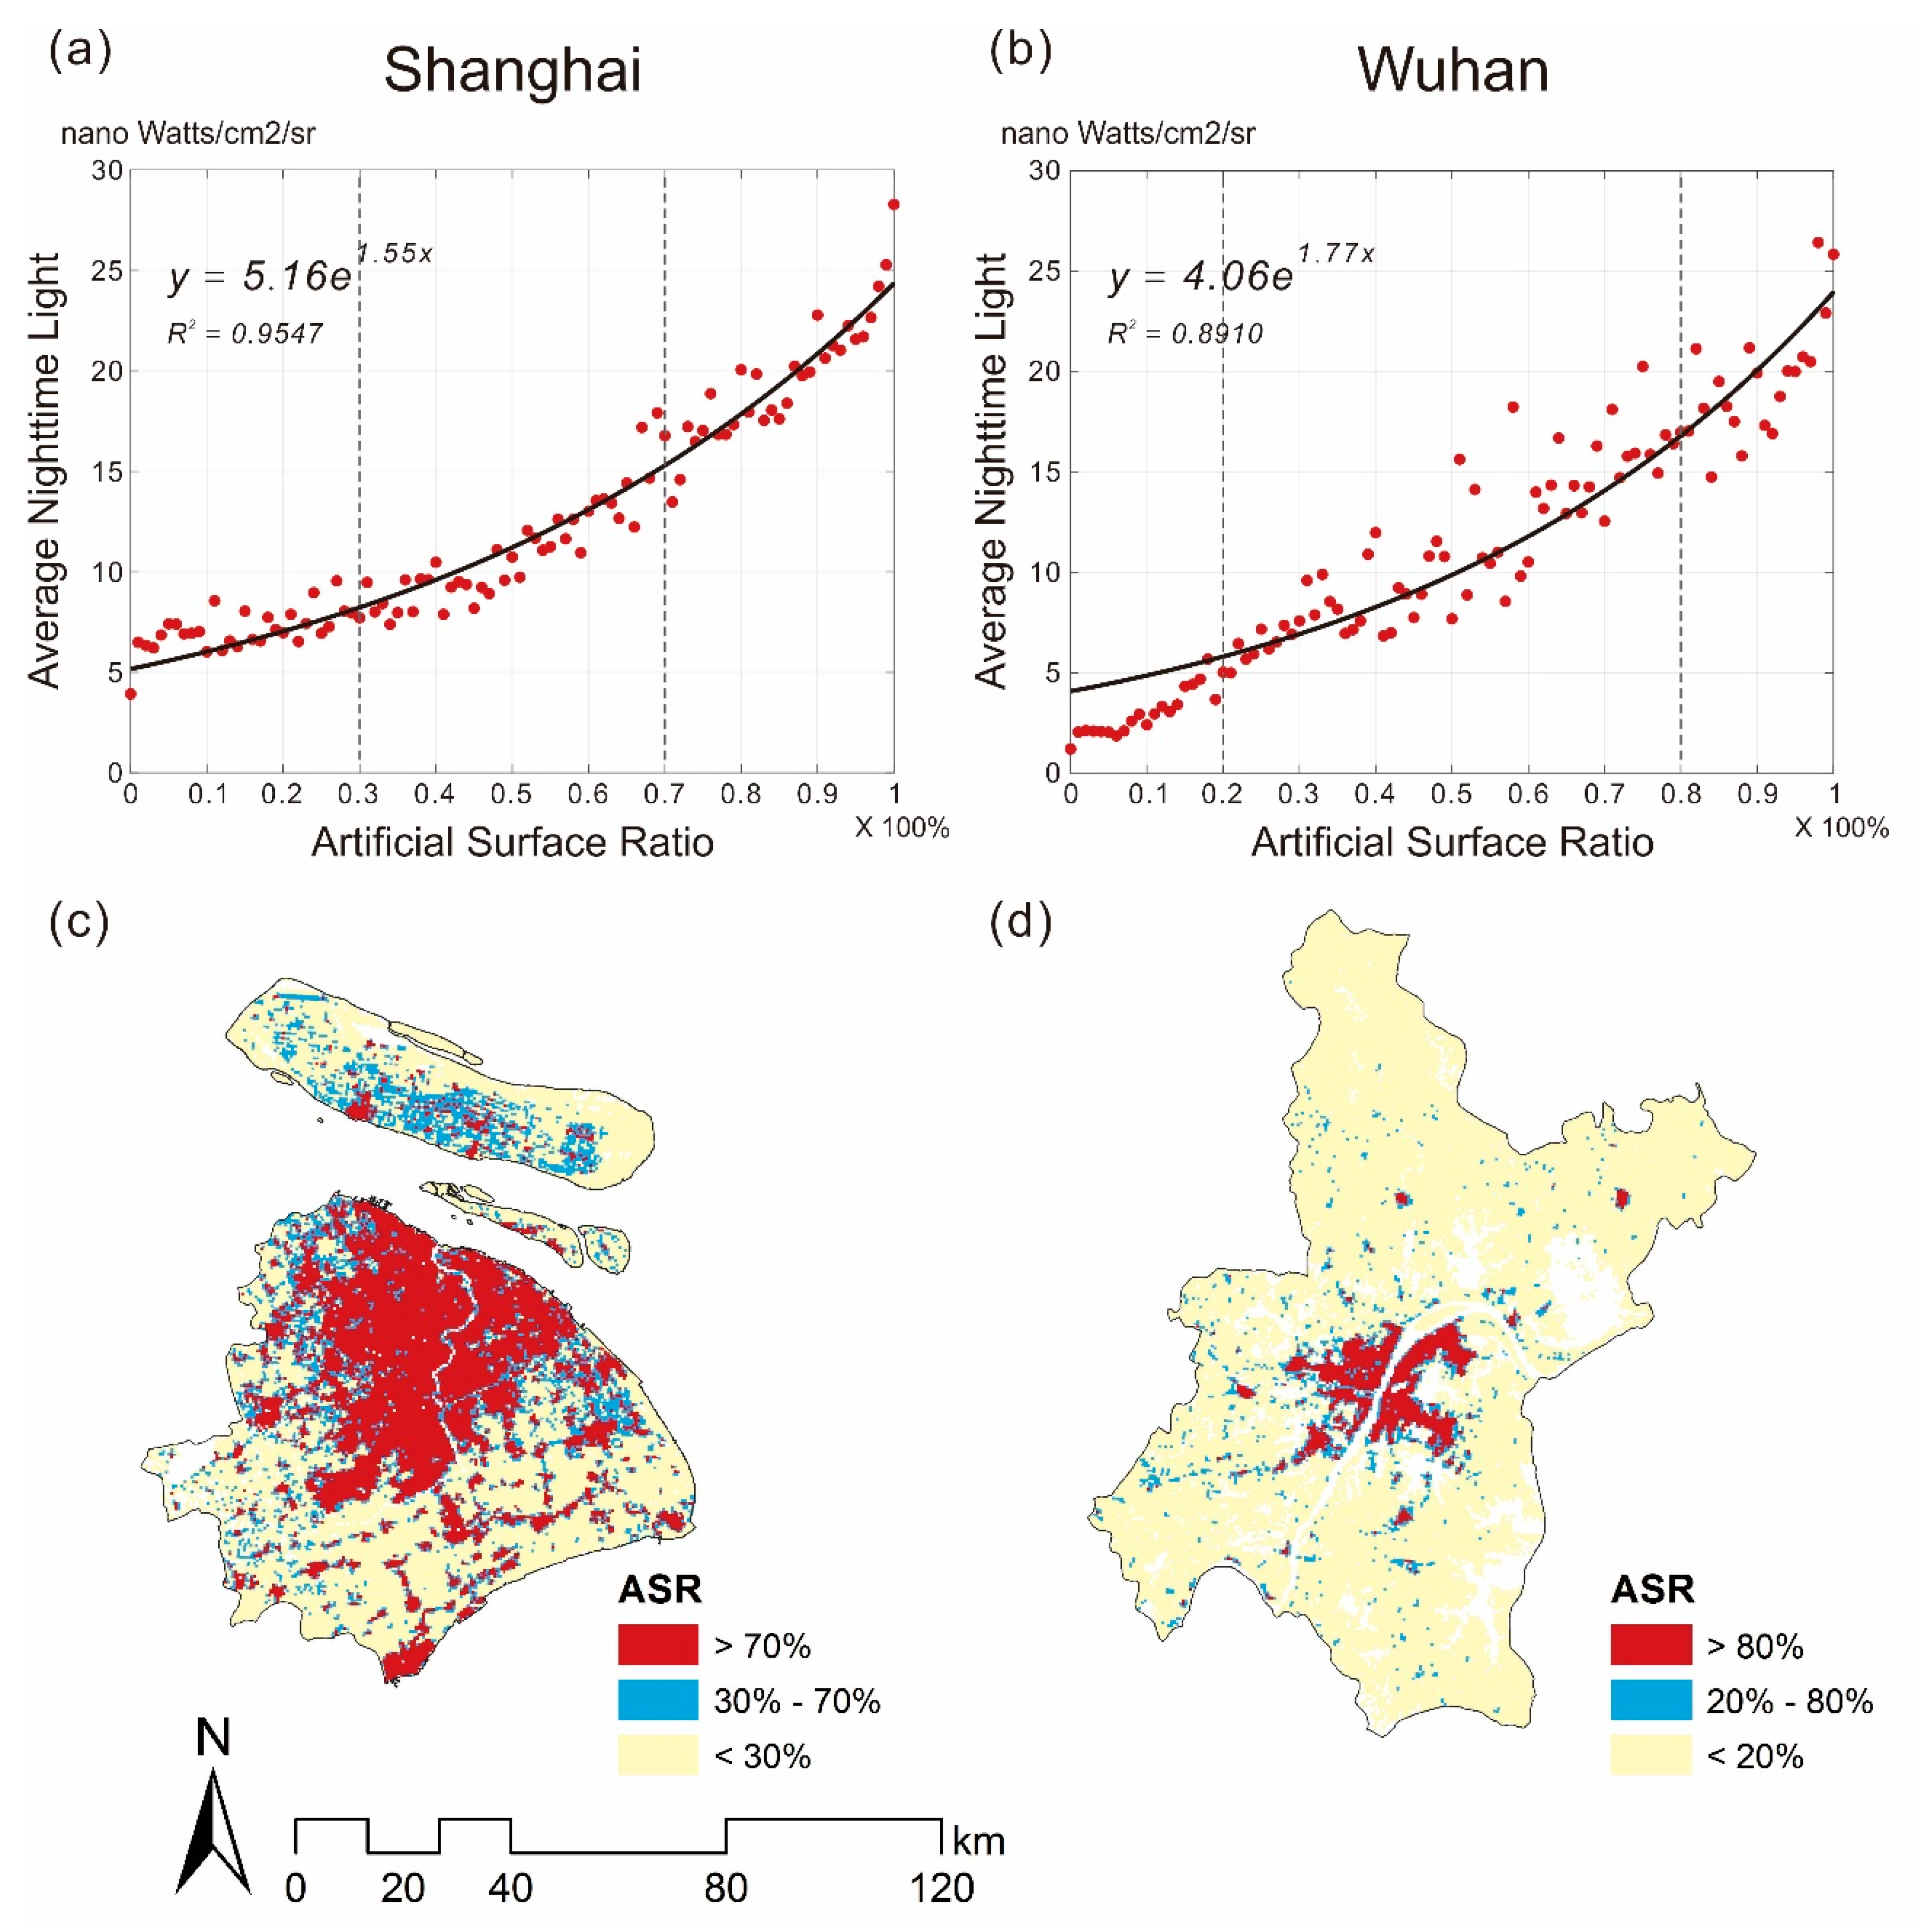
For example, the spatial distribution of the artificial surface ratio in Shanghai is illustrated in Figure 10. When the ASR is less than 30% in Shanghai, as shown in Figure 10a by the dashed line, the total residual of SSUDC is 16.3815. This means that the real intensity of socioeconomic activity is higher than that calculated by SSUDC. As we can see in Figure 10c, most regions with an ASR of less than 30% are suburban areas, so the focus of urban development is likely to be on urban physical construction rather than on economic construction. In contrast, the total residual is −13.8947 when ASR is between 30% and 70%. These regions are typically scattered between urban and suburban areas. The negative residual indicates that the socioeconomic process of urban development lags behind the spatial process, and urban sprawl is occurring; thus, more economic activities can be supported, and the economic vitality should be enhanced. The areas with an ASR of more than 70% are almost all developed regions in Shanghai, where the total residual is 0.9915, which indicates an appropriate urban development status. When all ASR spatial distributions are summarized in Shanghai, the areas with high and low ASR have more socioeconomic activities than those with medium ASR. This implies that the urban growth type of Shanghai is mainly outlying, and multiple nuclei will probably typify its development model. In fact, Shanghai is a typical polycentric structure city in China, in which a polycentric development strategy was designed and implemented [35,67].
Wuhan, as the most populous city in Central China, has a different residual and ASR distribution from Shanghai (in Figure 10b,d). Located far from the downtown in Wuhan, the areas with an ASR of less than 20% have a residual of –38.7003. Therefore, those areas are lacking in socioeconomic activities. The main urban area of Wuhan with an ASR of more than 80% also has a negative residual of –14.2256, which indicates that either there is space remaining for socioeconomic development in the main city or socioeconomic activities have been decreasing. The positive residual appears in areas with ASR values between 20% and 80% and reaches 41.9130. This suggests that socioeconomic processes are more advanced than spatial processes in these areas, and edge-expansion is the main urban growth type in Wuhan. Other cities that are not as complicated as Shanghai and Wuhan may only be split into two parts, according to the residual; however, this method is also applicable to these cities.
5.3. Urban Functional Type
It is acknowledged that cities differ in function, and the functional type of a city depends on its role in the country or region [68]. Not only the socioeconomic but also the spatial features can affect the functional generation of cities [69]. Therefore, we selected 27 cities with three different functional types according to the functional classification system of Chinese cities by Xu [70] to test the SSUDC’s ability to identify the urban functional type. A scatter plot of coefficients α and β is depicted in Figure 11, which indicates that the urban development information obtained from the SSUDC can partly reveal the functional type of a city through the coefficients α and β. Given that mining cities have single economic structures and weak economic foundations, they typically have small α. However, after optimization of the industrial structure, more economic development potential in high ASR urban areas was stimulated, contributing to the relatively large β. As for industrial cities, good economic bases formed as a result of China’s industrial boom, so that the α values of industrial cities are unusually large. With the implementation of the sustainable development strategy, the development style of industrial cities is changing. Consequently, industrial cities have relatively slow economic growth and comparatively small β values. The characteristics of tourist cities are not obvious, however, and additional auxiliary information besides the SSUDC coefficients is required in order to identify the urban functional type.
5.4. Advantages of SSUDC by Considering both Spatial and Socioeconomic Processes
Considering either spatial or socioeconomic processes leads to an inaccurate assessment of the urban development status. Two typical cities, Ordos and Guiyang, were selected to find out the benefits of analyzing with SSUDC, whose results are shown in Figure 12. Ordos has been a famous “ghost city” in China since its pictures were reported by Time magazine in 2010 [71]. Mining is the main industry of Ordos. The α and β of Ordos’s SSUDC are 1.04 and 2.29, respectively, which conform to the mining city’s coefficients, as seen in Figure 11. Guiyang is the capital city of Guizhou, which is one of the most underdeveloped provinces in China.
If using only the spatial information to analyze the urban development status in Ordos and Guiyang, we find that the Ordos is expanding to the southwest and Guiyang’s built-up area has little change. These results will mislead us into the biased conclusion that Ordos is under the fast urbanization and Guiyang’s urban development has stopped. Using only the socioeconomic indices to evaluate the urban development status can help us grasp the overall situation of urban socioeconomic development, but cannot reveal the development details and the imbalances of different areas within the city.
Facts are far from the conclusion of either spatial or socioeconomic analysis. At the beginning of the 21st century, the government of Ordos planned to build a new district, Kangbashi, to settle the increasing population with the urban development and then move the downtown to this new district. However, the population migration cannot catch up with the construction of the new district, so a large number of apartments were vacant. Using only land cover data to monitor the urban area expansion can miss this vacancy issue and get a biased urbanization evaluation. However, in Figure 12a, the SSUDC of Ordos clearly reflects the house vacancy situation. The total residual of SSUDC is –20.02 when the ASR is between 60% and 90%. The large negative residual indicates that the intensity of socioeconomic activities is much lower than urban construction, and the probability of house vacancy is high in those areas. Areas with ASR between 60% and 90% are depicted in blue in Figure 12a. The blue areas next to the old downtown area are the results of the natural urban expansion. But in the Kangbashi District, there are some isolated blue areas representing the high house vacancy rate.
As for Guiyang, with the continuous improvement of the railway network in this mountainous province, Guizhou’s GDP has grown rapidly, at a rate of more than 10 percent per year since 2003 [72,73]. Owing to the poor basic economic and high-speed development, cities similar to Guiyang in Western China usually have low base intensities and great concentrations of socioeconomic activities, so the α should be small and the β should be large in these cities. But in Guiyang’s SSUDC in Figure 12b, the coefficients α and β are 7.37 and 1.35, respectively, and different from those rapidly developing cities, even though Guiyang’s GDP is 170,030 million CNY that is ranked 90th in 330 prefecture-level cities, which is only about half of that in Ordos (365680 million CNY, ranked 36th) [66]. Mountainous areas limit the extent of the human activities in Guiyang. Therefore, the intensities of human activities throughout the Guiyang increase with the soaring economy and cannot be concentrated in the areas with high urban density, which is characterized by the large α and small β in the SSUDC. Furthermore, SSUDC’s total residual of –1.26 indicates a balanced status between urban physical construction and socioeconomic activities in Guiyang. As shown in ASR spatial distribution in Figure 12b, only a few areas where ASR is between 20% and 40% have relatively weak socioeconomic activities. In conclusion, the analysis of SSUDC can reflect the urban development status comprehensively and objectively.
5.5. Limitations and Future Perspectives
In this study, we proposed an SSUDC to analyze urban development status in Mainland China. In order to consider both spatial and socioeconomic processes of urban development, NTL data and land cover data were used as the respective proxies for the two processes. Unfortunately, Globeland30 data are only available for 2000 and 2010, and NPP-VIIRS NTL data start from 2012. Therefore, we selected Globeland30-2010 data and the first NPP-VIIRS NTL data from April 2012 to minimize the influence of temporal inconsistencies. Nonetheless, there is a two-year lag between the two datasets used in this study; therefore, the urban physical properties do not fully correspond to the socioeconomic properties, especially in those areas under rapid development. This is one of the reasons for the poor fitting results in the western region. Although reliable SSUDCs for most cities in Mainland China were generated in this study, the results can be improved by employing data from the same time period. Meanwhile, the seasonal change [60,74] and the anisotropic characteristic [73] of NPP-VIIRS data can also affect the urban development assessment.
In addition, small urban areas can also lead to errors in SSUDC fitting. In some regions of China, such as West Inner Mongolia, Xinjiang, and Tibet, the urban administrative region covers an area many times larger than the urban areas, most of which are secluded and in harsh environments. Therefore, we do not have enough samples to train a good regression model, and the performance of SSUDC with NPP-VIIRS NTL data and Globeland30 data is not satisfactory in these regions, which strongly limit the method. Employing remote sensing data with higher spatial resolution could be a good way to improve these results.
It is worth noting that analyzing the relationship between the two main processes of urban development in such a simple way is a simplification and generalization of the urban development process. In other words, SSUDC assesses the urban development status without considering the impact of the factors beyond the natural development, e.g., environmental policies. The interventions of environmental policies on the nighttime light brightness or artificial surfaces can lead to inaccurate SSUDCs.
In conclusion, SSUDC is a reliable method for urban development status analysis. However, data temporal inconsistencies and insufficient samples in some regions limited its performance. If cooperative finer spatial resolution and time-series data of the urban area can be found, improved results and a long time-series analysis, which is significant for urban planning, are foreseeable. Furthermore, introducing the policy factors into the model will be helpful to improve the performance of SSUDC in the cities with more policy interventions.
6. Conclusions
This study proposed a Spatial–Socioeconomic Urban Development Curve that represents the exponential relationship between the spatial (refers to Globeland30 land cover data) and socioeconomic (refers to NPP-VIIRS NTL data) processes of urban development to improve the analysis of urban development status, by compiling SSUDCs for 330 prefecture-level cities in Mainland China, of which 208 have R2 values greater than 0.6. Most of the cities with R2 values below 0.6 are distributed in Western China.
The SSUDC can be a new remote sensing solution to the assessment of urban development status, urban functions, and urban spatial structure at different scales. Given the spatial attributes of NPP-VIIRS NTL data, the coefficients of SSUDC can reveal more socioeconomic information than census data regarding the urban development status. Compared with GDP data, coefficient α indicates the base intensity of socioeconomic activity for a city, and coefficient β represents the concentration of socioeconomic activities in a city. An analysis of their spatial patterns in China shows that not only cities in developed areas but also those in mountainous regions of Southwest China have high socioeconomic intensities compared to their urban spatial development. Areas with large β are typically located in developing areas in Central and Western China because of vigorous economic development as a result of the growth strategy of central China and western development. Furthermore, SSUDC is helpful to identify the urban functional type, especially the industrial type, owing to the sensibility of SSUDC coefficients for the urban function. The residuals of SSUDC can indicate the demand for urban physical and economic construction in different areas of the city. Moreover, combining the distribution of artificial surface ratio with the corresponding residual can provide further information on the urban spatial structure.
Author Contributions
Conceptualization, B.Y., C.Y., and J.W.; methodology, C.Y., B.Y., and Z.C.; software, C.Y.; formal analysis, C.Y., B.Y., Z.C., W.S., Y.Z., and X.L.; writing—original draft preparation, C.Y.; writing—review and editing, B.Y., Z.C., W.S., Y.Z., and X.L.; supervision, B.Y. and J.W.; funding acquisition, B.Y., X.L., and Z.C.
Funding
This research was funded by the National Natural Science Foundation of China (No. 41531176, 41871331 and 41801343), the Major Program of National Social Science Foundation of China (17ZDA068), and the Fundamental Research Funds for the Central Universities of China.
Acknowledgments
The authors would like to thank the editor and the anonymous reviewers for their constructive comments on an earlier version of this paper.
Conflicts of Interest
The authors declare no conflicts of interest.
References
- United Nations. World Urbanization Prospects: The 2014 Revision; United Nations Department of Economics and Social Affairs, Population Division: New York, NY, USA, 2015. [Google Scholar]
- Bhatta, B. Analysis of Urban Growth and Sprawl from Remote Sensing Data; Springer Science & Business Media: Berlin/Heidelberg, Germany, 2010. [Google Scholar]
- Friedmann, J. Four theses in the study of China’s urbanization. Int. J. Urban Reg. Res. 2006, 30, 440–451. [Google Scholar] [CrossRef]
- Bai, X.; Chen, J.; Shi, P. Landscape urbanization and economic growth in China: Positive feedbacks and sustainability dilemmas. Environ. Sci. Technol. 2012, 46, 132–139. [Google Scholar] [CrossRef] [PubMed]
- Chen, W.; Zheng, R.; Zhang, S.; Zeng, H.; Zuo, T.; Xia, C.; Yang, Z.; He, J. Cancer incidence and mortality in China in 2013: An analysis based on urbanization level. Chin. J. Cancer Res. 2017, 29, 1–10. [Google Scholar] [CrossRef] [PubMed]
- Clark, D. Urban Geography: An Introductory Guide; Taylor & Francis: Abingdon, UK, 1982. [Google Scholar]
- Angel, S.; Parent, J.; Civco, D.L.; Blei, A.; Potere, D. The dimensions of global urban expansion: Estimates and projections for all countries, 2000-2050. Prog. Plan. 2011, 75, 53–107. [Google Scholar] [CrossRef]
- D’Amour, C.B.; Reitsma, F.; Baiocchi, G.; Barthel, S.; Guneralp, B.; Erb, K.H.; Haberl, H.; Creutzig, F.; Seto, K.C. Future urban land expansion and implications for global croplands. Proc. Natl. Acad. Sci. USA 2017, 114, 8939–8944. [Google Scholar] [CrossRef] [PubMed]
- De Espindola, G.M.; Carneiro, E.; Facanha, A.C. Four decades of urban sprawl and population growth in Teresina, Brazil. Appl. Geogr. 2017, 79, 73–83. [Google Scholar] [CrossRef]
- Hasselmann, F.; Csaplovics, E.; Falconer, I.; Burgi, M.; Hersperger, A.M. Technological driving forces of LUCC: Conceptualization, quantification, and the example of urban power distribution networks. Land Use Policy 2010, 27, 628–637. [Google Scholar] [CrossRef]
- Kuang, W.H.; Liu, J.Y.; Dong, J.W.; Chi, W.F.; Zhang, C. The rapid and massive urban and industrial land expansions in China between 1990 and 2010: A CLUD-based analysis of their trajectories, patterns, and drivers. Landsc. Urban Plan. 2016, 145, 21–33. [Google Scholar] [CrossRef]
- Chong, Z.H.; Qin, C.L.; Ye, X.Y. Environmental Regulation and Industrial Structure Change in China: Integrating Spatial and Social Network Analysis. Sustainability 2017, 9, 16. [Google Scholar] [CrossRef]
- Deng, X.Z.; Huang, J.K.; Rozelle, S.; Uchida, E. Economic Growth and the Expansion of Urban Land in China. Urban Stud. 2010, 47, 813–843. [Google Scholar] [CrossRef]
- Selvaratnam, D.P.; Tin, P.B. Lifestyle of the elderly in rural and urban Malaysia. Ann. N. Y. Acad. Sci. 2007, 1114, 317–325. [Google Scholar] [CrossRef] [PubMed]
- Buhaug, H.; Urdal, H. An urbanization bomb? Population growth and social disorder in cities. Glob. Environ. Chang.-Hum. Policy Dimens. 2013, 23, 1–10. [Google Scholar] [CrossRef]
- Davis, K.; Casis, A. Urbanization in Latin America. Milbank Meml. Fund Q. 1946, 24, 186–207. [Google Scholar] [CrossRef]
- Ledent, J. Comparative Dynamics of Three Demographic Models of Urbanization; International Institute for Applied Systems Analysis: Laxenburg, Austria, 1980. [Google Scholar]
- Arriaga, E.E. A new approach to the measurements of urbanization. Econ. Dev. Cult. Chang. 1970, 18, 206–218. [Google Scholar] [CrossRef]
- Schaffar, A.; Dimou, M. Rank-size city dynamics in China and India, 1981–2004. Reg. Stud. 2012, 46, 707–721. [Google Scholar] [CrossRef]
- Hsieh, S.-C. Analyzing urbanization data using rural–urban interaction model and logistic growth model. Comput. Environ. Urban Syst. 2014, 45, 89–100. [Google Scholar] [CrossRef]
- Ou, M.; Li, W.; Liu, X.; Chen, M. Comprehensive measurement of district’s urbanization level—A Case Study of Jiangsu Province. Resour. Environ. Yangtze Basin 2004, 13, 407–412. [Google Scholar]
- Chen, Y.; Liu, X.; Li, X. Analyzing Parcel-Level Relationships between Urban Land Expansion and Activity Changes by Integrating Landsat and Nighttime Light Data. Remote Sens. 2017, 9, 164. [Google Scholar] [CrossRef]
- Zhang, Q.; Seto, K.C. Mapping urbanization dynamics at regional and global scales using multi-temporal DMSP/OLS nighttime light data. Remote Sens. Environ. 2011, 115, 2320–2329. [Google Scholar] [CrossRef]
- Zha, Y.; Gao, J.; Ni, S. Use of normalized difference built-up index in automatically mapping urban areas from TM imagery. Int. J. Remote Sens. 2003, 24, 583–594. [Google Scholar] [CrossRef]
- Shi, K.; Huang, C.; Yu, B.; Yin, B.; Huang, Y.; Wu, J. Evaluation of NPP-VIIRS nighttime light composite data for extracting built-up urban areas. Remote Sens. Lett. 2014, 5, 358–366. [Google Scholar] [CrossRef]
- Zhou, Y.; Smith, S.J.; Elvidge, C.D.; Zhao, K.; Thomson, A.; Imhoff, M. A cluster-based method to map urban area from DMSP/OLS nightlights. Remote Sens. Environ. 2014, 147, 173–185. [Google Scholar] [CrossRef]
- Zhou, Y.; Smith, S.J.; Zhao, K.; Imhoff, M.; Thomson, A.; Bond-Lamberty, B.; Asrar, G.R.; Zhang, X.; He, C.; Elvidge, C.D. A global map of urban extent from nightlights. Environ. Res. Lett. 2015, 10, 054011. [Google Scholar] [CrossRef]
- Odenyo, V.A.O.; Pettry, D.E. Land-use mapping by machine processing of LANDSAT-1 data. Photogramm. Eng. Remote Sens. 1977, 43, 515–524. [Google Scholar]
- Li, X.; Chen, G.Z.; Liu, X.P.; Liang, X.; Wang, S.J.; Chen, Y.M.; Pei, F.S.; Xu, X.C. A New Global Land-Use and Land-Cover Change Product at a 1-km Resolution for 2010 to 2100 Based on Human-Environment Interactions. Ann. Am. Assoc. Geogr. 2017, 107, 1040–1059. [Google Scholar] [CrossRef]
- Li, X.; Yeh, A.G.O. Analyzing spatial restructuring of land use patterns in a fast growing region using remote sensing and GIS. Landsc. Urban Plan. 2004, 69, 335–354. [Google Scholar] [CrossRef]
- Chen, J.; Chen, J.; Liao, A.P.; Cao, X.; Chen, L.J.; Chen, X.H.; He, C.Y.; Han, G.; Peng, S.; Lu, M. Global land cover mapping at 30 m resolution: A POK-based operational approach. ISPRS J. Photogramm. Remote Sens. 2015, 103, 7–27. [Google Scholar] [CrossRef]
- Yu, B.; Liu, H.; Wu, J.; Lin, W.-M. Investigating impacts of urban morphology on spatio-temporal variations of solar radiation with airborne LIDAR data and a solar flux model: A case study of downtown Houston. Int. J. Remote Sens. 2009, 30, 4359–4385. [Google Scholar] [CrossRef]
- Taubenbock, H.; Wiesner, M.; Felbier, A.; Marconcini, M.; Esch, T.; Dech, S. New dimensions of urban landscapes: The spatio-temporal evolution from a polynuclei area to a mega-region based on remote sensing data. Appl. Geogr. 2014, 47, 137–153. [Google Scholar] [CrossRef]
- Wu, B.; Yu, B.L.; Wu, Q.S.; Yao, S.J.; Zhao, F.; Mao, W.Q.; Wu, J.P. A Graph-Based Approach for 3D Building Model Reconstruction from Airborne LiDAR Point Clouds. Remote Sens. 2017, 9, 16. [Google Scholar] [CrossRef]
- Chen, Z.; Yu, B.; Song, W.; Liu, H.; Wu, Q.; Shi, K.; Wu, J. A new approach for detecting urban centers and their spatial structure with nighttime light remote sensing. IEEE Trans. Geosci. Remote Sens. 2017, 55, 6305–6319. [Google Scholar] [CrossRef]
- Taubenbock, H.; Wegmann, M.; Roth, A.; Mehl, H.; Dech, S. Urbanization in India—Spatiotemporal analysis using remote sensing data. Comput. Environ. Urban Syst. 2009, 33, 179–188. [Google Scholar] [CrossRef]
- Wu, B.; Yu, B.; Wu, Q.; Chen, Z.; Yao, S.; Huang, Y.; Wu, J. An extended minimum spanning tree method for characterizing local urban patterns. Int. J. Geogr. Inf. Sci. 2017, 32, 450–475. [Google Scholar] [CrossRef]
- Yu, B.; Shu, S.; Liu, H.; Song, W.; Wu, J.; Wang, L.; Chen, Z. Object-based spatial cluster analysis of urban landscape pattern using nighttime light satellite images: A case study of China. Int. J. Geogr. Inf. Sci. 2014, 28, 2328–2355. [Google Scholar] [CrossRef]
- Elvidge, C.D.; Cinzano, P.; Pettit, D.R.; Arvesen, J.; Sutton, P.; Small, C.; Nemani, R.; Longcore, T.; Rich, C.; Safran, J.; et al. The Nightsat mission concept. Int. J. Remote Sens. 2007, 28, 2645–2670. [Google Scholar] [CrossRef]
- Elvidge, C.D.; Baugh, K.E.; Kihn, E.A.; Kroehl, H.W.; Davis, E.R. Mapping city lights with nighttime data from the DMSP operational linescan system. Photogramm. Eng. Remote Sens. 1997, 63, 727–734. [Google Scholar]
- Elvidge, C.D.; Baugh, K.E.; Zhizhi, M.; Hsu, F.-C. Why VIIRS data are superior to DMSP for mapping nighttime lights. Proc. Asia-Pac. Adv. Netw. 2013, 35, 62–69. [Google Scholar] [CrossRef]
- Chen, X.; Nordhaus, W.D. Using luminosity data as a proxy for economic statistics. Proc. Natl. Acad. Sci. USA 2011, 108, 8589–8594. [Google Scholar] [CrossRef] [Green Version]
- Shi, K.; Yu, B.; Huang, Y.; Hu, Y.; Yin, B.; Chen, Z.; Chen, L.; Wu, J. Evaluating the Ability of NPP-VIIRS Nighttime Light Data to Estimate the Gross Domestic Product and the Electric Power Consumption of China at Multiple Scales: A Comparison with DMSP-OLS Data. Remote Sens. 2014, 6, 1705–1724. [Google Scholar] [CrossRef] [Green Version]
- Zhao, N.; Liu, Y.; Cao, G.; Samson, E.L.; Zhang, J. Forecasting China’s GDP at the pixel level using nighttime lights time series and population images. Gisci. Remote Sens. 2017, 54, 407–425. [Google Scholar] [CrossRef]
- Sutton, P.; Roberts, D.; Elvidge, C.; Baugh, K. Census from Heaven: An estimate of the global human population using night-time satellite imagery. Int. J. Remote Sens. 2001, 22, 3061–3076. [Google Scholar] [CrossRef]
- Elvidge, C.D.; Baugh, K.E.; Kihn, E.A.; Kroehl, H.W.; Davis, E.R.; Davis, C.W. Relation between satellite observed visible-near infrared emissions, population, economic activity and electric power consumption. Int. J. Remote Sens. 1997, 18, 1373–1379. [Google Scholar] [CrossRef]
- Shi, K.; Chen, Y.; Yu, B.; Xu, T.; Chen, Z.; Liu, R.; Li, L.; Wu, J. Modeling spatiotemporal CO2 (carbon dioxide) emission dynamics in China from DMSP-OLS nighttime stable light data using panel data analysis. Appl. Energy 2016, 168, 523–533. [Google Scholar] [CrossRef]
- Shi, K.; Chen, Y.; Yu, B.; Xu, T.; Yang, C.; Li, L.; Huang, C.; Chen, Z.; Liu, R.; Wu, J. Detecting spatiotemporal dynamics of global electric power consumption using DMSP-OLS nighttime stable light data. Appl. Energy 2016, 184, 450–463. [Google Scholar] [CrossRef]
- Tian, J.R.; Zhao, N.Z.; Samson, E.L.; Wang, S.L. Brightness of Nighttime Lights as a Proxy for Freight Traffic: A Case Study of China. IEEE J. Sel. Top. Appl. Earth Obs. Remote Sens. 2014, 7, 206–212. [Google Scholar] [CrossRef]
- Shi, K.; Yu, B.; Hu, Y.; Huang, C.; Chen, Y.; Huang, Y.; Chen, Z.; Wu, J. Modeling and mapping total freight traffic in China using NPP-VIIRS nighttime light composite data. Gisci. Remote Sens. 2015, 52, 274–289. [Google Scholar] [CrossRef]
- Chen, Z.Q.; Yu, B.L.; Hu, Y.J.; Huang, C.; Shi, K.F.; Wu, J.P. Estimating House Vacancy Rate in Metropolitan Areas Using NPP-VIIRS Nighttime Light Composite Data. IEEE J. Sel. Top. Appl. Earth Obs. Remote Sens. 2015, 8, 2188–2197. [Google Scholar] [CrossRef]
- Yu, B.; Shi, K.; Hu, Y.; Huang, C.; Chen, Z.; Wu, J. Poverty Evaluation Using NPP-VIIRS Nighttime Light Composite Data at the County Level in China. IEEE J. Sel. Top. Appl. Earth Obs. Remote Sens. 2015, PP, 1–13. [Google Scholar] [CrossRef]
- Zhao, X.; Yu, B.; Liu, Y.; Chen, Z.; Li, Q.; Wang, C.; Wu, J. Estimation of Poverty Using Random Forest Regression with Multi-Source Data: A Case Study in Bangladesh. Remote Sens. 2019, 11, 375. [Google Scholar] [CrossRef]
- Bruederle, A.; Hodler, R. Nighttime lights as a proxy for human development at the local level. PLoS ONE 2018, 13, e0202231. [Google Scholar] [CrossRef]
- Fan, J.; Ma, T.; Zhou, C.; Zhou, Y.; Xu, T. Comparative Estimation of Urban Development in China’s Cities Using Socioeconomic and DMSP/OLS Night Light Data. Remote Sens. 2014, 6, 7840–7856. [Google Scholar] [CrossRef]
- Fang, C.; Yu, D. Urban agglomeration: An evolving concept of an emerging phenomenon. Landsc. Urban Plan. 2017, 162, 126–136. [Google Scholar] [CrossRef]
- Fang, C. Important progress and future direction of studies on China’s urban agglomerations. J. Geogr. Sci. 2015, 25, 1003–1024. [Google Scholar] [CrossRef]
- Chen, J.; Ban, Y.; Li, S. China: Open access to Earth land-cover map. Nature 2014, 514, 434. [Google Scholar] [CrossRef]
- Version 1 VIIRS Day/Night Band Nighttime Lights. Available online: https://eogdata.mines.edu/download_dnb_composites.html (accessed on 5 September 2019).
- Levin, N. The impact of seasonal changes on observed nighttime brightness from 2014 to 2015 monthly VIIRS DNB composites. Remote Sens. Environ. 2017, 193, 150–164. [Google Scholar] [CrossRef]
- Levin, N.; Zhang, Q. A global analysis of factors controlling VIIRS nighttime light levels from densely populated areas. Remote Sens. Environ. 2017, 190, 366–382. [Google Scholar] [CrossRef] [Green Version]
- Ji, X.; Chen, B. Assessing the energy-saving effect of urbanization in China based on stochastic impacts by regression on population, affluence and technology (STIRPAT) model. J. Clean. Prod. 2017, 163, S306–S314. [Google Scholar] [CrossRef]
- Zhang, C.; Miao, C.; Zhang, W.; Chen, X. Spatiotemporal patterns of urban sprawl and its relationship with economic development in China during 1990–2010. Habitat Int. 2018, 79, 51–60. [Google Scholar] [CrossRef]
- Deng, X.; Bai, X. Sustainable Urbanization in Western China. Environ. Sci. Policy Sustain. Dev. 2014, 56, 12–24. [Google Scholar] [CrossRef]
- Lorenz, M.O. Methods of measuring the concentration of wealth. Publ. Am. Stat. Assoc. 1905, 9, 209–219. [Google Scholar] [CrossRef]
- National Bureau of Statistics of China. 2013 China City Statistical Yearbook; China Statistics Press: Beijing, China, 2014. [Google Scholar]
- Liu, X.; Wang, M. How polycentric is urban China and why? A case study of 318 cities. Landsc. Urban Plan. 2016, 151, 10–20. [Google Scholar] [CrossRef]
- Berry, B.J.L. City Classification Handbook; John Wiley & Sons: Hoboken, NJ, USA, 1971. [Google Scholar]
- Pownall, L. The functions of New Zealand towns. Ann. Assoc. Am. Geogr. 1953, 43, 332–350. [Google Scholar] [CrossRef]
- Xu, F.; Zhou, Y. Function Classification of Chinese Cities and the Establishment of Classified Guidance Policy for Expanding Demestic Demand. Urban Stud. 2010, 17, 88–97. [Google Scholar]
- Ordos. China: A Modern Ghost Town. Available online: http://content.time.com/time/photogallery/0,29307,1975397,00.html (accessed on 5 September 2019).
- Chen, Z.; Haynes, K. Impact of high-speed rail on regional economic disparity in China. J. Transp. Geogr. 2017, 65, 80–91. [Google Scholar] [CrossRef]
- Guizhou Bureau of Statistics. 2018 Guizhou Statistical Yearbook; China Statistics Press: Beijing, China, 2018. [Google Scholar]
- Chen, Z.; Yu, B.; Ta, N.; Shi, K.; Yang, C.; Wang, C.; Zhao, X.; Deng, S.; Wu, J. Delineating Seasonal Relationships Between Suomi NPP-VIIRS Nighttime Light and Human Activity Across Shanghai, China. IEEE J. Sel. Top. Appl. Earth Obs. Remote Sens. 2019, 1–9. [Google Scholar] [CrossRef]
Figure 1. Spatial distribution of the study areas in China.

Figure 2. An example of the Spatial–Socioeconomic Urban Development Curve (SSUDC) for Shanghai.

Figure 3. Flowchart of SSUDC generation.

Figure 4. Spatial distribution of SSUDC coefficient of determination (R2) values in Mainland China.

Figure 5. Numbers of pixels in each artificial surface ratio (ASR) interval for Lhasa, Urumqi, and Jinhua.
Figure 5. Numbers of pixels in each artificial surface ratio (ASR) interval for Lhasa, Urumqi, and Jinhua.

Figure 6. Correlations between α and GDP per capita of all cities in (a) western region, (b) central region, and (c) eastern region.
Figure 6. Correlations between α and GDP per capita of all cities in (a) western region, (b) central region, and (c) eastern region.

Figure 7. Spatial distribution of (a) coefficient α and (b) coefficient β in Mainland China.

Figure 8. SSUDC coefficients (α and β) for 330 cities in Mainland China.

Figure 9. SSUDCs for four cities with significant differences in economy, size, and location (Shanghai, Urumqi, Linfen, and Zhangjiakou).
Figure 9. SSUDCs for four cities with significant differences in economy, size, and location (Shanghai, Urumqi, Linfen, and Zhangjiakou).

Figure 10. (a) SSUDC in Shanghai (b) SSUDC in Wuhan (c) Spatial distribution of the artificial surface ratio in Shanghai (d) Spatial distribution of the artificial surface ratio in Wuhan.
Figure 10. (a) SSUDC in Shanghai (b) SSUDC in Wuhan (c) Spatial distribution of the artificial surface ratio in Shanghai (d) Spatial distribution of the artificial surface ratio in Wuhan.

Figure 11. SSUDC coefficients for cities with different urban functional types.

Figure 12. SSUDC and the spatial distribution of the artificial surface ratio of (a) Ordos and (b) Guiyang.
Figure 12. SSUDC and the spatial distribution of the artificial surface ratio of (a) Ordos and (b) Guiyang.

© 2019 by the authors. Licensee MDPI, Basel, Switzerland. This article is an open access article distributed under the terms and conditions of the Creative Commons Attribution (CC BY) license (http://creativecommons.org/licenses/by/4.0/).
Share and Cite
MDPI and ACS Style
Yang, C.; Yu, B.; Chen, Z.; Song, W.; Zhou, Y.; Li, X.; Wu, J. A Spatial-Socioeconomic Urban Development Status Curve from NPP-VIIRS Nighttime Light Data. Remote Sens. 2019, 11, 2398. https://doi.org/10.3390/rs11202398
AMA Style
Yang C, Yu B, Chen Z, Song W, Zhou Y, Li X, Wu J. A Spatial-Socioeconomic Urban Development Status Curve from NPP-VIIRS Nighttime Light Data. Remote Sensing. 2019; 11(20):2398. https://doi.org/10.3390/rs11202398
Chicago/Turabian StyleYang, Chengshu, Bailang Yu, Zuoqi Chen, Wei Song, Yuyu Zhou, Xia Li, and Jianping Wu. 2019. "A Spatial-Socioeconomic Urban Development Status Curve from NPP-VIIRS Nighttime Light Data" Remote Sensing 11, no. 20: 2398. https://doi.org/10.3390/rs11202398
Note that from the first issue of 2016, this journal uses article numbers instead of page numbers. See further details here.