


ABSTRACT
Recent supernova (SN) and transient surveys have revealed an increasing number of non-terminal stellar eruptions. Though the progenitor class of these eruptions includes the most luminous stars, little is known of the pre-SN mechanics of massive stars in their most evolved state, thus motivating a census of possible progenitors. From surveys of evolved and unstable luminous star populations in nearby galaxies, we select a sample of yellow and red supergiant (RSG) candidates in M31 and M33 for review of their spectral characteristics and spectral energy distributions (SEDs). Since the position of intermediate- and late-type supergiants on the color–magnitude diagram can be heavily contaminated by foreground dwarfs, we employ spectral classification and multi-band photometry from optical and near-infrared surveys to confirm membership. Based on spectroscopic evidence for mass loss and the presence of circumstellar (CS) dust in their SEDs, we find that 30%–40% of the yellow supergiants are likely in a post-RSG state. Comparison with evolutionary tracks shows that these mass-losing, post-RSGs have initial masses between 20 and 40 M⊙. More than half of the observed RSGs in M31 and M33 are producing dusty CS ejecta. We also identify two new warm hypergiants in M31, J004621.05+421308.06 and J004051.59+403303.00, both of which are likely in a post-RSG state.
Export citation and abstract BibTeX RIS
1. INTRODUCTION
For many decades, the standard model of stellar evolution for massive stars (≥9 M⊙) was characterized as the progression from main-sequence OB star to red supergiant (RSG) to terminal supernova (SN) explosion. We now know that the evolutionary paths of massive stars, as well as their terminal state, depend strongly on mass loss and their mass-loss histories. It was recognized some time ago that stars above some initial mass (∼40–50 M⊙) do not evolve to the RSG stage (Humphreys & Davidson 1979); however, due to mass loss—possibly eruptive (Humphreys & Davidson 1994)—these massive stars return to higher temperatures, perhaps becoming luminous blue variables (LBVs) or Wolf–Rayet (WR) stars prior to their terminal state. Models of stellar interiors also show that as stars shed their outer layers, the mass fraction of the He core increases, and when it exceeds 60%–70% of the total, the star will evolve to higher temperatures (Giannone 1967).
Lower mass supergiants that enter the RSG stage will either end their lives as supernovae (SNe) II-P or in some cases evolve back to higher temperatures before the terminal explosion. Smartt et al. (2009) recently identified what they called "the RSG problem"—the lack of SN II-P and SN II-L progenitors with initial masses greater than 18 M⊙. RSGs between 18 and 30 M⊙ would presumably end their lives in some other manner. They might migrate on the H-R diagram (HRD) to higher temperatures before their terminal explosions.
The RSG stage is a well-established phase involving high mass loss. Mass-loss rates can be anywhere from 10−6 M⊙ yr−1 in RSGs (Mauron & Josselin 2011) to as high as 10−4 M⊙ yr−1 in extreme stars like VY CMa and in the warm hypergiants (Humphreys et al. 2013). The fraction of RSGs that return to higher temperatures, the physical characteristics of candidate post-RSGs, and their locations on the HRD are thus crucial to our understanding of the final stages of the majority of massive stars.
Due in part to their position on the HRD, few post-RSGs are known. As yellow supergiants (YSGs), with spectral types from late A to K, they occupy a transient state between the blue and red supergiants and may be evolving either from the main sequence to lower temperatures or back to higher temperatures from the RSG stage. Both populations represent a relatively short transition state. In the Galaxy, the warm hypergiants, close to the upper luminosity boundary in the HRD with high mass-loss rates, enhanced abundances, and dusty circumstellar (CS) environments, are excellent candidates for post-RSG evolution. These stars contrast with the intermediate-type YSGs, which have normal spectra in their long-wavelength spectral energy distributions (SEDs)—that is, no evidence for CS dust or mass loss in their spectra. de Jager (1998) has suggested that all of the mass-losing, high-luminosity F- and G-type supergiants are in a post-RSG state. The Galactic hypergiant IRC +10420 has long been acknowledged as a post-RSG (Jones et al. 1993; Oudmaijer et al. 1996). With its complex CS environment, large infrared excess, high mass-loss rate, and mass-loss history, it is in many ways the best example (Humphreys et al. 1997, 2002; Oudmaijer 1998; Shenoy et al. 2016). Others include HR 5171A and HR 8752 (Nieuwenhuijzen et al. 2012). In M33, the peculiar Variable A, a high-luminosity F-type hypergiant (Humphreys et al. 2006), with its apparent transit in the HRD to lower temperatures due to a high mass-loss episode is another candidate for post-RSG evolution. Humphreys et al. (2013, hereafter Paper I) has identified several additional warm hypergiants in M31 and M33 with dusty ejecta, strong stellar winds, and high mass-loss rates similar to their Galactic counterparts that are likely post-RSGs.
As part of our larger program on the luminous and variable stars in M31 and M33, in this paper we present a more comprehensive survey of the yellow and red supergiants. We use the presence of CS dust in their long-wavelength SEDs and spectroscopic indicators of mass loss and winds to identify candidates for post-RSG evolution. We likewise use the presence of a large infrared excess in the SEDs of the red or M-type supergiants to identify those with high mass loss. One of the greatest observational challenges is to separate the member supergiants from the significant foreground population of yellow and red dwarfs and halo giants in the Galaxy. In the next section, we describe our target selection, foreground contamination, and observations. In Section 3 we discuss the YSG population and our selection of the post-RSG candidates. The SEDs and the role of CS dust in the luminosities of the RSGs are presented in Section 4, and in Section 5 we present estimates of the mass loss for the dusty RSGs. In the last section, we discuss the resulting HRDs for the yellow and RSGs, and compare the candidate post-RSG population with evolutionary track models.
2. SAMPLE SELECTION AND OBSERVATIONS
2.1. Target List
Our targets were primarily selected from the published surveys of M31 and M33 for yellow and red supergiants (Drout et al. 2009, 2012; Massey et al. 2009). Their red and yellow candidates were all chosen from the Local Group Galaxies Survey (LGGS; Massey et al. 2007b). Although their adopted magnitude limit and color range for the YSGs (V < 18.5 and  ) correspond to those of F- and G-supergiants, the same color range will include a large fraction of foreground contamination from Galactic dwarfs and halo giants (Massey et al. 2006; Drout et al. 2012).
To establish membership for the yellow candidates, the M31 survey of Drout et al. (2009) relied on radial-velocity measurements. However, as their Figure 10 illustrates, even restricting the candidates to the velocity range expected for M31 includes substantial foreground contamination. Drout et al. (2009) therefore used a relative velocity—the measured velocity compared to the expected velocity of the star at its position in M31—to establish probable membership. They identified 54 rank-1 (highly probable) and 66 rank-2 (likely) YSGs in M31 from a sample of 2901 targets. The 96% foreground contamination clearly demonstrates the difficulties of color and magnitude criteria for determining membership.
For the candidate YSGs in M33 (Drout et al. 2012), the authors again relied on the relative radial velocities, but also added a measurement of the strong luminosity-sensitive O i λ7774 blend in A- and F-type supergiants, which greatly increased the probability that the stars were supergiant members. With these criteria, they identified 121 rank-1 YSGs and 14 rank-2 in M33.
Fortunately for the RSG candidates, the two-color B − V versus V − R diagram has been demonstrated to be an effective metric for distinguishing red dwarfs and supergiants (Massey et al. 2009; Drout et al. 2012), from which the authors identify 437 RSG candidates in M31 and 408 in M33. For the M31 candidates, 124 had additional radial-velocity information for membership determination, and 16 were spectroscopically confirmed as M-type supergiants. For M33, the 408 candidate RSGs from Drout et al. (2012) were reduced to 204 (189 rank-1, 15 rank-2) likely RSGs using radial-velocity criteria.
In addition to the 120 and 135 YSG candidates from the Drout/Massey catalogs of M31 and M33, respectively, we include 18 confirmed YSGs from Humphreys et al. (2014, hereafter Paper II), seven warm hypergiants from Paper I, 39 Hα emission stars with intermediate colors from the survey by Valeev et al. (2010), and seven Hα emission sources from an unpublished survey by K. Weis (see Paper II). With these catalogs, we assembled a final target list of 124 and 165 candidate YSGs (after cross-identification among the listed works) for spectroscopy from M31 and M33. We did not obtain follow-up spectroscopy of the RSG candidates; our discussion of them instead relies on published photometry and analysis of their SEDs for CS dust (Section 4).
2.2. Observations
Our spectra of the YSG candidates were obtained with the Hectospec Multi-Object Spectrograph (Fabricant et al. 1998, 2005) on the MMT at Mount Hopkins over several observing sessions in 2013, 2014, and 2015. The Hectospec has a 1° field of view with 300 fibers each subtending 1 5 on the sky. We used the 600 line mm−1 grating with a tilt of 4800 Å, yielding ≈2500 Å coverage with 0.54 Å pixel−1 resolution and R of ∼2000. The same grating with a tilt of 6800 Å was used for the red spectra with similar coverage and resolution and R of ∼3600. The total integration time for each field was 90 minutes for the red and 120 minutes for the blue. The journal of observations is in Table 1.
Table 1. Journal of Observations
| Target | Date | Exp. Time | Grating, Tilt |
|---|---|---|---|
| (UT) | (minutes) | ||
| M31A-Blue | 2013 Sep 25 | 120 | 600l, 4800 Å |
| M31A-Red | 2013 Sep 26 | 90 | 600l, 6800 Å |
| M31B-Blue | 2013 Oct 12 | 120 | 600l, 4800 Å |
| M31B-Red | 2013 Oct 9 | 90 | 600l, 6800 Å |
| M33-Blue | 2013 Oct 7 | 120 | 600l, 4800 Å |
| M33-Red | 2013 Oct 7 | 90 | 600l, 6800 Å |
| M33-Blue | 2014 Nov 29 | 120 | 600l, 4800 Å |
| M33-Red | 2014 Nov 16 | 90 | 600l, 6800 Å |
| M31A-Blue | 2015 Sep 20 | 120 | 600l, 4800 Å |
| M31A-Red | 2015 Sep 20 | 90 | 600l, 6800 Å |
| M31B-Blue | 2015 Sep 20 | 120 | 600l, 4800 Å |
Download table as: ASCIITypeset image
Due to the large angular size of M31 on the sky, observations of this galaxy were split across two fields, labeled A and B in Table 1, centered at 00:43:36.5 + 41:32:54.6 and 00:41:15.9 + 40:40:31.2, respectively. Weather conditions at Mount Hopkins during the 2015 season prevented observations on the last set of supergiant candidates in the red filter setting.
The spectra were reduced using an exportable version of the CfA/SAO SPECROAD package for Hectospec data.1 The spectra were bias-subtracted, flat-fielded, and wavelength-calibrated. Due to crowding, sky subtraction was performed using preselected sky fibers off the field of each galaxy. These sky fiber positions were chosen from Hα maps in regions where nebular contamination would be minimized. Flux calibration was done in IRAF using standard stars Feige 34 and 66 from Hectospec observations during the 2013–2015 seasons.
In M31, we obtained spectra for 113 of the 120 YSG candidates from Drout et al. (2009) plus follow-up spectra for the 10 previously confirmed warm supergiant and hypergiant stars from Papers I and II (six of which were cross-listed in the Drout catalog) for a total of 117 spectra. In M33, 71 of the 135 YSG candidates from Drout et al. (2012) were observed, plus 14 confirmed supergiants from Papers I and II (four cross-listed in the Drout catalog), and 37 Hα-emission sources from Valeev et al. (2010) (15 cross-listed in the Drout and Humphreys catalogs) for a total of 103 spectra. For all of these sources, as well as the remaining YSG candidates from the Drout catalogs for which we did not observe spectra, we obtain photometry from published catalogs, discussed in Section 3.2.
3. THE INTERMEDIATE-TYPE OR YELLOW SUPERGIANTS
3.1. Spectral Characteristics
Our primary goal for the spectroscopy of the YSG candidates is to search for evidence of mass loss and winds from emission lines and P Cygni profiles when present. Since foreground contamination is an obstacle for identifying yellow and RSG members in external galaxies, the same spectra can be used for spectral and luminosity classification. We refine the classification of the YSG candidates with established luminosity and spectral type indicators in the blue and red spectra.
The blends of Ti ii and Fe ii at λλ4172–4178 and λλ4395–4400 are strong luminosity criteria in the blue when compared against Fe i lines that show little luminosity sensitivity such as λ4046 and λ4271. The O iλ7774 triplet in the red spectra is also a particularly strong luminosity indicator in A- to F-type supergiants. This feature is present in all of the candidate YSGs from M33, since Drout et al. (2012) identified all probable members based on this criterion.
The Sr iiλλ4077, 4216 lines are especially useful for temperature classifications of the YSGs. Comparing the relative strength of Sr iiλ4077 to the nearby Hδ feature, and the relative strengths of the Fe iiλ4233 and Ca iλ4226 lines, for example, provides a quick diagnostic for all F-type supergiants.
Later type supergiants (G-type) are identified by the growth of the G-band, a wide absorption feature around λ4300 Å due to CH. Luminosity criteria for G-type stars are similar to those in F supergiants. The Mg i triplet λλ5167, 5172, 5183 is strong in the later type dwarfs and allows for filtering foreground contaminants from our sample.
In M31, we identify 75 YSGs, including the previously confirmed stars from Papers I and II. Seventy of the 113 observed stars from Drout et al. (2009) are confirmed YSGs, and 42 are foreground dwarfs or subgiants. Therefore, the M31 catalog of Drout et al. (2009) was ∼35% contaminated by foreground stars. The remaining eight rank-1/rank-2 candidates of Drout et al. (2009) for which we did not obtain spectra are analyzed in Section 3.3 for evidence of mass loss in their SEDs along with the confirmed YSGs. We identify 86 YSGs in M33, which also includes the warm supergiants and hypergiants discussed in Papers I and II. Sixty-two of the 71 observed candidates from Drout et al. (2012) are spectroscopically confirmed as YSGs. The remaining nine observed sources were identified as foreground dwarfs. Thus, the M33 catalog was only ∼7% contaminated by foreground stars. Since their M33 survey used the luminosity-sensitive O iλ7774 line in addition to relative velocities, the cleaner sample is not surprising.
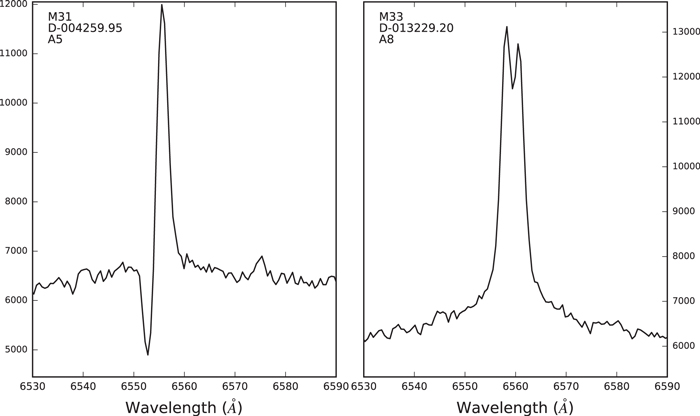
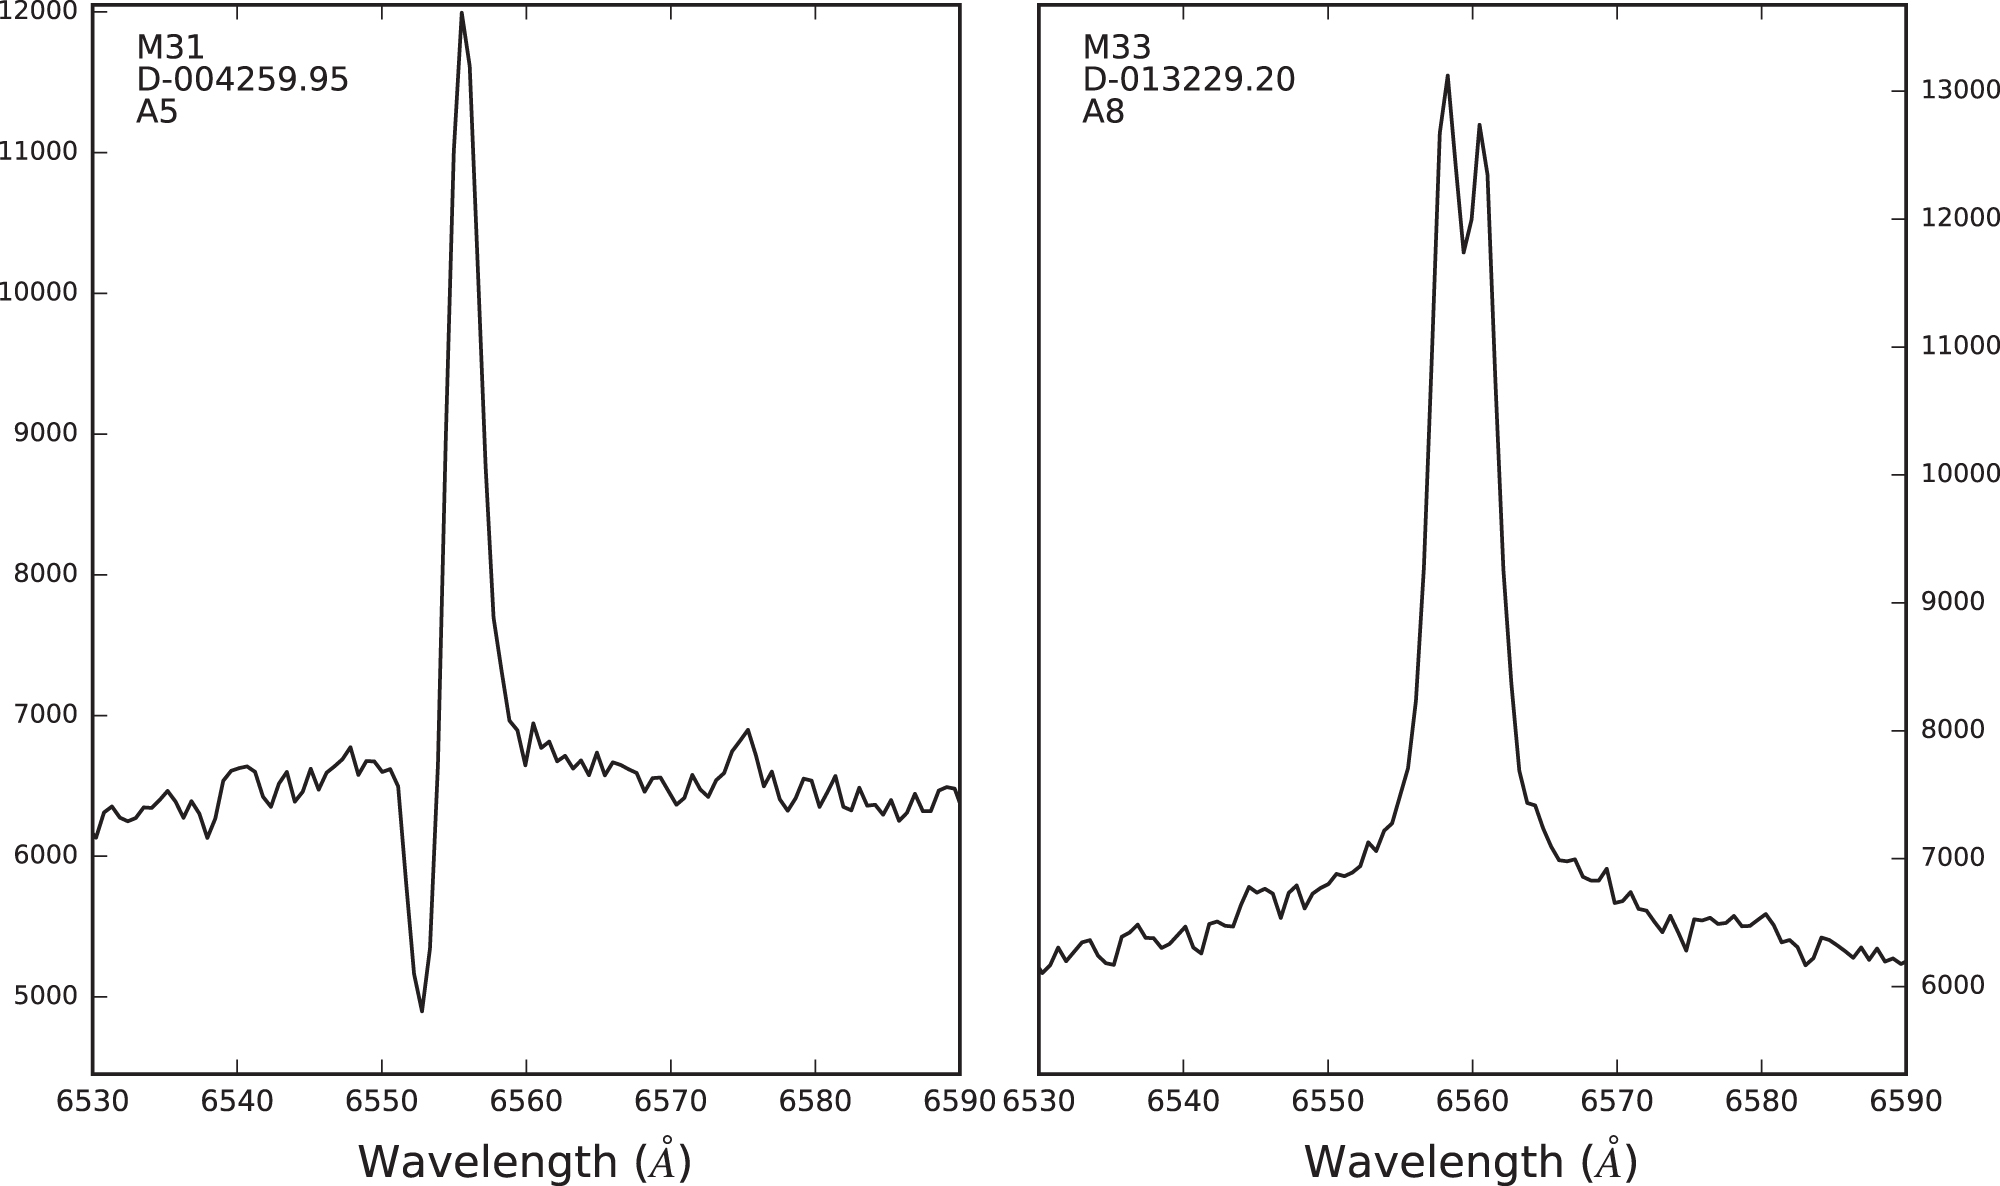
Twelve YSGs in M31—including the hypergiants M31-004322.50, M31-004444.52, M31-004522.58, and hypergiant candidate J004621.08+421308.2 (see Section 3.4)—and 18 in M33 (including hypergiants B324, Var A, N093351, and N125093) exhibit spectroscopic evidence for stellar winds. The notable spectral features include P Cygni profiles in the hydrogen emission lines, broad wings in Hα or Hβ emission indicative of Thomson scattering, and [Ca ii]/Ca ii triplet emission. Example spectra are shown in Figure 1, highlighting two stars with Hα emission indicative of stellar winds and CS outflows.

Figure 1. Two yellow supergiant spectra with Hα emission. The broad wings in both spectra are indicative of Thomson scattering. D-004259.95 (left) has strong P Cygni absorption, while D-013229.20 (right) has double-peaked emission suggesting bipolar outflow or a rotating circumstellar disk. Spectra are plotted in arbitrary counts for display.
Download figure:
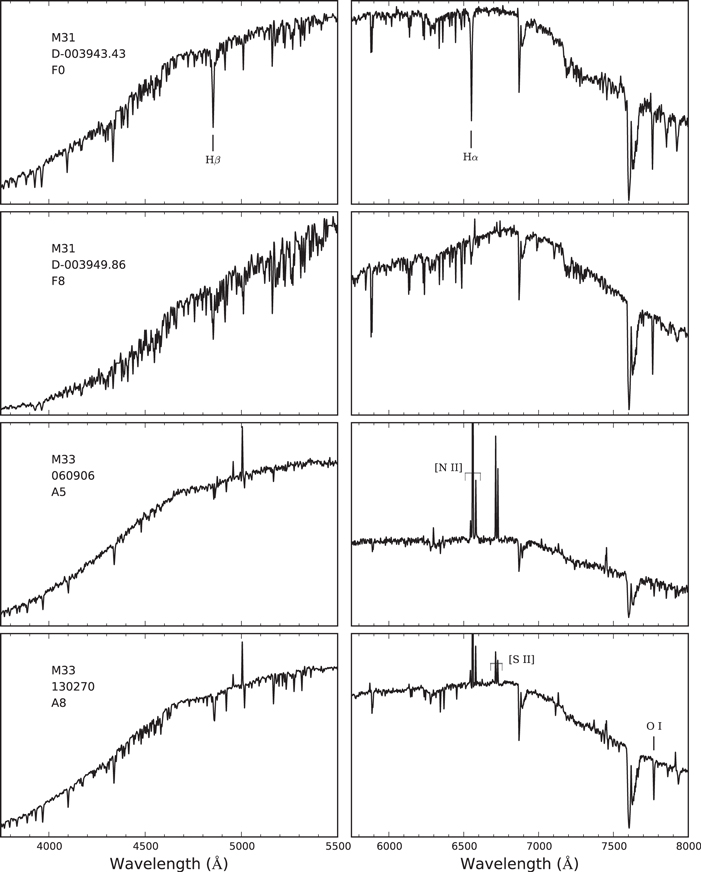
Standard image High-resolution imageWe find that approximately 17% of the observed YSGs in M31 and 21% in M33 demonstrate evidence for mass loss in their spectra. We discuss the evidence for CS dust ejecta in their SEDs in Section 3.3. Representative A- and F-type supergiants from both galaxies are illustrated in Figure 2.

Figure 2. Sample A- and F-type supergiant spectra from M31 and M33. Spectra are not flux-calibrated or rectified.
Download figure:
Standard image High-resolution imageTable 2 is a list of the confirmed YSGs in both galaxies, 75 in M31 and 86 in M33, with their spectral types. Notes to the table include comments on the evidence for winds and mass loss in their spectra and references to cross-identified objects. The rank is included for stars from the Drout surveys. Table 9 lists all of the foreground stars—confirmed dwarfs and subgiant stars.2
Table 2. Spectroscopically Confirmed YSGs
| Star Name | R.A. | Decl. | Spec. Type | Notes | Alt. Desig./Ref.a | Rankb |
|---|---|---|---|---|---|---|
| M31 | ||||||
| M31-004247.30 | J004247.30 | +414451.0 | F5 | ⋯ | Paper II | 2 |
| M31-004322.50 | J004322.50 | +413940.9 | A8–F0 | warm hypergiant | Paper I | |
| M31-004337.16 | J004337.16 | +412151.0 | F8 | ⋯ | Paper II | 2 |
| M31-004350.50 | J004350.50 | +414611.4 | A5 | P Cyg H em | Paper II | 2 |
| J004410.62 | +411759.7 | F2 | ⋯ | ⋯ | 2 | |
| M31-004424.21 | J004424.21 | +412116.0 | F5 | ⋯ | Paper II | 2 |
| J004427.76 | +412209.8 | F5 | neb em | ⋯ | 2 | |
| J004428.99 | +412010.7 | F0 | ⋯ | ⋯ | 2 | |
| M33 | ||||||
| M33C-4640 | J013303.09 | +303101.8 | A0–2 | weak He i, Fe ii em | Paper II | ⋯ |
| J013303.40 | +303051.2 | F5 | neb em | V-021266 | 1 | |
| J013303.60 | +302903.4 | F8–G0 | G-band | ⋯ | 1 | |
| J013311.70 | +302258.9 | F0–2 | ⋯ | V-028576 | ⋯ | |
| J013410.61 | +302600.5 | F5–8 | ⋯ | V-119710 | ⋯ | |
| M33-013442.14 | J013442.14 | +303216.0 | F8 | ⋯ | Paper II | 1 |
| J013446.93 | +305426.5 | A2 | ⋯ | ⋯ | 1 | |
Notes.
aA prefix V- or N indicates the source identification is from Valeev et al. (2010). bRanks from Drout et al. (2009, 2012) specify if the source was a (1) "highly likely" or (2) "possible" supergiant.Only a portion of this table is shown here to demonstrate its form and content. A machine-readable version of the full table is available.
Download table as: DataTypeset image
Reduced spectra for the confirmed YSGs and foreground stars observed from 2013 to 2015 can be found at http://etacar.umn.edu/LuminousStars/M31M33/.
3.2. Multi-wavelength Photometry
For each source in our target list, we cross-identify the visual photometry from the LGGS (Massey et al. 2006) with the near- and mid-infrared photomery from 2MASS (Skrutskie et al. 2006) at J, H, and Ks, the Spitzer/IRAC surveys of M31 (Mould et al. 2008) and M33 (McQuinn et al. 2007; Thompson et al. 2009) at 3.6, 4.5, 5.8, and 8 μm, and WISE (Wright et al. 2010) at 3.4 μm (W1), 4.6 μm (W2), 12 μm (W3), and 22 μm (W4). For cross-identification between the 2MASS and IRAC coordinates, we use a search radius of 05.
The WISE satellite has angular resolutions of 61, 64, 65, and 120 in the four bands, which presents some issues for cross-identification in the crowded M31 and M33 fields. We selected a 6'' search radius for matching the LGGS/2MASS coordinates to WISE, which is consistent with the FWHM of the WISE point-spread function at 3.4 μm (Wright et al. 2010). Since the longer-wavelength photometry has such a large beamsize, we recognize that some of our matched candidates may contain multiple sources or be contaminated by polycyclic aromatic hydrocarbon (PAH) emission. To mitigate this, the prime candidates for CS dust (as characterized by infrared excess in the WISE bands, Section 3.3) were each checked visually in the 2MASS Ks-band images, and the photometry was rejected if the sources were likely composites. The resulting multi-wavelength photometry for the spectroscopically confirmed YSGs, as well as the YSG candidates, is summarized in Table 3.
Table 3. Photometry of YSGs and YSG Candidates
| Star Namea | U | B | V | R | I | J | H | K | 3.6 μmb | 4.5 μm | 5.8 μm | 8.0 μm | 3.4 μmc | 4.6 μm | 12 μm | 22 μm | Var.d |
|---|---|---|---|---|---|---|---|---|---|---|---|---|---|---|---|---|---|
| M31 | |||||||||||||||||
| D-003907.59 | 18.0 | 17.6 | 16.7 | 16.3 | 15.8 | 15.3 | 14.8 | 14.9 | ⋯ | ⋯ | ⋯ | ⋯ | 14.6 | 14.5 | 12.1 | 9.1 | ⋯ |
| D-004009.13 | 19.1 | 18.5 | 17.6 | 17.2 | 16.8 | 16.1 | 15.8 | 15.4 | 14.9 | 14.3 | 14.3 | 13.7 | 14.8 | 14.3 | 12.3 | 8.8 | ⋯ |
| M31-004247.30 | 17.1 | 16.9 | 16.4 | 16.0 | 15.6 | 15.3 | 15.0 | 15.0 | ⋯ | ⋯ | ⋯ | ⋯ | 14.6 | 14.6 | 11.6 | 8.3 | ⋯ |
| D-004255.16 | 19.1 | 18.7 | 17.8 | 17.3 | 16.8 | 16.1 | 15.7 | 15.5 | ⋯ | ⋯ | ⋯ | ⋯ | ⋯ | ⋯ | ⋯ | ⋯ | ⋯ |
| M31-004337.16 | 18.6 | 17.2 | 17.0 | 16.6 | 16.1 | 15.8 | 15.4 | 15.5 | 14.4 | 14.5 | 13.6 | 12.7 | 14.6 | 14.1 | 11.4 | 8.6 | V |
| M33 | |||||||||||||||||
| D-013231.94 | 18.5 | 18.1 | 17.4 | 17.0 | 16.6 | ⋯ | ⋯ | ⋯ | 15.3 | 15.1 | ⋯ | ⋯ | 14.4 | 14.1 | 9.4 | 6.5 | ⋯ |
| Var A | 20.1 | 19.8 | 18.8 | 18.2 | 17.7 | ⋯ | ⋯ | ⋯ | 13.3 | 12.2 | 11.4 | 10.2 | 13.2 | 12.0 | 8.8 | 7.4 | V |
| M33C-4640 | 16.4 | 17.1 | 17.0 | 16.9 | 16.7 | ⋯ | ⋯ | ⋯ | 16.2 | 16.6 | ⋯ | ⋯ | 16.6 | 15.9 | 12.8 | 8.9 | ⋯ |
| D-013439.98 | 17.6 | 17.3 | 16.8 | 16.5 | 16.1 | 15.7 | 15.4 | 15.2 | 15.0 | 15.0 | ⋯ | ⋯ | 15.2 | 15.0 | 12.6 | 8.8 | ⋯ |
| M33C-013442.14 | 18.4 | 18.2 | 17.3 | 16.9 | 16.4 | 16.0 | 15.2 | 14.6 | 13.7 | 13.2 | ⋯ | 11.7 | 13.8 | 13.0 | 10.4 | 8.1 | ⋯ |
Notes.
aD- indicates that the source was listed in Drout et al. (2009, 2012) with the name specifying the R.A. coordinate of its LGGS ID. M31- or M33C- indicates a star name given in Paper I or II. The shorthand naming convention is for ease of matching to other tables in this paper. The complete R.A. and Decl. designations are provided in Table 2 and in the electronic version. b3.6, 4.5, 5.8, and 8.0 μm photometry from Spitzer/IRAC. c3.4, 4.6, 12, and 22 μm photometry from WISE. dIndicates that the source was identified as variable in the IRAC bands in Mould et al. (2008) for M31 or McQuinn et al. (2007) for M33, or variable in the optical from the DIRECT survey (Kaluzny et al. 1998; Macri et al. 2001) and from Hartman et al. (2006) for M33.Only a portion of this table is shown here to demonstrate its form and content. A machine-readable version of the full table is available.
Download table as: DataTypeset image
Mould et al. (2008) and McQuinn et al. (2007) additionally provide catalogs of infrared variable sources in M31 and M33, respectively. We checked each source for variability against those catalogs, as well as the DIRECT survey (Kaluzny et al. 1998; Macri et al. 2001), and find low-amplitude fluctuations (<0.1 mag) in the IRAC bands, most likely associated with Alpha Cygni variability. For M33 sources, we also checked against the optical survey of Hartman et al. (2006) and find similarly low-level flux variability in g', r', and i' band observations. YSGs and YSG candidates that show variability in either the optical or infrared are indicated in Table 3.
3.3. Extinction Correction and the Spectral Energy Distributions
To determine whether the YSGs have excess free–free emission in the near-infrared (1–2 μm) due to stellar winds and/or an excess at longer wavelengths due to CS dust, we must first correct the SEDs for interstellar extinction. Many of these targets are likely embedded in their own CS ejecta or warm CS dust. Additionally, we have noticed in our previous work that the extinction can vary considerably across the face of these galaxies, especially in M31. Drout et al. (2009) assumed a fixed  reddening law for all YSGs in M31, and Drout et al. (2012) similarly adopted
  for sources in M33. We instead proceed more conservatively and calculate the extinction for each source individually.
For those stars with spectral types, we compare the observed B − V color to the intrinsic colors of supergiants from Flower (1977) and calculate AV from the standard extinction curves (Cardelli et al. 1989) with R = 3.2. This procedure is uncertain for stars with strong emission lines in their spectra, so we also estimate the visual extinction using two other methods: the reddening-free Q-method (Hiltner & Johnson 1956; Johnson 1958) for nearby OB-type stars in the LGGS within 2–3'' of each target, assuming that their UBV colors are normal, and the relation between the neutral hydrogen column density (NH) and the color excess,  (Savage & Jenkins 1972; Knapp et al. 1973).3
We measure NH from the recent H i surveys of M31 (Braun et al. 2009) and M33 (Gratier et al. 2010). Since we do not know the exact location of the stars along the line of sight with respect to the neutral hydrogen, we follow Paper II and define the total AV as the foreground AV (≈0.3 mag) plus half of the measured NH. Since the H i surveys have spatial resolutions of 30'' and 17'' for M31 and M33, respectively, we favor the extinction estimates from the two other methods when available. We use the Q-method and NH measurements for the supergiant candidates for which we did not obtain spectra. The results from these different methods, the adopted AV, and the resulting extinction-corrected MV are summarized in Table 4.
Table 4. Extinction and Luminosities of YSGs and YSG Candidates
| Star Name | Spec. Type | AV (colors) | AV (stars) | AV (NH) | Adopted AV | MV | MBola |
|---|---|---|---|---|---|---|---|
| M31 | |||||||
| D-003926.72 | A2 | 0.7 | 0.7 | 1.4 | 0.7 | −7.1 | −7.3 |
| D-003936.96 | ... | ... | 0.9 | 0.5 | 0.9 | −7.2 | −7.5* |
| D-003948.85 | F2–5 | 1.2 | ... | 1.0 | 1.2 | −8.3 | −8.4 |
| M31-004247.30 | F5 | 0.6 | ... | 0.9 | 0.6 | −8.7 | −8.9* |
| M31-004522.58 | A2 | 0.4 | 1.4 | 1.1 | 0.4 | −6.4 | −7.2* |
| M33 | |||||||
| M33C-4640 | A0–2 | 0.6 | 0.6 | 0.6 | 0.6 | −8.1 | −8.3 |
| N045901 | F5 | 1.2 | 0.9 | 0.5 | 1.2 | −8.5 | −8.4* |
| V071501 | A5 | 0.6 | ... | ... | 0.6 | −7.0 | −7.0 |
| N125093 | F0–2 | ... | ... | 0.8 | 0.8 | −8.8 | −8.9* |
| D-013439.73 | A5–8 | 0.6 | 0.9 | 0.6 | 0.6 | −8.0 | −8.0 |
Note.
aIndicates the presence of an IR excess, and thus MBol was calculated by integrating the SED out to the mid-infrared.Only a portion of this table is shown here to demonstrate its form and content. A machine-readable version of the full table is available.
Download table as: DataTypeset image
For the spectroscopically confirmed YSGs with known spectral types, we calculate the bolometric luminosities by applying bolometric corrections from Flower (1996) to MV. Bolometric corrections for stars in this temperature range are small, typically  mag. For the candidate supergiants without spectra, we integrate the SED from the optical to the 2MASS Ks band (2.2 μm). If the SEDs show an infrared excess, and thus evidence of CS dust, we integrate the SED out to the IRAC 8 μm band and/or the 22 μm WISE band if available and if not obviously contaminated by nebulosity in the beam. Those sources are indicated with an asterisk in Table 4.
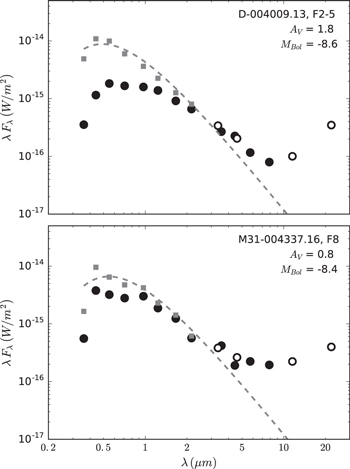
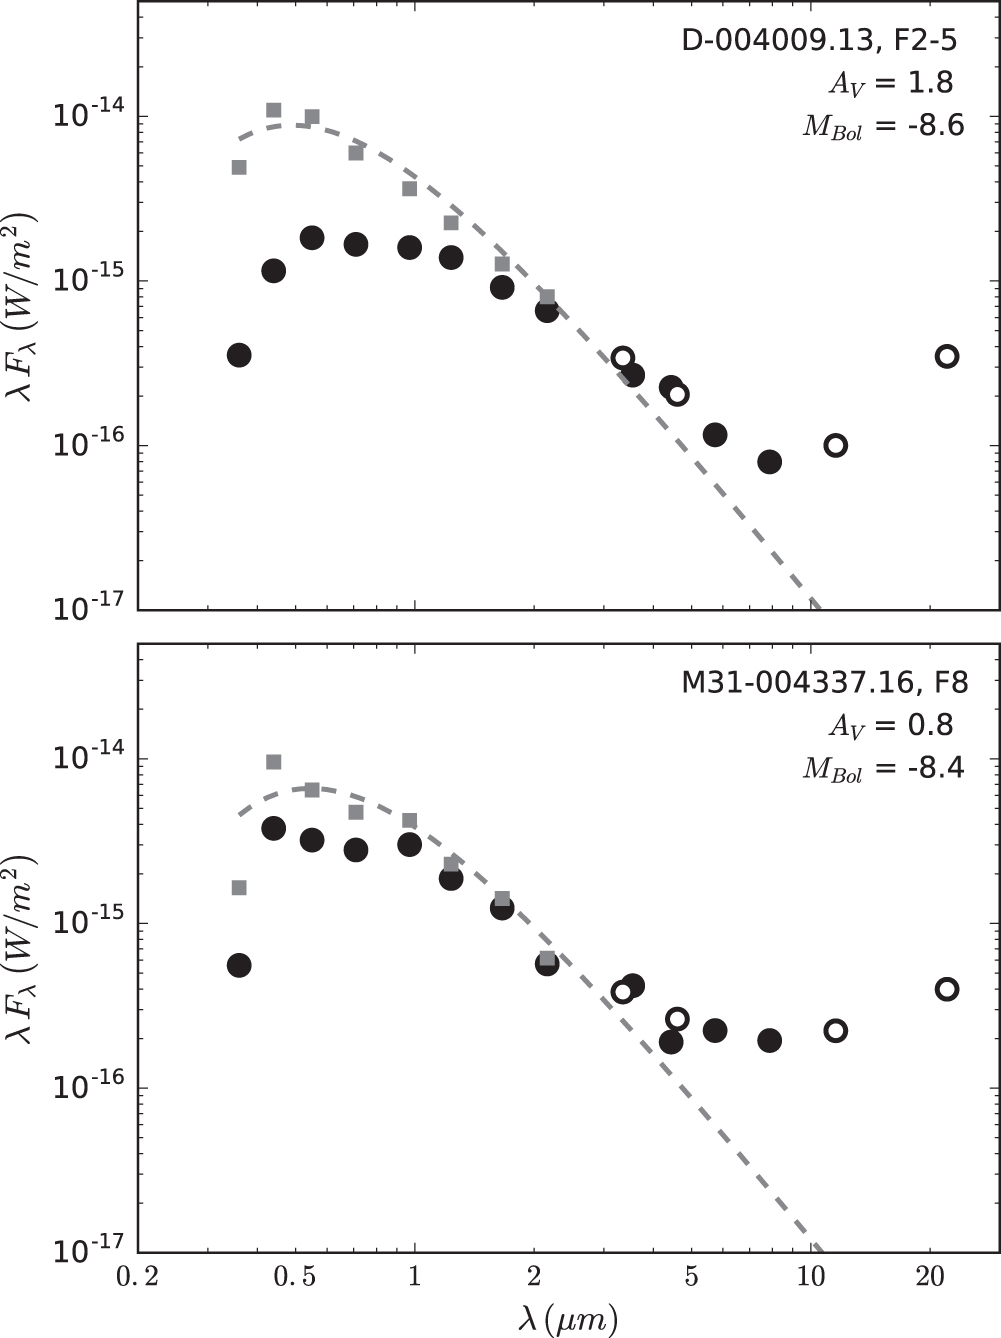
Figures 3 and 4 are example SEDs from supergiants in M31 and M33. The observed visual, 2MASS, and IRAC magnitudes are shown as filled circles, and the WISE data as open circles. The optical and 2MASS extinction-corrected photometry is shown as gray squares. We fit a blackbody curve to the extinction-corrected optical photometry to model the contribution from the central star. If the flux in the near-infrared 2MASS, and IRAC bands exceeds the expected Rayleigh–Jeans tail of the stellar component, we identify this as an infrared excess. Many of the supergiants in our sample show the characteristic upturn redward of 8 μm due to PAH emission (Draine & Li 2007). Due to the large beamsize of WISE, it is likely that some sources are contaminated by PAH emission from H ii regions in the mid-infrared. However, if a source also has an apparent excess in the near-infrared 2MASS and IRAC bands, the infrared photometry provides evidence of mass loss. An infrared excess in the 1–2 μm 2MASS bands is characteristic of free–free emission in stellar winds, with the 3.6–8 μm IRAC data providing evidence for warm CS dust. Free–free emission is generally identified as constant Fν in the near-infrared, often extending out to 5 μm (see Figure 6). The IRAC photometry can be used to estimate the mass of the dusty CS material (see Section 5.1). We note that the data provided in the broadband visual (LGGS), near-infrared (2MASS), and mid-infrared (IRAC and WISE) photometry were not all observed simultaneously. The resulting SEDs, then, do not represent a single snapshot in time.

Figure 3. SEDs of two F-type supergiants in M31. The observed visual, 2MASS, and IRAC magnitudes are shown as filled circles, and the WISE data as open circles. The extinction-corrected photometry is plotted as filled squares. The SEDs of both stars show evidence for circumstellar dust. The dotted gray lines represent blackbody fits to the optical components of the SEDs, with color temperatures of 7500 and 6700 K for top and bottom. While D-004009.13 shows the characteristic PAH upturn in the W3 and W4 bands, its SED has an excess between 3 and 8 μm; therefore, its infrared excess is very likely a combination of free–free emission, CS dust emission, and H ii region contamination from PAH emission. MBol is calculated by integrating the SED through the IRAC bands.
Download figure:
Standard image High-resolution image
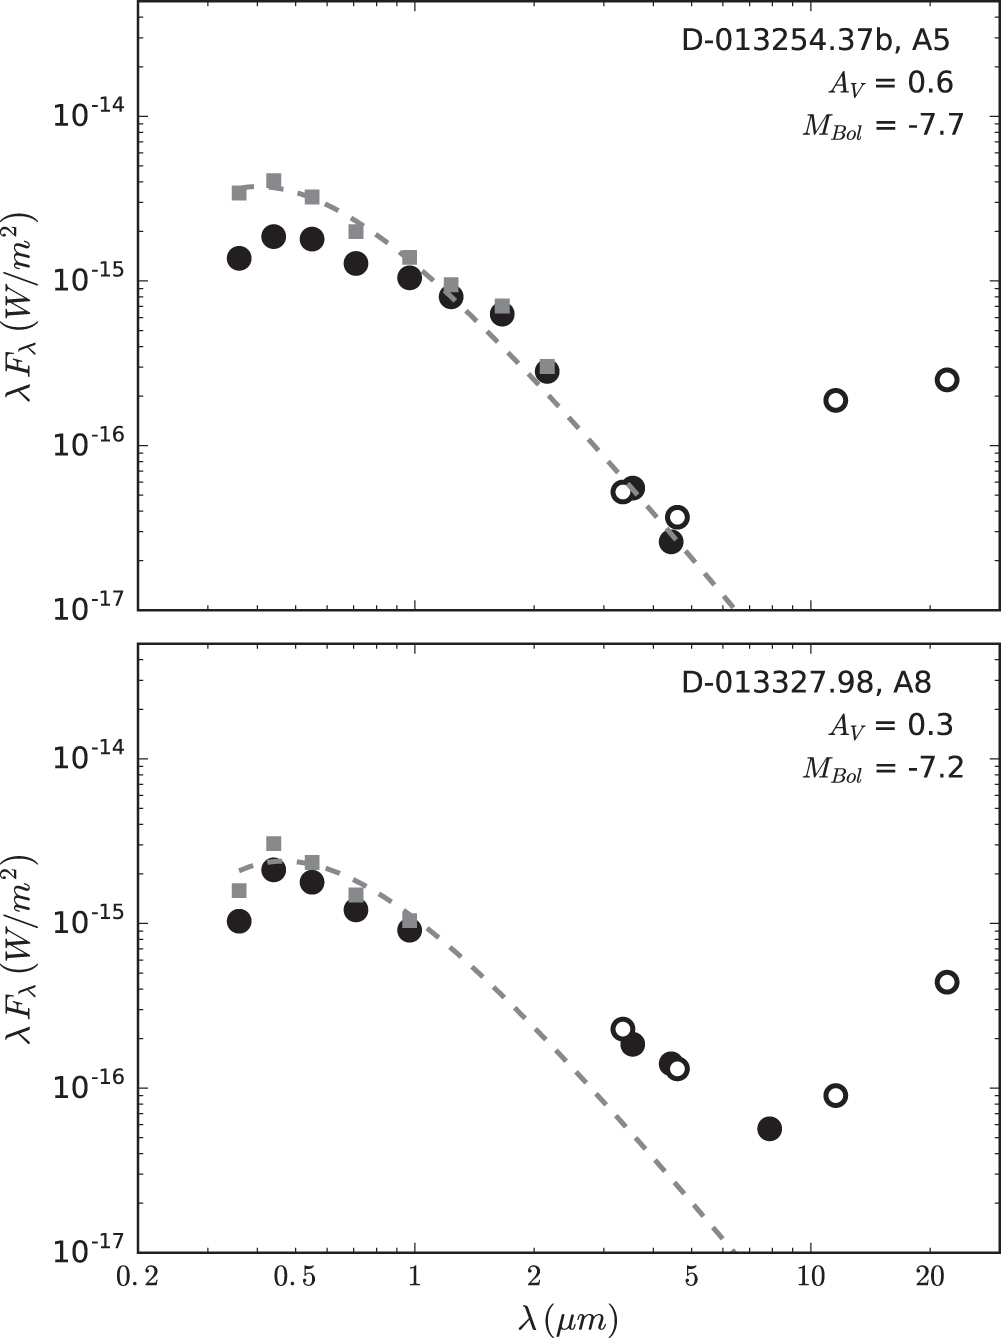
Figure 4. SEDs of two warm supergiants in M33. The symbols are the same as in Figure 3. The upturn at 12–22 μm in both stars is most likely due to nebulosity. While D-013254.37b has evidence for free–free emission as an excess in 2MASS H and Ks bands, it is unlikely that this star has dusty CS ejecta. Though D-013327.98 has no 2MASS photometry, the obvious infrared excess in the IRAC bands suggests the presence of significant mass loss through dust. The color temperatures of the blackbody fits to the optical photometry are 8500 and 7900 K for the top and bottom panels.
Download figure:
Standard image High-resolution imageTwenty-six YSG candidates have indicators for free–free emission in the near-IR 2MASS photometry and/or CS dust emission in the mid-IR IRAC or WISE bands. D-004009.13, as its SED in Figure 3 shows, likely has both nebular contamination and dust. Combining both the spectroscopic and photometric data, we find a total of 32 sources in M31 with evidence for mass loss either from the stellar wind features in their spectra or free–free/CS dust emission in their SEDs. Six show evidence for both: the warm hypergiants M31-004322.50, M31-004444.52, M31-004522.58, the new hypergiant J004621.08+421308.2 (see Section 3.4), and two F-type supergiants, M31-004424.21 and M31-004518.76. We do not have spectra for two of the sources with evidence of free–free emission, D-003745.264 and D-003936.96, so we cannot confirm membership in M31. Therefore, of the 75 confirmed YSGs in M31, 30 (or 40%) are likely post-RSG candidates, plus two sources that require follow-up spectroscopy to confirm supergiant status. Five sources (D-003711.98, D-003725.57, D-003907.59, D-004102.78, D-004118.69) are likely contaminated with nebular PAH emission from nearby H ii regions.
In M33, 22 stars show evidence for free–free emission and/or CS dust emission in their SEDs. Combining the spectroscopic and photometric data indicators, we find a total of 30 sources in M33 with evidence for mass loss. Nine have both the spectroscopic stellar wind and CS dust features: the warm hypergiants Var A, M33-013442.14, N093351, N125093, and the supergiants V002627, D-013233.85, V021266, V130270, V104958. Three of the sources have not been spectroscopically confirmed as members of M33 (D-013345.50, D-013349.85, D-013358.05).5 Therefore, of the 86 confirmed YSGs in M33, we identify 27 (or ∼31%) as likely post-RSG candidates, plus three sources requiring follow-up spectroscopy. Thirty-three sources show evidence for nebular PAH contamination.
In Table 5 we list all the stars, both confirmed and unconfirmed YSGs, that show at least one indicator of CS ejecta: spectroscopic evidence of a stellar wind, free–free emission, and/or thermal dust emission in the SED. If the stellar spectrum contains nebular emission markers such as [O iii], we indicate in the table that the source is likely contaminated with nebular emission. Estimates of total mass lost are discussed in Section 5.1.
Table 5. YSG and YSG Candidates with Evidence for Stellar Winds and CS Dust
| Star Name | Spec. Type | Wind | IR excess | Comments | Mass Lost (M⊙)a |
|---|---|---|---|---|---|
| M31 | |||||
| D-004009.13 | F2–5 | ... | yes | CS dust | 0.07±0.01 × 10⁻² |
| M31-004322.50 | A8–F0 | yes | yes | CS dust | 0.08±0.01 × 10⁻² |
| M31-004337.16 | F8 | ... | yes | CS dust | 0.17±0.02 × 10⁻² |
| M31-004424.21 | F5 | yes | yes | CS dust | 1.42±0.18 × 10⁻² |
| M31-004444.52 | F0 | yes | yes | CS dust | 1.74±0.22 × 10⁻² |
| M33 | |||||
| D-013231.94 | F2 | yes | yes | CS dust | 0.76±0.09 × 10⁻² |
| Var A | F8 | yes | yes | CS dust | 2.36±0.28 × 10⁻² |
| D-013349.86 | F8 | ... | yes | CS dust | 0.87±0.10 × 10⁻² |
| M33-013357.73 | A0 | yes | yes | CS nebula, H ii PAH | ... |
| N093351 | F0 | yes | yes | CS dust | 2.06±0.24 × 10⁻² |
Note.
aTotal mass lost through circumstellar ejecta estimated from IRAC/WISE photometry. See Section 5.1.Only a portion of this table is shown here to demonstrate its form and content. A machine-readable version of the full table is available.
Download table as: DataTypeset image
3.4. Two New Hypergiants in M31
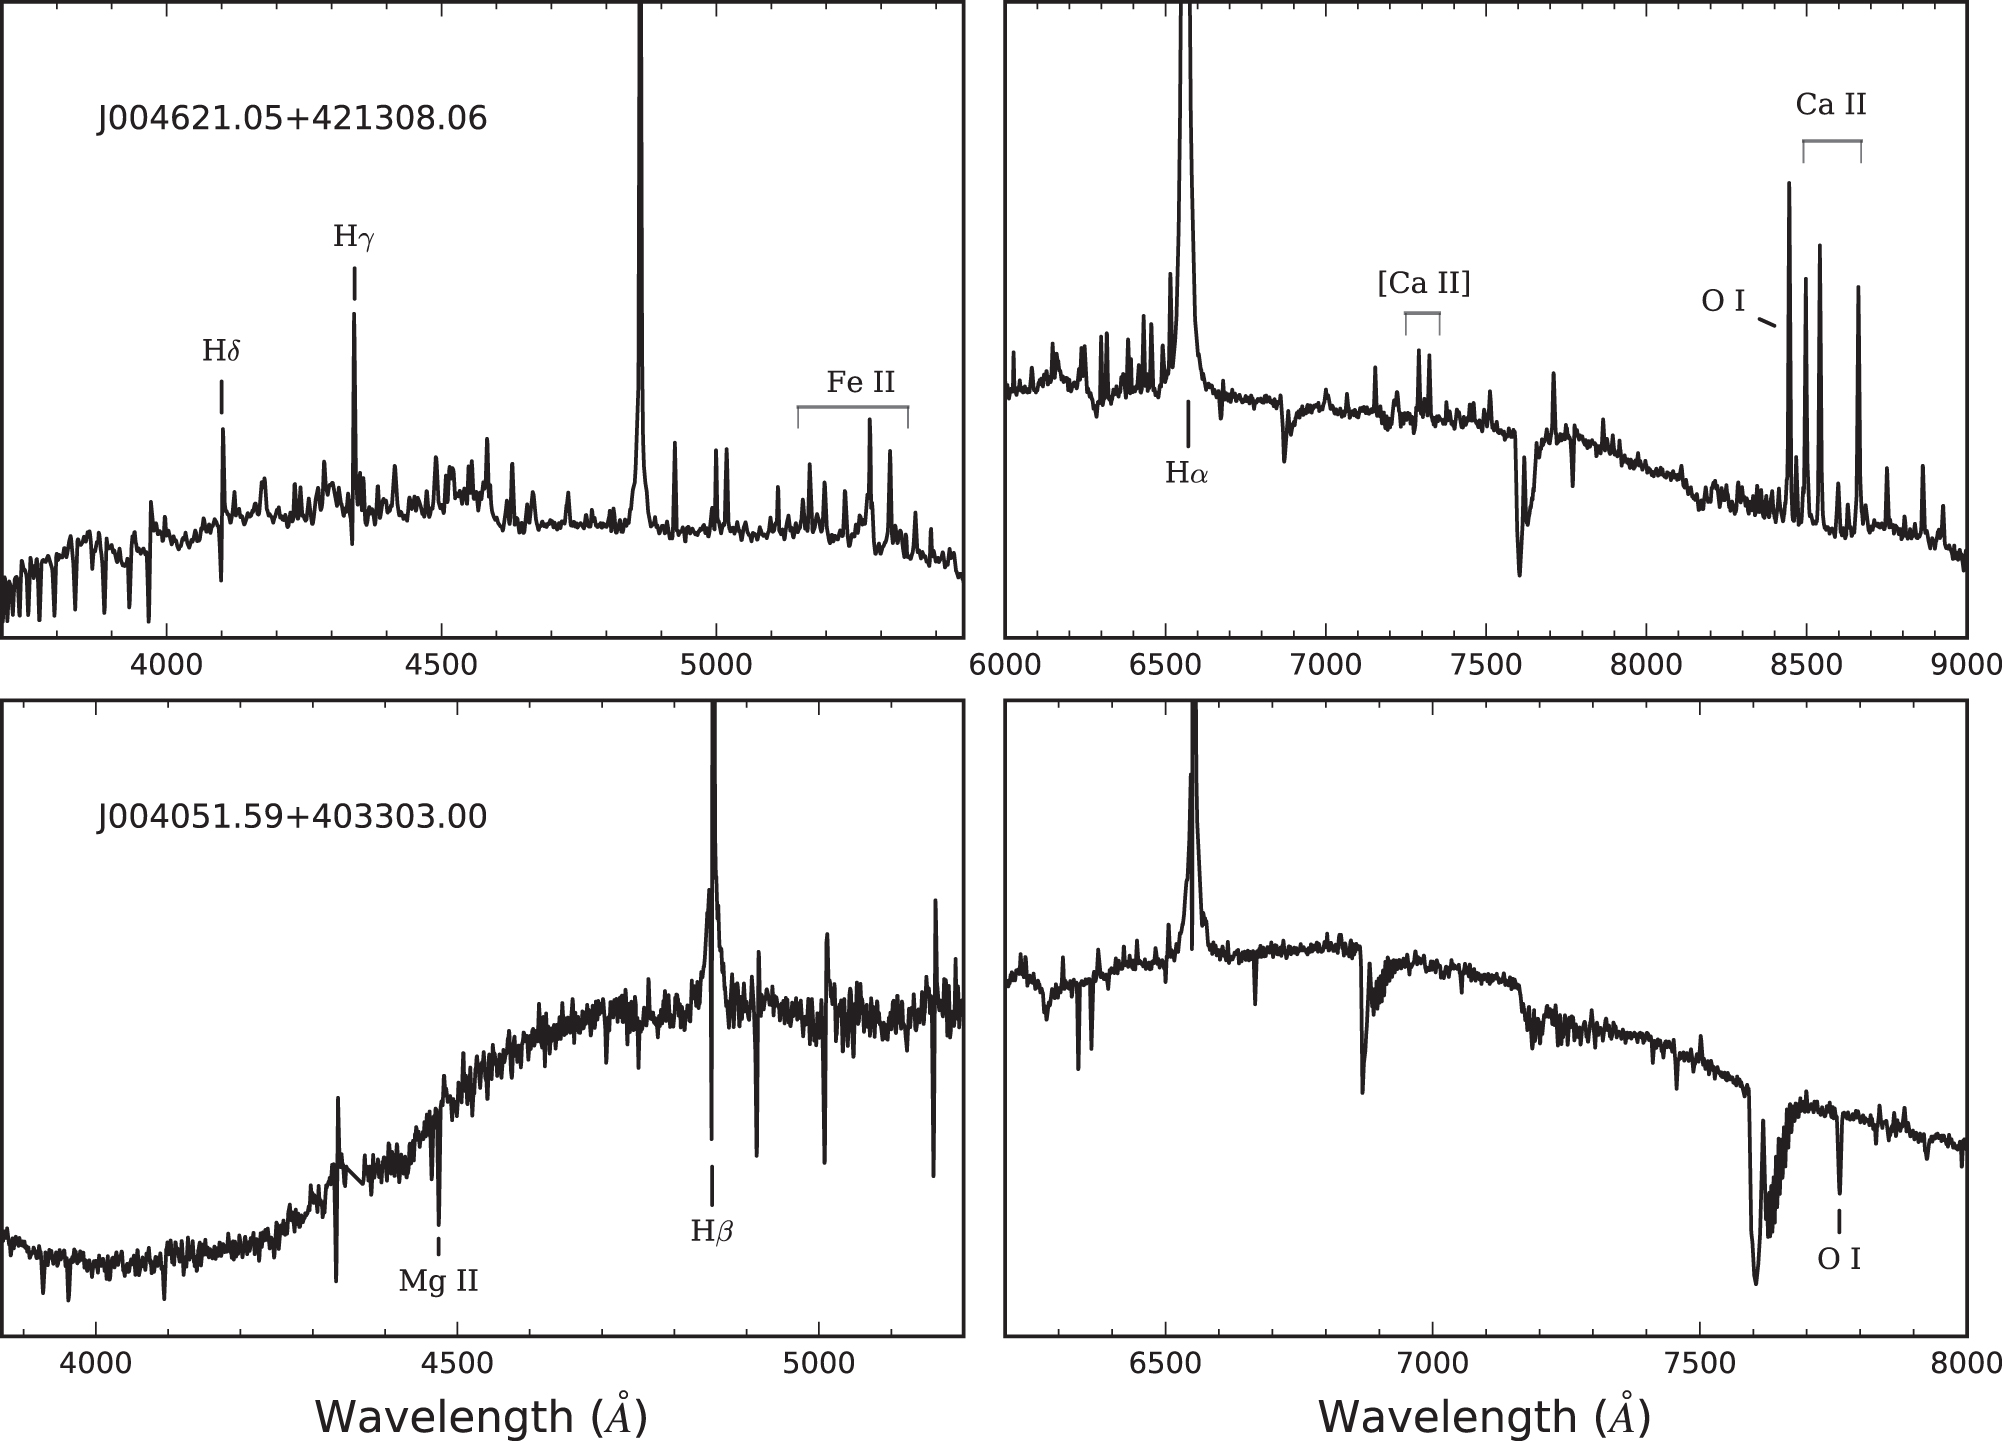
J004621.05+421308.06 was considered a candidate LBV by Massey et al. (2007a) and King et al. (1998). Due to its position in the northern arm of M31, it was outside both of our two Hectospec fields for M31. Consequently, we obtained a long-slit spectrum of this target on 2014 November 22 with the MODS1 spectrograph on the Large Binocular Telescope. The instrument setup and observing procedure are described in Paper I. Its blue and red spectra are shown in Figure 5. J004621.05+421308.06 has the absorption-line spectrum of a late A-type supergiant with strong Balmer emission lines with deep P Cygni profiles and the broad wings characteristic of Thomson scattering. The outflow velocity is −223 km s−1, measured from three P Cygni absorption minima. Numerous Fe ii and [Fe ii] emission lines are present. Like the warm hypergiants discussed in Paper I, its red spectrum shows the Ca ii and [Ca ii] line emission indicative of a low-density CS nebula. The O iλ8846 line is also in emission. The SED shown in Figure 6 reveals a prominent CS dust envelope in the near- and mid-infrared not observed in the LBVs (Paper II). These properties are shared with the warm hypergiants and probable post-RSGs experiencing high mass loss. Their photospheres are not due to the cool dense winds formed by an LBV in eruption, but represent the stellar surface. We therefore suggest that J004621.05+421308.06 belongs with the class of warm hypergiants.

Figure 5. Top: warm hypergiant J004621.05+421308.06, LBT MODS1 2014. The absorption-line spectrum appears as a late A-type star with strong Balmer emission lines. Ca ii and [Ca ii] emission lines indicate the presence of a low-density circumstellar nebula. Bottom: LBV candidate J004051.59+403303.00, MMT Hectospec 2013. The emission-line spectrum shows prominent P Cygni profiles on Balmer lines with broad wings. The measured outflow velocity of −152 km s−1 is similar to the LBVs and hypergiants discussed in Papers I and II. It is most likely in a post-RSG, mass-losing state. Spectra are not flux-calibrated or rectified.
Download figure:
Standard image High-resolution image
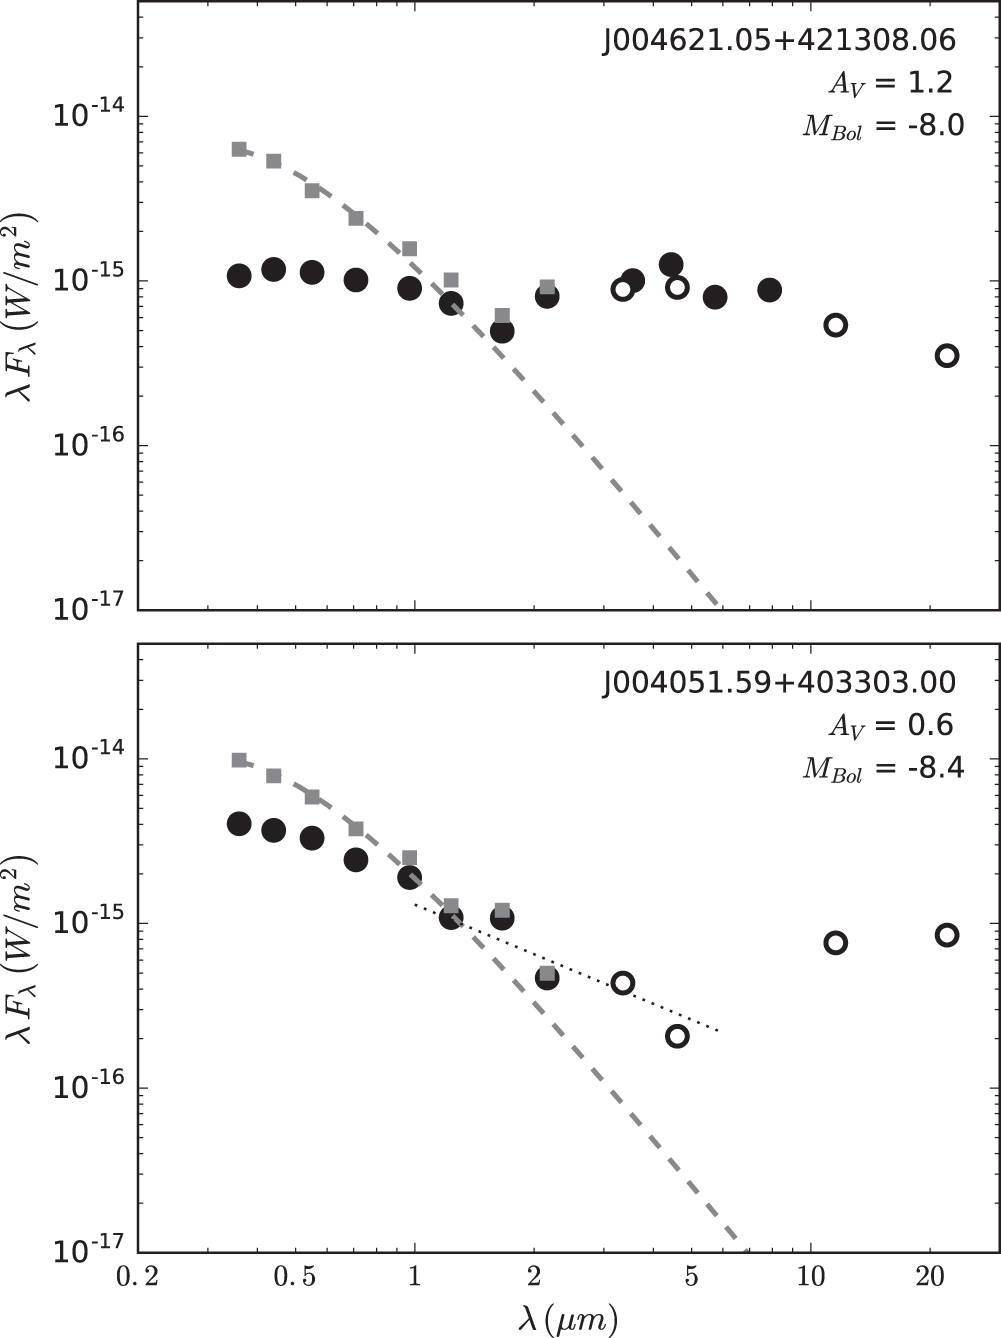
Figure 6. SEDs of warm hypergiant candidates J004621.05+421308.06 and J004051.59+403303.00. The symbols are the same as in Figure 3. The SED of J004621.05+421308.06 reveals a prominent CS dust envelope in the IRAC and WISE bands. The WISE photometry of J004051.59+403303.00 is suggestive of silicate dust emission, but is most likely due to contamination from a nearby H ii region and nebulosity. The dotted line is a curve of constant  , which is evidence for free–free emission in wind.
Download figure:
Standard image High-resolution imageJ004051.59+403303.00 has been described by Massey et al. (2007a) and by Sholukhova et al. (2015) as a candidate LBV. Our blue and red spectra from 2013 shown in Figure 5 are similar to the blue spectrum published by Massey et al. (2006) and the blue and red spectra in Sholukhova et al. (2015), suggesting little spectroscopic change in the last 10 years. The spectra show prominent P Cygni profiles in the Balmer lines with broad wings and in the Fe ii multiplet 42 lines. The mean outflow velocity measured from the absorption minimum in six P Cygni profiles is −152 km s−1, similar to the LBVs and hypergiants (Papers I and II). There are no other Fe ii or [Fe ii] emission lines. The relative strengths of the Mg ii λ4481 and He i λ4471 lines suggest an early A-type supergiant. Its spectrum is similar to the warm hypergiant M31-004444.52 in Paper I, but it does not have the [Ca ii] emission lines in the red. It also resembles J004526.62+415006.3 in 2010, which was later shown to be an LBV entering its maximum-light or dense-wind stage (Humphreys et al. 2015; Sholukhova et al. 2015). Therefore, based on this spectrum, its nature is somewhat ambiguous. Its SED in Figure 6 shows an excess in the near-infrared due to free–free emission, as evidenced by constant flux (Fν) out to 5 μm. The WISE photometry at 12 and 22 μm may be due to CS dust from silicate emission, but is more likely contaminated by PAH emission from a nearby H ii region and nebulosity.
Thus, J004051.59+403303.00 may be a mass-losing post-RSG like several of the stars discussed in this paper or a candidate LBV. Future spectroscopic and photometric variability will be necessary to confirm that it is an LBV, but even so, given its luminosity, it is very likely in a post-RSG state similar to the less-luminous LBVs.
4. RED SUPERGIANTS
With significant mass loss, RSGs can evolve back to higher temperatures. We examine the SEDs of the RSGs to identify what fraction of these cool supergiants are in a mass-losing state and determine their positions on the HRD. Additionally, we can roughly estimate the total mass lost through CS ejecta from the stars' infrared photometry. The RSGs currently experiencing episodes of high mass loss may eventually evolve to become post-RSG warm supergiants, LBVs, or WR stars.
We cross-identify the visual photometry for the RSGs from the LGGS with 2MASS, IRAC, and WISE. The multi-wavelength photometry is summarized in Table 6 for the 437 RSG candidates in M31 (Massey et al. 2009) and the 204 (189 rank-1 plus 15 rank-2) in M33 (Drout et al. 2012).
Table 6. Photometry of Candidate RSGs
| Star Namea | U | B | V | R | I | J | H | K | 3.6 μmb | 4.5 μm | 5.8 μm | 8.0 μm | 3.4 μmc | 4.6 μm | 12 μm | 22 μm | |
|---|---|---|---|---|---|---|---|---|---|---|---|---|---|---|---|---|---|
| M31 | |||||||||||||||||
| M-003703.64 | ⋯ | 21.6 | 19.9 | 19.0 | 17.7 | 16.6 | 15.7 | 15.7 | ⋯ | ⋯ | ⋯ | ⋯ | 15.5 | 15.7 | 12.9 | 9.4 | |
| M-003723.56 | 22.1 | 20.8 | 18.9 | 17.9 | 16.9 | 15.7 | 14.9 | 14.8 | ⋯ | ⋯ | ⋯ | ⋯ | 14.5 | 14.7 | 12.4 | 9.3 | |
| M-003724.48 | ⋯ | 21.7 | 19.6 | 18.5 | 17.5 | 16.2 | 15.0 | 15.1 | 16.3 | 16.2 | 13.8 | 11.8 | 14.8 | 15.1 | 12.7 | 9.4 | |
| M-004120.25 | 23.1 | 20.9 | 18.9 | 17.6 | 16.3 | 14.9 | 14.0 | 13.7 | 13.0 | 13.2 | 12.9 | 12.4 | 13.4 | 13.6 | 12.7 | 9.2 | |
| M-004444.66 | 22.5 | 20.9 | 19.0 | 18.0 | 16.9 | 15.8 | 14.8 | 14.8 | 14.2 | 14.3 | 14.1 | 14.1 | 14.5 | 14.6 | 12.3 | 9.1 | |
| M33 | |||||||||||||||||
| D-013217.79 | 20.5 | 19.6 | 18.4 | 17.8 | 17.2 | 16.6 | 15.7 | 15.9 | 15.8 | 15.8 | ⋯ | ⋯ | 15.8 | 16.0 | 12.9 | 8.8 | |
| D-013224.33 | 20.9 | 21.4 | 19.6 | 18.7 | 17.8 | 16.7 | 16.1 | 15.6 | 15.7 | 15.9 | ⋯ | ⋯ | 15.7 | 15.9 | 12.4 | 9.5 | |
| D-013312.26 | 19.1 | 17.6 | 16.0 | 15.1 | ⋯ | 13.3 | 12.6 | 12.4 | 12.4 | 12.4 | ⋯ | 12.1 | 12.3 | 12.3 | 12.0 | 8.7 | |
| D-013421.55 | ⋯ | 21.2 | 19.3 | 18.1 | 16.8 | 15.4 | 14.6 | 14.4 | 14.2 | 14.3 | ⋯ | 13.5 | 14.0 | 14.1 | 12.3 | 8.7 | |
| D-013502.06 | 21.0 | 19.9 | 18.5 | 17.9 | 17.3 | 16.5 | 16.0 | 16.6 | 15.8 | 15.8 | ⋯ | ⋯ | 15.9 | 16.0 | 12.8 | 9.0 | |
Notes.
aD- indicates that the source was listed in Drout et al. (2012) with the name specifying the R.A. coordinate of its LGGS ID. M- indicates that the source was listed in Massey et al. (2009). The shorthand naming convention is for ease of matching to other tables in this paper. The complete R.A. and Decl. designations are provided in the electronic version. b3.6, 4.5, 5.8, and 8.0 μm photometry from Spitzer/IRAC. c3.4, 4.6, 12, and 22 μm photometry from WISE.Only a portion of this table is shown here to demonstrate its form and content. A machine-readable version of the full table is available.
Download table as: DataTypeset image
Since we lack information on spectral type, we cannot correct for extinction using intrinsic colors. Massey et al. (2009) applied a constant AV = 1 to the entire sample of M31 RSGs, and Drout et al. (2012) adopted a fixed reddening law of  for all RSGs in M33. Here, we follow the methodology for the YSGs and estimate AV from the Q-method for nearby O and B stars and from the neutral hydrogen column density along the line of sight to each RSG as described in Section 3.3. Unfortunately, roughly 60% of the RSG candidates lacked nearby O and B stars, so we are forced to adopt the less accurate extinction from the neutral hydrogen. The results from the two methods are summarized in Table 7. Bolometric luminosities are calculated by integrating the optical through 2MASS Ks. Similar to the YSG sources, if the SEDs show an infrared excess in the 2MASS or IRAC photometry of the RSG candidates, we integrate the SED out to the IRAC 8 μm band and/or the 22 μm WISE band if uncontaminated. Those sources are indicated with an asterisk in Table 7. Several sources were found to have anomalous photometry in the optical or infrared, possibly due to crowding in the field or source mismatch from the LGGS. Some of these objects with unusually high bolometric luminosities may actually be foreground stars, but without spectra we cannot confirm membership. These stars are omitted from the HRDs in Section 5.2. They are included in the catalogs for completeness and are indicated with a dagger in Table 7.
Table 7. Extinction and Luminosities of Candidate RSGs
| Star Name | AV (Stars) | AV (NH) | Adopted AV | MV | MBola |
|---|---|---|---|---|---|
| M31 | |||||
| M-003739.41 | ... | 0.8 | 0.8 | −5.9 | −6.7 |
| M-003739.88 | 0.9 | 0.7 | 0.9 | −6.7 | −8.2a |
| M-003907.69 | 1.8 | 1.4 | 1.8 | −7.5 | −8.3 |
| M-003907.98 | 1.6 | 1.4 | 1.6 | −7.4 | −8.0a |
| M-004638.17 | 1.2 | 1.1 | 1.2 | −6.1 | −8.3a |
| M33 | |||||
| D-013339.28b | 0.7 | ... | 0.7 | −8.4 | −9.8a |
| D-013340.80 | 0.8 | 0.6 | 0.8 | −6.1 | −7.0 |
| D-013349.09 | 0.9 | 0.6 | 0.9 | −6.3 | −8.0a |
| D-013349.99 | 1.9 | 1.0 | 1.9 | −7.1 | −8.2a |
| D-013438.95 | 0.4 | 0.5 | 0.4 | −5.5 | −7.5a |
Notes.
aIndicates the presence of an IR excess, and thus MBol was calculated by integrating the SED out to the mid-infrared. bPhotometry of sources is anomalous. For some stars in crowded fields, there may be either a source mismatch between the optical and infrared or the photometry may be contaminated by multiple sources in the aperture. M-004539.99, D-013312.26, and D-013401.88 (included in full table online) are likely foreground stars. Marked sources are omitted from the H-R diagrams for the above reasons.Only a portion of this table is shown here to demonstrate its form and content. A machine-readable version of the full table is available.
Download table as: DataTypeset image
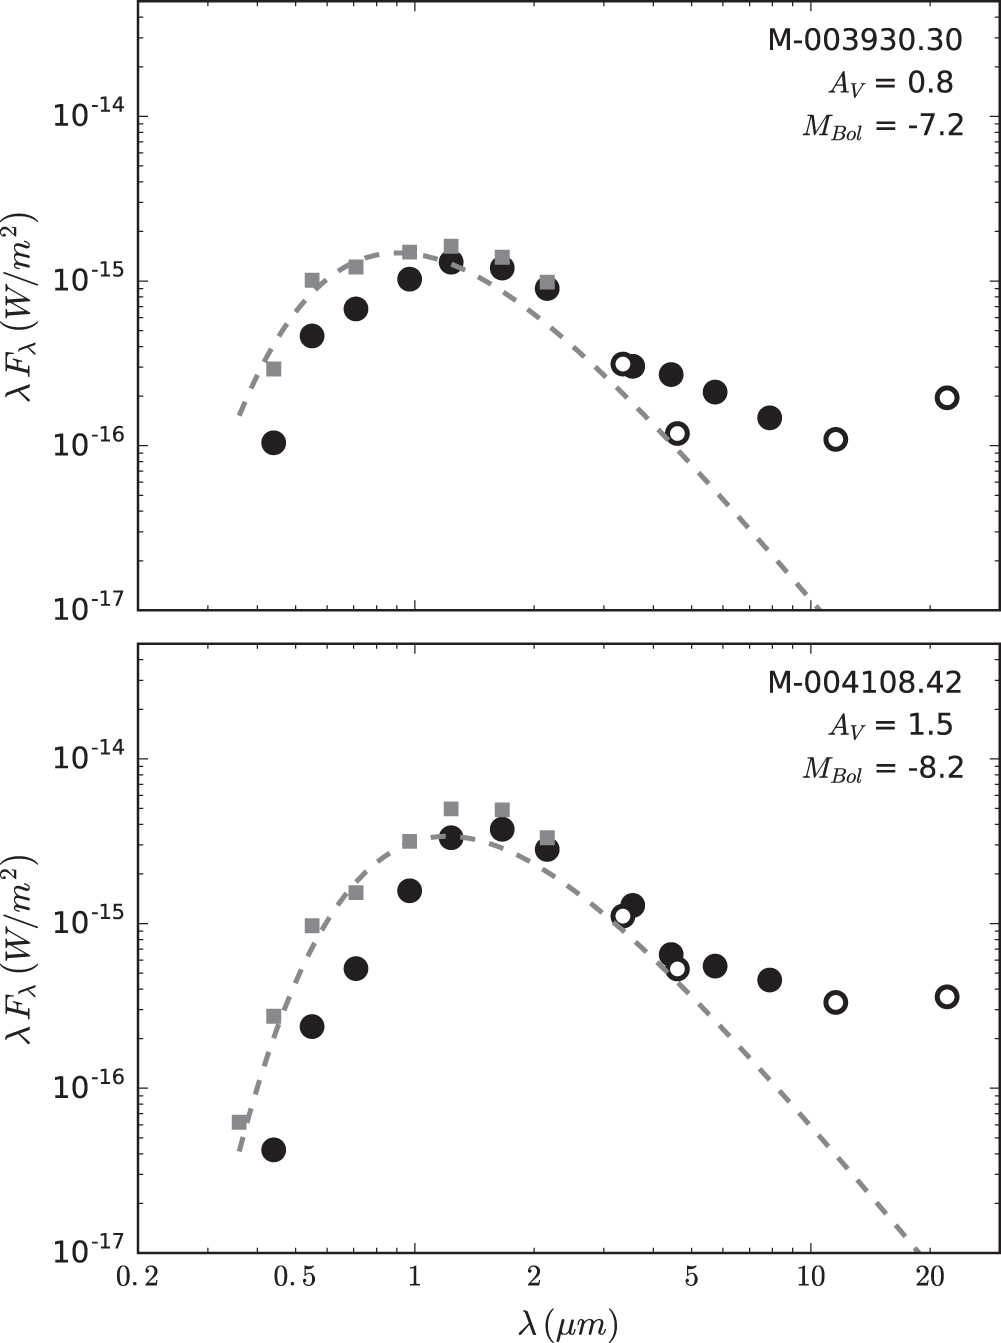
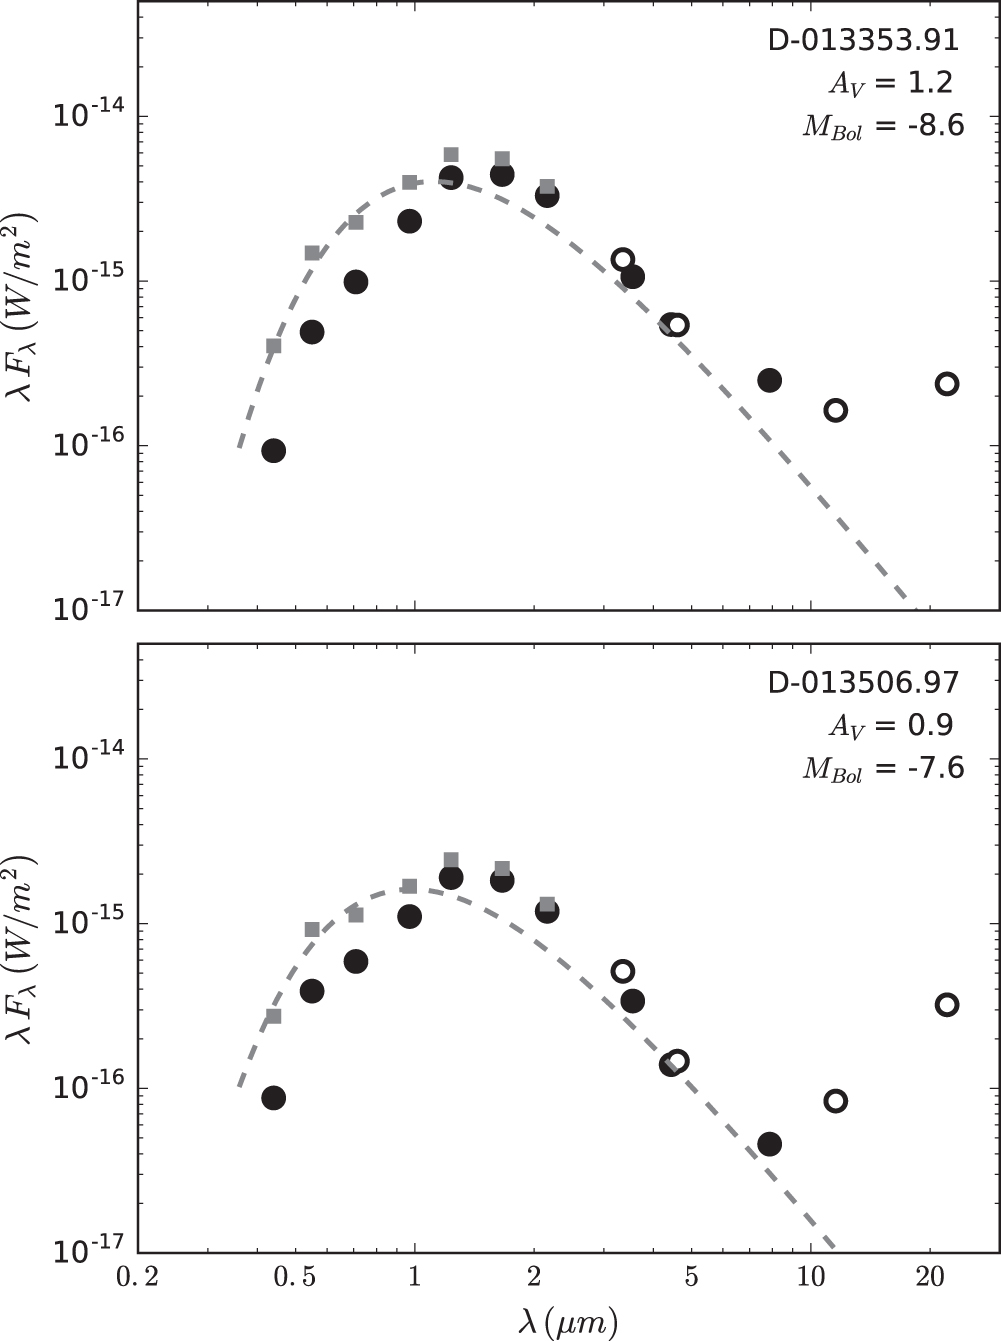
Figures 7 and 8 are example SEDs for RSGs in both galaxies. The symbols follow the same pattern as Figure 3. Since these stars are cooler, the peak of the optical thermal component from the star shifts redward in the SED. This makes any infrared excess in the 2MASS bands less discernable than in the YSGs; however, the CS dust component at wavelengths longer than 3.6 μm can still be readily distinguished in most of the RSG candidate sources. For this reason, we divide our SEDs into rankings. Rank-1 SEDs have an infrared excess in the IRAC and/or WISE bands, most probably due to CS dust emission. Rank-2 SEDs either have missing IRAC photometry but show an IR excess in WISE, or have an IR excess in the IRAC bands but one that is somewhat uncertain due to the characteristic PAH upturn in the WISE bands and are thus possibly contaminated by nebulosity. Figure 7 demonstrates two rank-1 RSGs, with SEDs showing excess emission above the color-temperature fits to the optical data. The bottom panel of Figure 8 illustrates one of the more ambiguous sources in M33. D-013353.91 has a clear infrared excess at 8 μm, while the infrared photometry of D-013506.97 can be easily confused with nebulosity. We consider D-0133506.97 to be a rank-2 mass-losing RSG candidate.

Figure 7. SEDs of two red supergiants in M31. The symbols are the same as in Figure 3. Gray dotted lines represent blackbody fits with color temperatures of 4100 and 3100 K for top and bottom, respectively. The SEDs of both stars show evidence for circumstellar dust. MBol is calculated for both of these sources by integrating the SEDs through the infrared.
Download figure:
Standard image High-resolution image
Figure 8. SEDs of two red supergiants in M33. D-013353.91 has an obvious infrared excess at 8 μm, and the relatively constant irradiance through the WISE bands is strong evidence for circumstellar dust emission. The bottom source, D-013506.97, may also have dusty ejecta, but the sharp rise in the W3 and W4 bands is most likely contamination from nebulosity. The color temperatures of the blackbody fits to the optical photometry are 3300 and 3500 K for the top and bottom panels.
Download figure:
Standard image High-resolution imageOf the 437 RSG candidates in M31 from Massey et al. (2009), 231 (129 rank-1 and 102 rank-2) show evidence for CS dust emission in the mid-IR IRAC or WISE bands. Thus, ∼53% of the candidate M31 RSGs have CS dust.6 An additional 110 candidate RSGs are likely contaminated with nebular emission.
In M33, 126 of the 204 candidate RSGs from Drout et al. (2012) have indicators for CS dust emission in the infrared. Again dividing the 126 sources with infrared excess into ranks from their SEDs, we find 53 rank-1 (highly probable) RSGs and 73 rank-2 (likely) candidates.7 Thus, ∼60% of our RSG candidates in M33 have evidence for dusty ejecta. Forty-three sources show the PAH upturn in their SEDs and are likely contaminated with nebulosity.
Table 8 summarizes the results from both galaxies. We find that more than half of the RSG candidates in M31 and M33 exhibit evidence for mass loss. This high fraction is not surprising since M supergiants have been known for decades to have mass loss and dusty CS ejecta (Woolf & Ney 1969). Our results are consistent with the ∼45% found by Mauron & Josselin (2011) in the Milky Way and LMC using the IRAS 60 μm band. Since we have included our rank-2 SEDs in this census, the fractions reported here may represent an overestimate.
Table 8. RSG Candidates with Evidence for CS Dust
| Star Name | LGGS | Ranka | Mass Lost (M⊙)b |
|---|---|---|---|
| M31 | |||
| M-003930.30 | J003930.30+404353.4 | 1 | 0.13±0.02 × 10⁻² |
| M-004024.52 | J004024.52+404444.8 | 1 | 0.05±0.01 × 10⁻² |
| M-004036.08 | J004036.08+403823.1 | 1 | 1.07±0.13 × 10⁻² |
| M-004031.00 | J004031.00+404311.1 | 1 | 0.39±0.05 × 10⁻² |
| M-004304.62 | J004304.62+410348.4 | 1 | 0.51±0.06 × 10⁻² |
| M33 | |||
| D-013354.32 | J013354.32+301724.6 | 1 | 0.16±0.02 × 10⁻² |
| D-013401.88 | J013401.88+303858.3 | 1 | 1.48±0.18 × 10⁻² |
| D-013416.75 | J013416.75+304518.5 | 2 | 0.10±0.12 × 10⁻² |
| D-013454.31 | J013454.31+304109.8 | 1 | 0.37±0.04 × 10⁻² |
| D-013459.81 | J013459.81+304156.9 | 2 | 0.14±0.02 × 10⁻² |
Notes.
aRank 1 indicates that an infrared excess in the SED is most probably due to CS dust emission. Rank 2 indicates that features in the SED are likely caused by thermal dust emission but may be due to PAH contamination. bTotal mass lost through circumstellar ejecta estimated from IRAC/WISE photometry. See Section 5.1.Only a portion of this table is shown here to demonstrate its form and content. A machine-readable version of the full table is available.
Download table as: DataTypeset image
5. DISCUSSION
5.1. CS Dust and Mass Loss
Thermal emission from dust appears in the mid-infrared IRAC data from 3.6 to 8 μm and is also present in the WISE photometry at longer wavelengths. With some assumptions about the dust grain parameters, we can estimate the mass of the CS material from the mid-infrared flux (see Paper I):

where D is the distance to the source (here, the average distance to M31/M33), Fλ is the mid-infrared flux, a is the grain radius, ρ is the grain density, Qλ is the absorption efficiency factor for silicate dust grains, and  is the blackbody emission at temperature T.
For many of the YSG and RSG candidates with an infrared excess, the flux is fairly constant across the mid-infrared, which implies that the dust is emitting over a range of temperatures and distances around the central star. Using the prescription of Suh (1999) for silicate dust grains and mass loss around AGB stars, we assume a dust grain size of a = 0.1 μm at a density ρ = 3 g cm−3 and an average temperature of 350 K. The absorption (and emission) efficiency factor Qλ is maximized at the 9.8 μm Si–O vibrational mode (Woolf & Ney 1969) and the 18 μm O–Si–O bending mode (Treffers & Cohen 1974), so the fluxes at these wavelengths would be the ideal tracers of thermal dust emission. Since we lack photometry precisely centered on the silicate features, we calculate the dust mass using the flux at 8 μm, or at 12 μm (W3) if no IRAC data exist for the sources. We assume a nominal gas-to-dust ratio of 100, which allows for the calculation of the total mass lost in each source.
The results are summarized in Table 5 for the YSGs and Table 8 for the RSGs, where the error is calculated as the standard error propagation on the average distance to M31/M33 (<5%) and the photometric errors for measured flux by IRAC/WISE (<3%/<9%, Hora et al. 2004; Wright et al. 2010). For both YSGs and RSGs in M31 and M33, we find a range of at least a factor of 10 for the mass of the CS material. Most of the supergiants have shed ~10–3– , which is consistent with Paper I. Mauron & Josselin (2011) apply the mass-loss prescription of de Jager et al. (1988) to Galactic RSGs to calculate an average mass-loss rate of ∼10−6 M⊙ yr−1 from IRAS 60 μm flux. For our dusty RSGs, we can approximate a timescale probed by the IRAC photometry and thus compare our total integrated mass loss to typical RSG mass-loss rates. If we assume an average dust condensation distance of ∼250 AU and an outflow velocity of 20 km s−1, we estimate ∼100 years for the dust condensation time—a rough timescale for the dust we observe at 8 μm. Considering that the CS ejecta most likely contains dust over a range of temperatures (∼150–400 K), as well as the possibility of episodic mass loss in the more massive RSGs, an average mass-loss rate of 10–5–
 is consistent with the total mass-lost estimates of 10–3–
 over the dust condensation timescale.
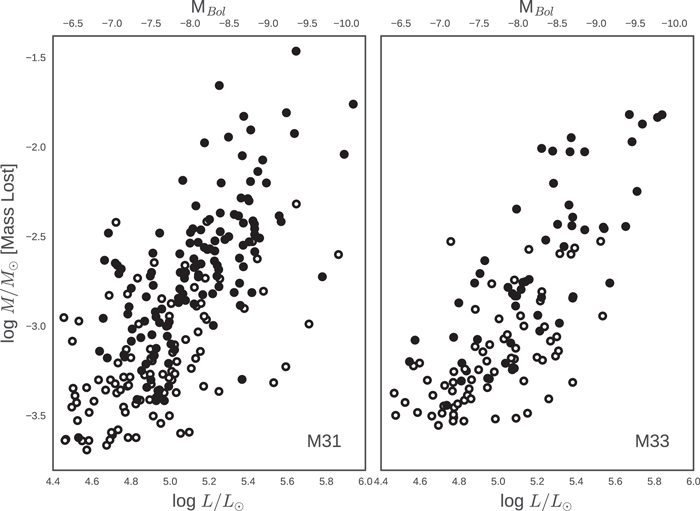
For the RSG populations in both galaxies, we plot bolometric luminosity versus total mass lost in Figure 9. The formulation of de Jager et al. (1988) predicts an increasing mass-loss rate with luminosity, and we find a similar trend with total mass lost as traced by dust. We separate the rank-1 RSGs—those candidates with a clear indication of mass loss in their SEDs—from the rank-2 RSG candidates. The rank-2 sources yield ejecta masses at the lower end of the RSG sample. These RSG candidates likely have CS dust, but the infrared excess was not as obvious as in the rank-1 SEDs, thus the derived mass-loss estimate is lower. Since the RSGs with the highest luminosity also have the highest mass loss, these dusty RSGs may evolve back to higher temperatures to become the intermediate-type post-RSGs discussed in this paper.

Figure 9. Bolometric luminosity vs. total mass lost based on dust measurements for RSG candidates in M31 and M33. Closed circles are the rank-1 RSGs, those with clear evidence for mass loss in their SEDs. Open circles are the less certain mass losers, the rank-2 RSG candidates. We note that the RSGs with higher luminosity tend to have lost more mass, consistent with the prescription of de Jager et al. (1988) for mass loss in RSGs.
Download figure:
Standard image High-resolution image5.2. H-R Diagrams
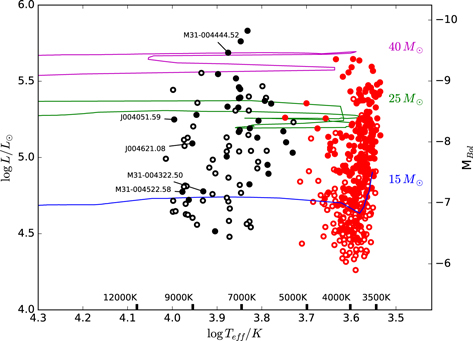
The HRDs for the populations of yellow and red supergiants are shown in Figures 10 and 11. The temperatures for the YSGs are derived from the  colors using the transformations in Flower (1996) for intermediate-type supergiants. As described in Section 3.3, their luminosities are calculated based on the bolometric corrections given in Flower (1996) or by integrating the SED for those stars with emission-line spectra or with CS dust.

Figure 10. H-R diagram of M31. Red circles represent our RSG sample, black circles are the YSGs. Closed symbols are sources with evidence of mass loss, either in their spectra (for the YSGs) or in their SEDs (for both the YSGs and RSGs). Stellar evolution tracks from non-rotating models for three mass bins from Ekström et al. (2012) are shown for comparison. The stars with mass loss—the post-RSG candidates—appear to dominate the upper portion of the H-R diagram. The main-sequence progenitors of these supergiants likely had masses  M⊙. Labeled sources are previously confirmed hypergiants in M31 as well as the two new hypergiant candidates, J004051.59+403303.00 and J004621.05+421308.06.
Download figure:
Standard image High-resolution image
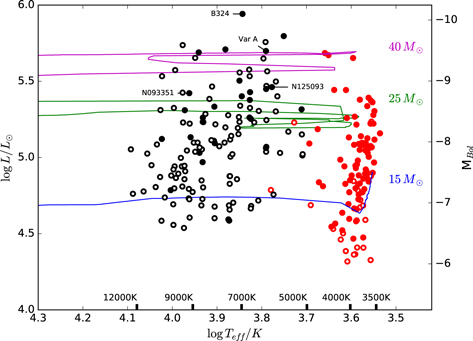
Figure 11. H-R diagram of M33. Symbols are the same as in Figure 10. We see clearly that the brighter, more massive RSGs all have evidence for mass loss. Labeled sources are previously confirmed hypergiants in M33. Var A is shown with  as discussed in Paper I.
Download figure:
Standard image High-resolution imageThere are several temperature scales in the literature for RSGs. Since we do not have spectral types for the RSGs, we adopt the temperatures from Massey et al. (2009) for the M31 RSGs and from Drout et al. (2012) for M33 simply for the purpose of placing them on the HRD to compare with the YSG population. Their M31 temperature scale is based on a color–temperature relationship from  from MARCS atmosphere models (Gustafsson et al. 2008), while their temperatures for the M33 stars are based on
  color transformations from Levesque et al. (2006) in the LMC, which has a metallicity similar to M33. The bolometric luminosities for the RSGs are determined from integrating their SEDs (Section 4).
Stellar evolution tracks from non-rotating models from Ekström et al. (2012) are shown on the HRDs for zero-age main-sequence masses of 15, 25, and 40 M⊙. In both galaxies, the post-RSG candidates are preferentially more abundant at higher luminosities. Comparison with the evolutionary tracks suggests that most of the progenitor main-sequence stars have masses ≳20 M⊙. Likewise, the dusty RSGs dominate the higher luminosities. This is most obvious for the M33 population with a smaller sample. This is not surprising, because we know from Figure 9 that the mass lost in the RSGs correlates with luminosity.
We note the presence of several "warm" RSGs in both galaxies. These RSG candidates, with temperatures upwards of 4000 K, fall in the temperature range of the YSGs. The temperature scales are somewhat uncertain, and without spectra of these objects we cannot confirm that some of them may actually be YSGs.
Labeled sources in Figures 10 and 11 are the warm hypergiants from Paper I, as well as the two new hypergiant candidates, J004051.59+403303.00 and J004621.05+421308.06, discussed in Section 3.4.
6. CONCLUSION
We identify 75 spectroscopically confirmed YSGs in M31, including the three warm hypergiants from Paper I, and 86 in M33, including the 14 previously known YSGs from Papers I and II. The majority have normal absorption-line spectra, but a significant fraction, 30 in M31 and 27 in M33, show evidence for mass loss via stellar winds and/or CS dust in their SEDs. Since the RSG stage is a well-established state with high mass loss, we consider these stars to be excellent candidates for post-RSG evolution. Thus, about 30%–40% of the observed YSGs are likely in a post-RSG state. The post-RSG candidates are more common at luminosities above ∼105 L⊙. Most appear to have initial masses of 20–40 M⊙, and may be the evolutionary descendants of the more massive RSGs that do not explode as SNe (Smartt et al. 2009). The eventual fate of these stars may be as either "less-luminous" LBVs or WR stars before their terminal explosion; however, in his most recent review, Smartt (2015) argues for an upper limit of ≈18 M⊙ for SN progenitors, and that more massive stars collapse directly to black holes.
The less-luminous LBVs (MBol ≈ 8 to −9.5 mag) have high L/M values of ∼0.5, compared to the B- and A-type supergiants in the same part of the HRD. The most likely explanation is that the LBVs have shed a significant fraction of their mass in a previous state and are now close to their Eddington limit. Consequently, they have also been considered as evidence for post-RSG evolution (Humphreys & Davidson 1994; Vink 2012, p. 221–247), and would have passed through the YSG region of the HRD in their evolution to higher temperatures. Thus, the mass-losing YSGs may be thought of as the progenitor class of the less-luminous LBVs.
We identify two new warm hypergiant candidates in M31, J004621.05+421308.06 and J004051.59+403303.00. The spectra of both stars show strong P Cygni absorption profiles in the Balmer emission lines with broad Thomson scattering wings. J004621.05+421308.06 also has strong Ca ii and [Ca ii] emission indicative of a CS nebula plus dusty CS ejecta. Both stars are very likely in a post-RSG state. J004051.59+403303.00 is also considered to be a candidate LBV. If so, it would be one of the less-luminous LBVs, but future spectroscopy and photometry are necessary for confirmation.
The RSG sample yielded 231 stars in M31 (53%) and 126 in M33 (60%) with observable dusty emission. Therefore, a large fraction of RSGs are in a mass-losing state. Consistent with Mauron & Josselin (2011) and the prescription of de Jager, we find that mass loss correlates with luminosity along the RSG branch. The IRAC 8 μm band provides a reasonable estimate of the total dust mass lost over a timescale of about a century, and we estimate that the RSGs in both galaxies tend to have dusty ejecta of the order of 10–3– , assuming a warm dust component of 350 K. If more than 50% of RSGs are indeed experiencing sufficient mass loss to produce CS dusty ejecta, a large fraction of stars along the RSG branch may evolve back toward the blue to become the warm post-RSG stars before their terminal state as SNe or black holes.
Table 9. Foreground Dwarfs
| ID | Spec. Type | Notes | Ranka |
|---|---|---|---|
| M31 | |||
| J003934.02+404714.2 | F0 | ⋯ | 2 |
| J004107.40+405328.6 | A | HBAb | 2 |
| J004131.50+403917.8 | G0 | ⋯ | 1 |
| J004144.76+402808.9 | G8 | composite? | 1 |
| J004259.31+410629.1 | F2 | foreground in H ii region | ⋯ |
| M33 | |||
| J013235.17+303331.6 | A8 | HBAb | 1 |
| J013320.57+304901.6 | F5 | ⋯ | 2 |
| J013315.21+303727.0 | B+H ii | hot star in H ii region | ⋯ |
| J013331.15+304530.0 | A5 | He absorption | 1 |
| J013446.88+302620.9 | G | ⋯ | 2 |
Notes.
aRanks from Drout et al. (2009, 2012) specify if the source was a (1) "highly likely" or (2) "possible" supergiant. bIndicates that the star is possibly a warm horizontal-branch A-type star.Only a portion of this table is shown here to demonstrate its form and content. A machine-readable version of the full table is available.
Download table as: DataTypeset image
We note that our target selection was derived from optical surveys. Therefore, our survey of the most luminous stars in M31 and M33 does not include supergiant stars that may be obscured. Since the most luminous warm and cool supergiant populations are more likely to have the highest mass-loss rates, it is probable that those sources will be highly obscured in the optical by their own CS ejecta. To complete the upper portion of the HRD requires a further search through the IRAC data to find the brightest infrared sources.
Research by M. Gordon and R. Humphreys on massive stars is supported by the National Science Foundation AST-1109394. We thank Perry Berlind and Michael Calkins at the MMT for their excellent support and operation of the Hectospec. This paper uses data from the MODS1 spectrograph built with funding from NSF grant AST-9987045 and the NSF Telescope System Instrumentation Program (TSIP), with additional funds from the Ohio Board of Regents and the Ohio State University Office of Research. This publication also makes use of data products from the Two Micron All Sky Survey, which is a joint project of the University of Massachusetts and the Infrared Processing and Analysis Center/California Institute of Technology, funded by the National Aeronautics and Space Administration and the National Science Foundation, and from the Wide-field Infrared Survey Explorer, which is a joint project of the University of California, Los Angeles, and the Jet Propulsion Laboratory/California Institute of Technology, funded by the National Aeronautics and Space Administration.
Facilities: LBT/MODS1 - , MMT/Hectospec - .
Footnotes
-
∗
Based on observations obtained with the Large Binocular Telescope (LBT), an international collaboration among institutions in the United States, Italy, and Germany. LBT Corporation partners are: The University of Arizona on behalf of the Arizona university system; Istituto Nazionale di Astrofisica, Italy; LBT Beteiligungsgesellschaft, Germany, representing the Max-Planck Society, the Astrophysical Institute Potsdam, and Heidelberg University; The Ohio State University, and The Research Corporation, on behalf of The University of Notre Dame, University of Minnesota, and University of Virginia.
-
1
External SPECROAD was developed at UMN by Juan Cabanela for use on Linux or MacOS X systems outside the CfA. It is available online at http://astronomy.mnstate.edu/cabanela/research/ESPECROAD/.
-
2
At the time of this writing, Massey et al. (2016) have posted a spectroscopic survey of supergiants in M31 and M33 to the arXiv. Of the 75 YSGs in M31 identified here, 40 had consistent spectral types in Massey et al. (2016). Similarly, of the 86 YSGs identified in M33, 22 were given spectral types in their work. Differences in spectral classification are typically within the same spectral type, e.g., F5 versus F8.
-
3
For R = 3.2,
 atoms cm−2 mag−1 (Rachford et al. 2009).
 -
4
This source is identified as an F5 supergiant by Massey et al. (2016). D-003936.96 and the six others for which we did not observe spectra remain unclassified.
-
5
These three sources are also in the catalog of Massey et al. (2016), but without spectral types.
-
6
Of the 231 candidate RSGs with evidence for mass loss, 152 have spectral classifications from Massey et al. (2016).
-
7
Unlike the RSG candidates in M31, these sources in M33 did not have spectral classifications in Massey et al. (2016).
