


ABSTRACT
We present a kinematic analysis of 152 low surface gravity M7-L8 dwarfs by adding 18 new parallaxes (including 10 for comparative field objects), 38 new radial velocities, and 19 new proper motions. We also add low- or moderate-resolution near-infrared spectra for 43 sources confirming their low surface gravity features. Among the full sample, we find 39 objects to be high-likelihood or new bona fide members of nearby moving groups, 92 objects to be ambiguous members and 21 objects that are non-members. Using this age-calibrated sample, we investigate trends in gravity classification, photometric color, absolute magnitude, color–magnitude, luminosity, and effective temperature. We find that gravity classification and photometric color clearly separate 5–130 Myr sources from >3 Gyr field objects, but they do not correlate one to one with the narrower 5–130 Myr age range. Sources with the same spectral subtype in the same group have systematically redder colors, but they are distributed between 1 and 4σ from the field sequences and the most extreme outlier switches between intermediate- and low-gravity sources either confirmed in a group or not. The absolute magnitudes of low-gravity sources from the J band through W3 show a flux redistribution when compared to equivalently typed field brown dwarfs that is correlated with spectral subtype. Low-gravity, late-type L dwarfs are fainter at J than the field sequence but brighter by W3. Low-gravity M dwarfs are >1 mag brighter than field dwarfs in all bands from J through W3. Clouds, which are a far more dominant opacity source for L dwarfs, are the likely cause. On color–magnitude diagrams, the latest-type, low-gravity L dwarfs drive the elbow of the L/T transition up to 1 mag redder and 1 mag fainter than field dwarfs at MJ but are consistent with or brighter than the elbow at MW1 and MW2. We conclude that low-gravity dwarfs carry an extreme version of the cloud conditions of field objects to lower temperatures, which logically extends into the lowest-mass, directly imaged exoplanets. Furthermore, there is an indication on color-magnitude diagrams (CMDs; such as MJ versus (J–W2)) of increasingly redder sequences separated by gravity classification, although it is not consistent across all CMD combinations. Examining bolometric luminosities for planets and low-gravity objects, we confirm that (in general) young M dwarfs are overluminous while young L dwarfs are normal compared to the field. Using model extracted radii, this translates into normal to slightly warmer M dwarf temperatures compared to the field sequence and lower temperatures for L dwarfs with no obvious correlation with the assigned moving group.
Export citation and abstract BibTeX RIS
1. INTRODUCTION
At masses ≲75 MJup, that is, the H-burning mass limit, the interior of a source changes significantly. Below this mass limit, electron degeneracy pressure sufficiently slows contraction that the core of a given object is prevented from ever reaching the temperatures required for nuclear fusion (Hayashi & Nakano 1963; Kumar 1963). As a consequence, the evolution of substellar-mass objects produces a temperature, age, and mass degeneracy that leads to an important, and at times completely indistinguishable, overlap in the physical properties of the lowest-mass stars, brown dwarfs, and planets.
Objects with masses ≲75 MJup cool through their lives with spectral energy distributions evolving as their atmospheric chemistry changes with decreasing temperatures. The spectral classification for sources in the range (3000 K > Teff > 250 K) corresponds to late-type M, L, T, and Y with each class defined by the effects of changing molecular species available in the photosphere (Kirkpatrick 2005; Burgasser et al. 2002a; Cushing et al. 2011). At the warmest temperatures, the atmosphere is too hot for the condensation of solids (Allard & Hauschildt 1995; Lodders 1999). However, as Teff falls below 2500 K, both liquid (e.g., Fe) and solid (e.g., CaTiO3, VO) mineral and metal condensates settle into discrete cloud layers (Tsuji et al. 1996a, 1996b; Ackerman & Marley 2001; Allard et al. 2001; Woitke & Helling 2004).
As temperatures cool further, cloud layers form at such deep levels in the photosphere that they have little or no impact on the emergent spectrum. This transition between "cloudy" to "cloudless" objects occurs rapidly over a narrow temperature range (1200–1400 K, corresponding to the transition between L-type and T-type spectra) and drives extreme photometric, spectroscopic, and luminosity changes (Burgasser et al. 2002b; Tinney et al. 2003; Artigau et al. 2009; Dupuy & Liu 2012; Faherty et al. 2012, 2014a; Radigan et al. 2012). Violent storms (like those seen on Jupiter), along with magnetic-activity-inducing aurorae, have been noted as environmental conditions likely to be present at the L-T transition (Radigan et al. 2012; Apai et al. 2013; Gillon et al. 2013; Buenzli et al. 2014, 2015; Burgasser et al. 2014; Faherty et al. 2014a; Hallinan et al. 2015; Metchev et al. 2015).
Confounding our understanding of cloud formation in low-temperature atmospheres is the mounting evidence for a correlation between cloud properties and youth. Low surface gravity brown dwarfs, which are thought to be young, have unusually red near- to mid-infrared colors and a fainter absolute magnitude through ∼2.5 μm when compared to their older spectral counterparts with field surface gravities (Faherty et al. 2012, 2013; Liu et al. 2013; Gagné et al. 2015b; Filippazzo et al. 2015). Metchev & Hillenbrand (2006) made the first connection between age and cloudiness in their study of the young companion HD 203030B, whose transition to the cloud-free T spectral class appears to be delayed by the presence of thick clouds. In a detailed study of the prototypical isolated, young brown dwarf 2M0355 + 1133, Faherty et al. (2013) found that the deviant colors and fainter absolute magnitudes were best explained by enhanced dust or thick photospheric clouds, shifting the flux to longer wavelengths. At the coldest temperatures where clouds should all but have dispersed below the photosphere in field brown dwarfs, Burgasser et al. (2010b) studied the T8 dwarf Ross 458C and found that clouds must be considered as an important opacity source for young T dwarfs.
Exoplanet studies have independently found similar trends with age and cloud properties. The young planetary-mass companions 2M1207b (<10 MJup) and HR8799 b (<10 MJup) are exceedingly red in the near-infrared and up to 2 mag fainter than field brown dwarfs of similar Teff (Mohanty et al. 2007; Marois et al. 2008, 2010). To reproduce their anomalous observables, theorists have developed "enhanced" cloudy atmospheric models with non-equilibrium chemistry (Barman et al. 2011a, 2011b; Madhusudhan et al. 2011; Marley et al. 2012) in which lower surface gravity alters the vertical mixing which then leads to high altitude clouds with differing physical composition (e.g., thicker or thinner aggregations).
In general, M, L, T, and Y classifications identify brown dwarfs. If the source is older (>2–3 Gyr), then late-type M and early L dwarfs are stars. However, if the source is young (<1 Gyr), then even those warmer classifications will describe an object that is <75 MJup. To date, all directly imaged giant exoplanets have observable properties which lead to their classification squarely in this well-studied regime. Planetary-mass companions such as 2M1207b, 51 Eri b, β Pictoris b, ROXs 42B b, and the giant planets orbiting HR8799 have observables that are similar to L or T brown dwarfs (Chauvin et al. 2004; Marois et al. 2008, 2010; Lagrange et al. 2010; Currie et al. 2014; Kraus et al. 2014; Macintosh et al. 2015). Furthermore, there exists a population of "classical" brown dwarfs that overlap in effective temperature, age (many in the same moving group), and mass with directly observed planetary-mass companions (e.g., PSO318, SDSS1110, 0047+6803; Gizis et al. 2012, 2015; Liu et al. 2013; Gagné et al. 2015c). Studies of these two populations in concert may resolve questions of the formation of companions versus isolated equivalents and help to untangle atmosphere, temperature, age, and metallicity effects on the observables.
In this work, we examine this new population of suspected young, low surface gravity sources that are excellent exoplanet analogs. In Section 2, we explain the sample examined in this work and in Section 3 we describe the imaging and spectral data acquired. In Section 4, we review new near-infrared spectral types designated in this work and in Section 5 we discuss how we measured new radial velocities. In Section 6, we assess the likelihood of membership in nearby moving groups such as β Pictoris, AB Doradus, Argus, Columba, TW Hydrae, and Tucana Horologium. In Section 7, we review the diversity of the whole sample in spectral features, infrared colors, absolute magnitudes, bolometric luminosities, and effective temperatures. In Section 8, we place the young brown dwarf sample in context with directly imaged planetary-mass companions. Conclusions are presented in Section 9.
2. THE SAMPLE
Given the age-mass degeneracy of substellar-mass objects and an age range of ∼5–130 Myr for groups such as TW Hydrae (5–15 Myr; Weinberger et al. 2013), β Pictoris (20–26 Myr; Binks & Jeffries 2014; Malo et al. 2014), and AB Doradus (110–130 Myr; Zuckerman et al. 2004; Barenfeld et al. 2013), the target temperature for our sample was Teff < 3000 K, or, equivalently, sources with spectral types of M7 or later. This cut-off restricted us to <0.07 M☉, or the classic brown dwarf boundary (Hayashi & Nakano 1963; Kumar 1963).
The suspicion of membership in a nearby moving group should be accompanied by observed signatures of youth as kinematics alone leave doubt about chance contamination from the field sample. As such, for this work, we focused on > M7 objects with confirmed spectral signatures of low-gravity in either the optical or the infrared. We note that while there are isolated T dwarfs which are thought to be young (e.g., SDSS1110, Gagné et al. 2015a; CFBDSIR 2149, Delorme et al. 2012), their spectral peculiarities appear to be subtle making them more difficult to identify and investigate (see also Best et al. 2015).
For isolated late-type M and L dwarfs suspected to be young, there are strong spectral differences in the strength of the alkali lines and metal oxide absorption bands as well as the shape of the near-infrared H band (∼1.65 μm ) compared to older field age counterparts (e.g., Lucas et al. 2001; Gorlova et al. 2003; Luhman et al. 2004; McGovern et al. 2004; Allers et al. 2007; Rice et al. 2010, 2011; Patience et al. 2012; Faherty et al. 2013). Physically this can be explained by a change in the balance between ionized and neutral atomic and molecular species, as a result of lower surface gravity and, consequently, lower gas densities in the photospheric layers (Kirkpatrick et al. 2006). Furthermore, a lower surface gravity is linked to a decrease in collision induced H2 absorption (see, e.g., Tokunaga & Kobayashi 1999; Canty et al. 2013). Changes in the amount of this absorption result in the K band (∼2.2 μm ) being suppressed (or enhanced) and the shape of the H band being modeified to cause the "peaky" H band relative to water opacity seen in young sources (see Rice et al. 2011).
The collection of brown dwarfs with spectral signatures of a low surface gravity is increasing.13 Gagné et al. (2014c, 2015b, 2015c) presented a bayesian analysis of the brown dwarf population looking for potential new moving group members and uncovered numerous low-gravity sources. Allers & Liu (2013) presented a near-infrared spectroscopic study of a large number of known sources. Aside from those extensive studies, objects have been reported singly in paper (e.g., Kirkpatrick et al. 2006; Rice et al. 2010; Gizis et al. 2012; Faherty et al. 2013; Liu et al. 2013; Gagné et al. 2014a, 2014b, 2015a; Gauza et al. 2015) or included as a subset to a larger compilation of field objects (e.g., Cruz et al. 2007; Reid et al. 2007; Kirkpatrick et al. 2010; Thompson et al. 2013). The objects within this paper were drawn from the literature as well as our ongoing search for new low surface gravity objects.
The 152 low surface gravity14 objects examined in this work are listed in Table 1 with their coordinates, spectral types, gravity classifications (optical and infrared as applicable), as well as 2MASS and WISE photometry. There are 48 sources in this sample that are lacking an optical spectral type and 8 sources lacking an infrared spectral type. Of the 96 objects with both optical and near-infrared data, there are 67 sources (70%) that have a different optical spectral type than the infrared although the majority are within 1 subtype of each other.
Table 1. Photometric Properties of Low Surface Gravity Dwarfs
| 2MASS Designation | SpT | SpT | J | H | K | W1 | W2 | W3 | W4 | |
|---|---|---|---|---|---|---|---|---|---|---|
| OpT | IR | 2MASS | 2MASS | 2MASS | WISE | WISE | WISE | WISE | Referencese | |
| (1) | (2) | (3) | (4) | (5) | (6) | (7) | (8) | (9) | (10) | (11) |
| 00011217+1535355 | – – | L4 β | 15.522 ± 0.061 | 14.505 ± 0.052 | 13.71 ± 0.043 | 12.938 ± 0.023 | 12.517 ± 0.026 | 11.498 ± 0.177 | 8.953 ± – | 5 |
| 00040288–6410358 | L1 γ | L1 γa | 15.786 ± 0.071 | 14.831 ± 0.073 | 14.010 ± 0.045 | 13.370 ± 0.025 | 12.937 ± 0.027 | 12.178 ± 0.244 | 9.161 ± – | 15, 27 |
| 00182834–6703130 | – – | L0 γ | 15.457 ± 0.057 | 14.48 ± 0.061 | 13.711 ± 0.039 | 13.171 ± 0.025 | 12.768 ± 0.026 | 12.763 ± 0.445 | 9.046 ± – | 5 |
| 00191296–6226005 | – – | L1 γ | 15.64 ± 0.06 | 14.618 ± 0.054 | 13.957 ± 0.051 | 13.351 ± 0.025 | 12.883 ± 0.026 | 12.378 ± 0.262 | 9.114 ± – | 5 |
| 00192626+4614078 | M8 – | M8 β | 12.603 ± 0.017 | 11.940 ± 0.021 | 11.502 ± 0.011 | 11.260 ± 0.023 | 11.001 ± 0.020 | 10.857 ± 0.070 | 9.401 ± – | 7, 5 |
| 00274197+0503417 | M9.5 β | L0 βa | 16.189 ± 0.092 | 15.288 ± 0.099 | 14.960 ± 0.115 | 14.619 ± 0.036 | 14.135 ± 0.054 | 12.239 ± – | 8.890 ± – | 6, 27, 36 |
| 00303013–1450333 | L7 – | L4-L6 β | 16.278 ± 0.111 | 15.273 ± 0.1 | 14.481 ± 0.1 | 13.657 ± 0.028 | 13.263 ± 0.034 | 12.275 ± – | 9.149 ± – | 18, 5 |
| 00325584–4405058 | L0 γ | L0 β | 14.776 ± 0.032 | 13.857 ± 0.032 | 13.270 ± 0.035 | 12.820 ± 0.025 | 12.490 ± 0.025 | 11.726 ± 0.187 | 9.289 ± – | 2, 6, 27 |
| 003323.86–152130 | L4 β | L1 | 15.286 ± 0.056 | 14.208 ± 0.051 | 13.410 ± 0.039 | 12.801 ± 0.025 | 12.479 ± 0.027 | 11.888 ± 0.247 | 8.879 ± – | 2, 6, 27 |
| 00344300–4102266 | – – | L1 β | 15.707 ± 0.066 | 14.807 ± 0.064 | 14.084 ± 0.056 | 13.498 ± 0.026 | 13.098 ± 0.03 | 12.596 ± 0.394 | 9.285 ± – | 5 |
| 00374306–5846229 | L0 γ | – – | 15.374 ± 0.050 | 14.259 ± 0.051 | 13.590 ± 0.044 | 13.125 ± 0.026 | 12.738 ± 0.027 | 12.557 ± 0.380 | 9.324 ± – | 2 |
| 00381489–6403529 | – – | M9.5 β | 14.523 ± 0.03 | 13.867 ± 0.045 | 13.395 ± 0.033 | 12.904 ± 0.024 | 12.539 ± 0.024 | 11.746 ± 0.175 | 9.374 ± – | 5 |
| 00425923+1142104 | – – | M9 β | 14.754 ± 0.036 | 14.074 ± 0.042 | 13.514 ± 0.027 | 13.237 ± 0.026 | 12.918 ± 0.03 | 12.175 ± – | 9.151 ± – | 5 |
| 00452143+1634446 | L2 β | L2 γa | 13.059 ± 0.018 | 12.059 ± 0.034 | 11.370 ± 0.019 | 10.768 ± 0.023 | 10.393 ± 0.019 | 9.735 ± 0.040 | 8.424 ± 0.261 | 2, 6, 27 |
| 00464841+0715177 | M9 β | L0 δ | 13.885 ± 0.026 | 13.178 ± 0.034 | 12.550 ± 0.025 | 12.070 ± 0.026 | 11.638 ± 0.022 | 11.139 ± 0.181 | 9.024 ± – | 1, 5, 27 |
| 00470038+6803543 | L7 (γ?) | L6-L8 γ | 15.604 ± 0.068 | 13.968 ± 0.041 | 13.053 ± 0.029 | 11.876 ± 0.023 | 11.268 ± 0.020 | 10.327 ± 0.072 | 9.095 ± 0.453 | 34, 35 |
| 00550564+0134365 | L2 γ | L2 γa | 16.436 ± 0.114 | 15.270 ± 0.074 | 14.440 ± 0.068 | 13.682 ± 0.027 | 13.204 ± 0.033 | 11.988 ± – | 8.477 ± – | 27, 36 |
| 00584253–0651239 | L0 – | L1 β | 14.311 ± 0.023 | 13.444 ± 0.028 | 12.904 ± 0.032 | 12.562 ± 0.025 | 12.248 ± 0.027 | 11.692 ± 0.411 | 8.739 ± – | 18, 5 |
| 01033203+1935361 | L6 β | L6 β | 16.288 ± 0.079 | 14.897 ± 0.055 | 14.149 ± 0.058 | 13.178 ± 0.024 | 12.696 ± 0.027 | 12.234 ± 0.325 | 8.290 ± – | 8, 5 |
| 01174748–3403258 | L1 β | L1 βa | 15.178 ± 0.034 | 14.209 ± 0.038 | 13.490 ± 0.036 | 13.028 ± 0.025 | 12.623 ± 0.026 | 11.802 ± 0.186 | 9.215 ± – | 7, 6, 27 |
| 01205114–5200349 | – – | L1 γ | 15.642 ± 0.071 | 14.66 ± 0.072 | 13.752 ± 0.053 | 13.23 ± 0.026 | 12.778 ± 0.026 | 11.847 ± 0.168 | 8.949 ± – | 5 |
| 01231125–6921379 | M7.5 γ | – – | 12.320 ± 0.019 | 11.711 ± 0.024 | 11.323 ± 0.024 | 11.060 ± 0.023 | 10.818 ± 0.021 | 10.595 ± 0.062 | 9.426 ± – | 4 |
| 01244599–5745379 | L0 γ | L0 γa | 16.308 ± 0.104 | 15.059 ± 0.088 | 14.320 ± 0.088 | 13.773 ± 0.026 | 13.342 ± 0.032 | 12.449 ± 0.313 | 8.908 ± – | 2, 27 |
| 01262109+1428057 | L4 γ | L2 γ | 17.108 ± 0.214 | 16.172 ± 0.218 | 15.280 ± 0.145 | 14.237 ± 0.029 | 13.702 ± 0.037 | 12.379 ± – | 9.127 ± – | 21, 6 |
| 01294256–0823580 | M5 – | M7 β | 10.655 ± 0.021 | 10.085 ± 0.023 | 9.771 ± 0.023 | 9.545 ± 0.022 | 9.327 ± 0.02 | 9.206 ± 0.032 | 8.891 ± 0.458 | 17, 5 |
| 01415823–4633574 | L0 γ | L0 γ | 14.832 ± 0.041 | 13.875 ± 0.024 | 13.100 ± 0.030 | 12.551 ± 0.024 | 12.170 ± 0.022 | 11.921 ± 0.212 | 9.243 ± – | 2, 6, 28 |
| 01531463–6744181 | L2 – | L3 β | 16.412 ± 0.134 | 15.109 ± 0.086 | 14.424 ± 0.103 | 13.713 ± 0.026 | 13.216 ± 0.028 | 12.514 ± 0.28 | 9.335 ± – | 1, 5 |
| 02103857–3015313 | L0 γ | L0 γa | 15.066 ± 0.047 | 14.161 ± 0.044 | 13.500 ± 0.042 | 13.003 ± 0.026 | 12.652 ± 0.026 | 11.934 ± 0.195 | 9.355 ± – | 5, 27 |
| 02212859–6831400 | M8 β | – – | 13.965 ± 0.033 | 13.275 ± 0.032 | 12.806 ± 0.037 | 12.471 ± 0.024 | 12.192 ± 0.023 | 11.604 ± 0.107 | 9.614 ± – | 27 |
| 02215494–5412054 | M9 β | – – | 13.902 ± 0.031 | 13.221 ± 0.031 | 12.670 ± 0.030 | 12.325 ± 0.024 | 11.963 ± 0.022 | 11.440 ± 0.122 | 9.481 ± – | 1, 13, 27 |
| 02235464–5815067 | L0 γ | – – | 15.070 ± 0.048 | 14.003 ± 0.036 | 13.420 ± 0.042 | 12.819 ± 0.024 | 12.431 ± 0.024 | 11.644 ± 0.154 | 9.466 ± – | 2 |
| 02251947–5837295 | M9 β | M9 γa | 13.738 ± 0.025 | 13.058 ± 0.025 | 12.560 ± 0.026 | 12.234 ± 0.024 | 11.926 ± 0.023 | 11.994 ± 0.190 | 9.218 ± – | 27, 36 |
| 02265658–5327032 | – – | L0 δ | 15.403 ± 0.044 | 14.346 ± 0.05 | 13.752 ± 0.045 | 13.219 ± 0.025 | 12.783 ± 0.026 | 11.58 ± 0.14 | 8.64 ± 0.256 | 5 |
| 02292794–0053282 | – – | L0 γ | 16.490 ± 0.099 | 15.746 ± 0.099 | 15.182 ± 0.138 | 14.720 ± 0.032 | 14.328 ± 0.045 | 12.679 ± – | 8.724 ± – | 6 |
| 02340093–6442068 | L0 γ | L0β γa | 15.325 ± 0.062 | 14.442 ± 0.055 | 13.850 ± 0.069 | 13.247 ± 0.025 | 12.905 ± 0.026 | 12.619 ± 0.279 | 9.494 ± – | 15, 27 |
| 02410564–5511466 | – – | L1 γ | 15.387 ± 0.057 | 14.326 ± 0.052 | 13.739 ± 0.038 | 13.185 ± 0.023 | 12.809 ± 0.026 | 12.249 ± 0.242 | 9.349 ± – | 5 |
| 02411151–0326587 | L0 γ | L1 γ | 15.799 ± 0.064 | 14.811 ± 0.053 | 14.040 ± 0.049 | 13.638 ± 0.025 | 13.256 ± 0.029 | 12.766 ± 0.415 | 9.000 ± – | 14, 6 |
| 02501167–0151295f | – – | M7 β | 12.886 ± 0.026 | 12.278 ± 0.021 | 11.909 ± 0.017 | 11.691 ± 0.023 | 11.451 ± 0.022 | 11.035 ± 0.158 | 8.827 ± – | 5 |
| 02530084+1652532d | M6.5 – | M7 βd | 8.394 ± 0.021 | 7.883 ± 0.037 | 7.585 ± 0.043 | 7.322 ± 0.027 | 7.057 ± 0.02 | 6.897 ± 0.017 | 6.718 ± 0.076 | 20, 25, 5 |
| 02535980+3206373 | M7 β | M6 β | 13.616 ± 0.021 | 12.931 ± 0.020 | 12.550 ± 0.023 | 12.324 ± 0.025 | 12.127 ± 0.024 | 11.808 ± 0.250 | 8.509 ± – | 27, 36 |
| 02583123–1520536 | – – | L3 β | 15.908 ± 0.072 | 14.866 ± 0.06 | 14.192 ± 0.055 | 13.623 ± 0.025 | 13.194 ± 0.028 | 12.578 ± 0.305 | 9.542 ± – | 5 |
| 03032042–7312300 | L2 γ | – – | 16.137 ± 0.107 | 15.096 ± 0.085 | 14.320 ± 0.084 | 13.777 ± 0.025 | 13.350 ± 0.026 | 12.288 ± 0.167 | 9.344 ± 0.341 | 15 |
| 03164512–2848521 | L0 – | L1 β | 14.578 ± 0.039 | 13.772 ± 0.035 | 13.114 ± 0.035 | 12.649 ± 0.023 | 12.312 ± 0.023 | 11.743 ± 0.125 | 9.364 ± – | 7, 5 |
| 03231002–4631237 | L0 γ | L0 γa | 15.389 ± 0.069 | 14.321 ± 0.061 | 13.700 ± 0.050 | 13.075 ± 0.024 | 12.665 ± 0.024 | 11.939 ± 0.160 | 9.180 ± – | 2, 27 |
| 03264225–2102057 | L5 β | L5 βγa | 16.134 ± 0.093 | 14.793 ± 0.075 | 13.920 ± 0.065 | 12.950 ± 0.024 | 12.435 ± 0.023 | 12.173 ± 0.203 | 9.663 ± – | 5, 27 |
| 03350208+2342356 | M8.5 – | M7.5 β | 12.250 ± 0.017 | 11.655 ± 0.020 | 11.261 ± 0.014 | 11.044 ± 0.023 | 10.767 ± 0.020 | 10.762 ± 0.130 | 8.932 ± – | 12, 6 |
| 03393521–3525440 | M9 β | L0 β | 10.725 ± 0.018 | 10.017 ± 0.020 | 9.550 ± 0.021 | 9.133 ± 0.022 | 8.808 ± 0.019 | 8.272 ± 0.017 | 7.997 ± 0.110 | 12, 6, 27 |
| 03420931–2904317 | – – | L0 β | 15.918 ± 0.085 | 15.353 ± 0.106 | 14.378 ± 0.085 | 13.969 ± 0.027 | 13.54 ± 0.032 | 12.673 ± – | 9.237 ± – | 5 |
| 03421621–6817321 | L4 γ | – – | 16.854 ± 0.138 | 15.386 ± 0.086 | 14.541 ± 0.089 | 13.955 ± 0.025 | 13.482 ± 0.025 | 12.994 ± 0.405 | 9.723 ± – | 5 |
| 03550477–1032415 | M8.5 – | M8.5 β | 13.08 ± 0.025 | 12.462 ± 0.024 | 11.975 ± 0.023 | 11.712 ± 0.024 | 11.425 ± 0.022 | 10.865 ± 0.095 | 8.627 ± 0.309 | 5, 36 |
| 03552337+1133437 | L5 γ | L3-L6 γ | 14.050 ± 0.020 | 12.530 ± 0.029 | 11.530 ± 0.019 | 10.528 ± 0.023 | 9.943 ± 0.021 | 9.294 ± 0.038 | 8.317 ± – | 2, 5, 21 |
| 03572695–4417305 | L0 β | L0 β | 14.367 ± 0.029 | 13.531 ± 0.025 | 12.910 ± 0.026 | 12.475 ± 0.023 | 12.086 ± 0.021 | 11.600 ± 0.084 | 9.318 ± – | 14, 27 |
| 04062677–3812102 | L0 γ | L1 γ | 16.768 ± 0.126 | 15.711 ± 0.101 | 15.110 ± 0.116 | 14.449 ± 0.030 | 14.100 ± 0.041 | 12.520 ± – | 9.097 ± – | 15, 6 |
| 04185879–4507413 | – – | L3 γ | 16.163 ± 0.084 | 15.046 ± 0.074 | 14.595 ± 0.088 | 13.864 ± 0.027 | 13.455 ± 0.03 | 12.783 ± – | 9.642 ± – | 5 |
| 04210718–6306022 | L5 β | L5 γa | 15.565 ± 0.048 | 14.284 ± 0.040 | 13.450 ± 0.042 | 12.558 ± 0.022 | 12.135 ± 0.021 | 11.598 ± 0.095 | 9.245 ± – | 2, 27 |
| 04351455–1414468 | M8 γ | M7 γa | 11.879 ± 0.029 | 10.622 ± 0.027 | 9.951 ± 0.021 | 9.711 ± 0.024 | 9.268 ± 0.021 | 9.136 ± 0.034 | 8.514 ± 0.310 | 27, 36 |
| 04362788–4114465 | M8β | M9 γ | 13.097 ± 0.023 | 12.430 ± 0.020 | 12.050 ± 0.024 | 11.740 ± 0.023 | 11.460 ± 0.021 | 11.111 ± 0.082 | 9.184 ± – | 13, 6, 27 |
| 04400972–5126544 | – – | L0 γ | 15.685 ± 0.069 | 14.779 ± 0.056 | 14.171 ± 0.06 | 13.585 ± 0.024 | 13.193 ± 0.026 | 12.371 ± 0.211 | 8.929 ± – | 5 |
| 04433761+0002051 | M9 γ | M9 γ | 12.507 ± 0.023 | 11.804 ± 0.022 | 11.220 ± 0.019 | 10.826 ± 0.024 | 10.476 ± 0.021 | 10.031 ± 0.054 | 8.423 ± – | 3, 6 |
| 04493288+1607226 | – – | M9 γ | 14.272 ± 0.026 | 13.49 ± 0.03 | 13.077 ± 0.029 | 12.73 ± 0.025 | 12.423 ± 0.027 | 11.507 ± 0.216 | 8.871 ± – | 5 |
| 05012406–0010452 | L4 γ | L3 γa | 14.982 ± 0.036 | 13.713 ± 0.033 | 12.960 ± 0.034 | 12.050 ± 0.024 | 11.518 ± 0.022 | 10.952 ± 0.107 | 9.165 ± – | 2, 6, 27 |
| 05104958–1843548 | – – | L2 β | 15.352 ± 0.056 | 14.341 ± 0.053 | 13.813 ± 0.055 | 13.256 ± 0.025 | 12.94 ± 0.029 | 12.68 ± – | 9.188 ± – | 5 |
| 05120636–2949540 | L5 γ | L5 βa | 15.463 ± 0.055 | 14.156 ± 0.047 | 13.290 ± 0.041 | 12.378 ± 0.023 | 11.921 ± 0.023 | 11.329 ± 0.105 | 9.103 ± – | 14, 5, 27 |
| 05181131–3101529 | M6.5 – | M7 β | 11.878 ± 0.026 | 11.234 ± 0.022 | 10.9 ± 0.019 | 10.641 ± 0.023 | 10.403 ± 0.019 | 10.111 ± 0.043 | 9.127 ± 0.457 | 26, 5 |
| 05184616–2756457 | L1 γ | L1 γ | 15.262 ± 0.041 | 14.295 ± 0.045 | 13.620 ± 0.039 | 13.045 ± 0.024 | 12.661 ± 0.026 | 12.581 ± 0.349 | 9.219 ± – | 3, 6 |
| 05264316–1824315 | – – | M7 β | 12.358 ± 0.019 | 11.836 ± 0.022 | 11.448 ± 0.021 | 11.201 ± 0.023 | 10.944 ± 0.021 | 10.79 ± 0.081 | 8.984 ± – | 5 |
| 05341594–0631397 | M8 γ | M8 γ | 16.054 ± 0.076 | 15.369 ± 0.096 | 14.940 ± 0.097 | 14.785 ± 0.036 | 14.256 ± 0.056 | 11.590 ± – | 8.265 ± 0.295 | 27, 36 |
| 05361998–1920396 | L2 γ | L2 γa | 15.768 ± 0.073 | 14.693 ± 0.070 | 13.850 ± 0.061 | 13.262 ± 0.026 | 12.789 ± 0.027 | 12.551 ± 0.395 | 9.242 ± – | 3, 6, 27 |
| 05402325–0906326 | – – | M9 β | 14.586 ± 0.037 | 13.849 ± 0.035 | 13.33 ± 0.047 | 13.03 ± 0.025 | 12.744 ± 0.028 | 11.967 ± 0.267 | 8.938 ± – | 5 |
| 05575096–1359503 | M7 – | M7 γ | 12.871 ± 0.019 | 12.145 ± 0.026 | 11.732 ± 0.021 | 11.336 ± 0.023 | 10.803 ± 0.020 | 7.889 ± 0.017 | 5.020 ± 0.025 | 27, 36 |
| 06023045+3910592 | L1 – | L1 β | 12.300 ± 0.018 | 11.451 ± 0.019 | 10.865 ± 0.018 | 10.435 ± 0.022 | 10.124 ± 0.022 | 9.591 ± 0.040 | 8.428 ± – | 24, 6 |
| 06085283–2753583 | M8.5 γ | L0 γ | 13.595 ± 0.026 | 12.897 ± 0.024 | 12.370 ± 0.024 | 11.976 ± 0.024 | 11.623 ± 0.021 | 11.314 ± 0.113 | 9.093 ± – | 14, 6 |
| 06272161–5308428 | – – | L0 β γ | 16.385 ± 0.113 | 15.234 ± 0.091 | 14.69 ± 0.087 | 13.883 ± 0.026 | 13.502 ± 0.029 | 13.392 ± 0.504 | 9.74 ± – | 5 |
| 06322402–5010349 | L3 β | L4 γ | 15.024 ± 0.041 | 14.031 ± 0.038 | 13.337 ± 0.029 | 12.610 ± 0.023 | 12.169 ± 0.022 | 11.729 ± 0.146 | 8.919 ± – | 5 |
| 06524851–5741376 | M8 β | – – | 13.632 ± 0.025 | 12.965 ± 0.022 | 12.450 ± 0.021 | 12.153 ± 0.023 | 11.857 ± 0.021 | 11.041 ± 0.053 | 9.600 ± 0.373 | 1, 13 |
| 07123786–6155528 | L1 β | L1 γa | 15.296 ± 0.062 | 14.392 ± 0.042 | 13.670 ± 0.048 | 12.991 ± 0.024 | 12.626 ± 0.022 | 11.478 ± 0.095 | 9.512 ± – | 2, 27 |
| 07140394+3702459 | M8 – | M7.5 β | 11.976 ± 0.019 | 11.252 ± 0.028 | 10.838 ± 0.017 | 10.566 ± 0.024 | 10.346 ± 0.02 | 10.202 ± 0.057 | 8.798 ± – | 4,1,13, 27 |
| 08095903+4434216 | – – | L6p | 16.437 ± 0.114 | 15.184 ± 0.097 | 14.417 ± 0.058 | 13.344 ± 0.026 | 12.81 ± 0.028 | 11.785 ± 0.206 | 9.055 ± – | 5 |
| 08561384–1342242 | – – | M8 γ | 13.602 ± 0.023 | 12.976 ± 0.028 | 12.489 ± 0.023 | 12.154 ± 0.023 | 11.62 ± 0.022 | 9.882 ± 0.046 | 8.376 ± 0.271 | 5 |
| 08575849+5708514 | L8 – | L8 – | 15.038 ± 0.038 | 13.79 ± 0.041 | 12.962 ± 0.028 | 12.019 ± 0.024 | 11.415 ± 0.021 | 10.376 ± 0.058 | 8.569 ± 0.27 | 14, 5 |
| 09451445–7753150 | – – | M9 β | 13.893 ± 0.028 | 13.232 ± 0.029 | 12.787 ± 0.029 | 12.512 ± 0.022 | 12.279 ± 0.022 | 12.216 ± – | 9.343 ± – | 5 |
| 09532126–1014205 | M9 γ | M9 βa | 13.469 ± 0.026 | 12.644 ± 0.026 | 12.140 ± 0.021 | 11.757 ± 0.023 | 11.404 ± 0.021 | 10.761 ± 0.100 | 8.719 ± – | 3, 5, 27 |
| 09593276+4523309 | – – | L3 γ | 15.880 ± 0.070 | 14.759 ± 0.068 | 13.673 ± 0.044 | 12.860 ± 0.025 | 12.363 ± 0.025 | 11.654 ± 0.170 | 9.044 ± – | 27 |
| G196-3B | L3 β | L3 γ | 14.831 ± 0.045 | 13.648 ± 0.042 | 12.778 ± 0.033 | – ± – | – ± – | – ± – | – ± – | 14, 5 |
| 10212570–2830427 | – – | L4 β γ | 16.914 ± 0.154 | 15.851 ± 0.112 | 14.981 ± 0.124 | 14.158 ± 0.03 | 13.677 ± 0.038 | 12.431 ± – | 9.247 ± – | 5 |
| 10220489+0200477 | M9 β | M9 β | 14.100 ± 0.029 | 13.398 ± 0.030 | 12.900 ± 0.030 | 12.612 ± 0.025 | 12.340 ± 0.029 | 11.965 ± 0.411 | 8.531 ± – | 1, 8, 6 |
| 10224821+5825453 | L1 β | L1 β | 13.499 ± 0.023 | 12.642 ± 0.031 | 12.160 ± 0.023 | 11.762 ± 0.023 | 11.496 ± 0.021 | 11.200 ± 0.109 | 9.133 ± – | 14, 6 |
| TWA 28 | M8.5 γ | M9γa | 13.034 ± 0.021 | 12.356 ± 0.020 | 11.890 ± 0.023 | 11.435 ± 0.024 | 10.793 ± 0.021 | 9.385 ± 0.033 | 8.021 ± 0.186 | 23, 6, 27 |
| 11064461–3715115 | – – | M9 γ | 14.487 ± 0.028 | 13.845 ± 0.026 | 13.339 ± 0.038 | 13.072 ± 0.025 | 12.753 ± 0.027 | 12.19 ± – | 9.049 ± – | 5 |
| 11083081+6830169 | L1 γ | L1 γ | 13.123 ± 0.02 | 12.235 ± 0.019 | 11.583 ± 0.017 | 11.103 ± 0.024 | 10.754 ± 0.021 | 10.205 ± 0.043 | 9.494 ± – | 5 |
| 11193254–1137466c | – – | L7 γ | 17.474 ± 0.058 | 15.788 ± 0.034 | 14.751 ± 0.012 | 13.548 ± 0.026 | 12.883 ± 0.027 | 12.244 ± 0.411 | 8.940 ± – | 32, 33 |
| 11271382–3735076 | – – | L0 δ | 16.469 ± 0.097 | 15.568 ± 0.107 | 15.229 ± 0.155 | 14.462 ± 0.032 | 14.103 ± 0.047 | 11.804 ± 0.185 | 9.229 ± – | 5 |
| TWA26 | M9 γ | M9 γ | 12.686 ± 0.026 | 11.996 ± 0.022 | 11.503 ± 0.023 | 11.155 ± 0.023 | 10.793 ± 0.020 | 10.626 ± 0.075 | 8.479 ± – | 1, 6, 5 |
| 114724.10–204021.3c | – – | L7 γ | 17.637 ± 0.058 | 15.764 ± 0.112 | 14.872 ± 0.011 | 13.718 ± 0.026 | 13.090 ± 0.030 | 12.155 ± – | 8.913 ± – | 31 |
| 11480096–2836488 | – – | L1 β | 16.113 ± 0.079 | 15.186 ± 0.081 | 14.563 ± 0.084 | 14.139 ± 0.029 | 13.774 ± 0.039 | 12.229 ± - | 9.24 ± - | 5 |
| 11544223–3400390 | L0 β | L1 βa | 14.195 ± 0.031 | 13.331 ± 0.027 | 12.850 ± 0.032 | 12.350 ± 0.023 | 12.037 ± 0.023 | 11.369 ± 0.106 | 9.548 ± – | 14, 5, 27 |
| TWA27A | M8 γ | M8 γ | 13.000 ± 0.030 | 12.390 ± 0.030 | 11.950 ± 0.030 | 11.556 ± 0.023 | 11.009 ± 0.020 | 9.456 ± 0.027 | 8.029 ± 0.133 | 10, 6, 27 |
| 12074836–3900043 | L0 γ | L1 γ | 15.494 ± 0.058 | 14.608 ± 0.049 | 14.040 ± 0.060 | 13.634 ± 0.025 | 13.215 ± 0.028 | 13.202 ± 0.530 | 9.196 ± – | 19 |
| 12271545–0636458 | M9 – | M8.5 β | 14.195 ± 0.025 | 13.389 ± 0.032 | 12.884 ± 0.034 | 12.516 ± 0.03 | 12.259 ± 0.027 | 11.851 ± 0.279 | 9.036 ± – | 7, 5 |
| TWA29 | M9.5 γ | L0 γ | 14.518 ± 0.032 | 13.800 ± 0.033 | 13.369 ± 0.036 | 12.994 ± 0.023 | 12.623 ± 0.023 | 12.562 ± – | 9.093 ± – | 11, 6, 27 |
| 12474428–3816464 | – – | M9 γ | 14.785 ± 0.033 | 14.096 ± 0.036 | 13.573 ± 0.039 | 13.108 ± 0.024 | 12.523 ± 0.025 | 10.953 ± 0.077 | 8.841 ± 0.293 | 19 |
| 12535039–4211215 | – – | M9.5 γ | 16.002 ± 0.104 | 15.3 ± 0.104 | 14.739 ± 0.106 | 14.279 ± 0.027 | 13.92 ± 0.036 | 12.591 ± – | 9.66 ± – | 5 |
| 12563961–2718455 | – – | L4 βa | 16.416 ± 0.128 | 15.374 ± 0.122 | 14.709 ± 0.093 | 14.088 ± 0.027 | 13.695 ± 0.034 | 12.474 ± 0.313 | 9.452 ± – | 5, 27 |
| 14112131–2119503 | M9 β | M8 βa | 12.437 ± 0.018 | 11.826 ± 0.026 | 11.330 ± 0.019 | 11.077 ± 0.023 | 10.815 ± 0.022 | 10.648 ± 0.065 | 8.812 ± – | 7, 5, 27 |
| 14252798–3650229 | L3 – | L4 γ | 13.747 ± 0.028 | 12.575 ± 0.022 | 11.805 ± 0.027 | 10.998 ± 0.022 | 10.576 ± 0.020 | 10.010 ± 0.042 | 9.566 ± – | 1, 5 |
| 15104786–2818174 | M9 – | M9 β | 12.838 ± 0.028 | 12.11 ± 0.032 | 11.687 ± 0.03 | 11.315 ± 0.025 | 11.012 ± 0.024 | 11.078 ± 0.196 | 8.25 ± – | 1, 5 |
| 15291017+6312539 | – – | M8 β | 11.643 ± 0.021 | 10.937 ± 0.028 | 10.554 ± 0.023 | 10.29 ± 0.023 | 10.058 ± 0.021 | 9.719 ± 0.027 | 9.241 ± 0.331 | 5 |
| 15382417–1953116 | L4 γ | L4 γa | 15.934 ± 0.063 | 14.852 ± 0.060 | 14.000 ± 0.048 | 13.172 ± 0.027 | 12.721 ± 0.029 | 11.369 ± 0.177 | 8.808 ± – | 27, 36 |
| 15470557–1626303A | – – | M9 β | 13.864 ± 0.029 | 13.243 ± 0.029 | 12.735 ± 0.027 | 12.437 ± 0.024 | 12.144 ± 0.026 | 11.715 ± – | 8.549 ± – | 5 |
| 15474719–2423493 | M9 γ | L0 β | 13.970 ± 0.026 | 13.271 ± 0.032 | 12.740 ± 0.023 | 12.407 ± 0.025 | 12.105 ± 0.032 | 12.111 ± – | 8.739 ± – | 1 |
| 15515237+0941148 | L4 γ | >L5 γa | 16.319 ± 0.110 | 15.114 ± 0.071 | 14.310 ± 0.057 | 13.600 ± 0.025 | 13.121 ± 0.030 | 12.677 ± 0.478 | 9.156 ± – | 1, 27 |
| 15525906+2948485 | L0 β | L0 β | 13.478 ± 0.023 | 12.606 ± 0.024 | 12.020 ± 0.026 | 11.544 ± 0.023 | 11.207 ± 0.020 | 10.664 ± 0.049 | 9.003 ± – | 2, 6 |
| 15575011–2952431 | M9 δ | L1 γa | 16.316 ± 0.119 | 15.450 ± 0.104 | 14.850 ± 0.111 | 14.435 ± 0.037 | 14.066 ± 0.058 | 12.154 ± 0.344 | 8.668 ± – | 15, 6, 27 |
| 16154255+4953211 | L4 γ | L3-L6 γ | 16.789 ± 0.137 | 15.332 ± 0.098 | 14.310 ± 0.069 | 13.202 ± 0.024 | 12.621 ± 0.022 | 12.131 ± 0.130 | 9.305 ± – | 3, 6 |
| 17111353+2326333 | L0 γ | L1 βa | 14.499 ± 0.024 | 13.668 ± 0.030 | 13.060 ± 0.026 | 12.581 ± 0.024 | 12.226 ± 0.024 | 11.662 ± 0.152 | 9.334 ± – | 3, 6, 27 |
| 17260007+1538190 | L3.5 γ | L3 γa | 15.669 ± 0.063 | 14.465 ± 0.045 | 13.660 ± 0.049 | 13.071 ± 0.025 | 12.694 ± 0.026 | 11.556 ± 0.157 | 9.309 ± – | 5, 27 |
| 17410280–4642218 | – – | L6-L8 γa | 15.786 ± 0.075 | 14.534 ± 0.054 | 13.438 ± 0.035 | 12.301 ± 0.025 | 11.675 ± 0.023 | 11.432 ± 0.190 | 8.541 ± – | 5, 27 |
| 18212815+1414010 | L4.5– | L4 peca | 13.431 ± 0.021 | 12.396 ± 0.017 | 11.650 ± 0.019 | 10.853 ± 0.023 | 10.475 ± 0.020 | 9.928 ± 0.052 | 9.067 ± 0.534 | 27, 29, 30 |
| 19350976–6200473 | – – | L1 γ | 16.254 ± 0.105 | 15.293 ± 0.094 | 14.724 ± 0.098 | 14.059 ± 0.029 | 13.65 ± 0.039 | 12.881 ± – | 8.559 ± – | 5 |
| 19355595–2846343 | M9 γ | M9 γa | 13.953 ± 0.024 | 13.180 ± 0.020 | 12.710 ± 0.028 | 12.347 ± 0.026 | 11.910 ± 0.025 | 10.519 ± 0.076 | 8.636 ± – | 27, 36 |
| 19564700–7542270 | L0 γ | L2 γa | 16.154 ± 0.102 | 15.036 ± 0.096 | 14.230 ± 0.066 | 13.693 ± 0.027 | 13.249 ± 0.031 | 12.678 ± – | 9.171 ± – | 2, 27 |
| 20004841–7523070 | M9 γ | M9 γa | 12.734 ± 0.023 | 11.967 ± 0.026 | 11.510 ± 0.024 | 11.108 ± 0.023 | 10.797 ± 0.020 | 10.550 ± 0.069 | 8.548 ± – | 4, 5, 27 |
| 20025073–0521524 | L5 β | L5-L7 γa | 15.316 ± 0.049 | 14.278 ± 0.050 | 13.420 ± 0.035 | 12.532 ± 0.023 | 12.090 ± 0.026 | 11.441 ± 0.209 | 8.818 ± – | 3, 5, 27 |
| 20113196–5048112 | – – | L3 γ | 16.423 ± 0.109 | 15.257 ± 0.081 | 14.577 ± 0.082 | 14.009 ± 0.031 | 13.668 ± 0.038 | 12.431 ± – | 9.084 ± – | 5 |
| 20135152–2806020 | M9 γ | L0 γa | 14.242 ± 0.028 | 13.461 ± 0.027 | 12.940 ± 0.026 | 12.525 ± 0.028 | 12.163 ± 0.027 | 11.877 ± 0.276 | 8.663 ± – | 1, 6, 27 |
| 20282203–5637024 | – – | M8.5 γ | 13.837 ± 0.021 | 13.243 ± 0.027 | 12.71 ± 0.027 | 12.472 ± 0.022 | 12.173 ± 0.024 | 12.298 ± 0.315 | 8.669 ± – | 5 |
| 20334473–5635338 | – – | L0 γ | 15.718 ± 0.088 | 15.137 ± 0.109 | 14.244 ± 0.081 | 13.817 ± 0.027 | 13.415 ± 0.034 | 12.376 ± – | 9.27 ± – | 5 |
| 20391314–1126531 | M8 – | M7 β | 13.792 ± 0.024 | 13.129 ± 0.038 | 12.68 ± 0.028 | 12.465 ± 0.023 | 12.166 ± 0.024 | 12.596 ± 0.538 | 9.04 ± – | 7, 5 |
| 20575409–0252302 | L1.5 – | L2 β | 13.121 ± 0.021 | 12.268 ± 0.022 | 11.724 ± 0.023 | 11.261 ± 0.022 | 10.981 ± 0.020 | 10.431 ± 0.079 | 8.906 ± – | 7, 25, 27 |
| 21140802-2251358b c | – – | L6-L8 γa | 17.294 ± 0.08 | 15.624 ± 0.04 | 14.435 ± 0.04 | 13.216 ± 0.026 | 12.461 ± 0.031 | 11.838 ± 0.358 | 8.581 ± – | 9, 27 |
| 21265040–8140293 | L3 γ | L3 γa | 15.542 ± 0.055 | 14.405 ± 0.053 | 13.550 ± 0.041 | 12.910 ± 0.024 | 12.472 ± 0.023 | 11.885 ± 0.161 | 9.357 ± – | 2, 27 |
| 21324036+1029494 | – – | L4 β | 16.594 ± 0.138 | 15.366 ± 0.113 | 14.634 ± 0.1 | 14.03 ± 0.033 | 13.578 ± 0.042 | 12.383 ± 0.379 | 8.512 ± – | 5 |
| 21543454–1055308 | L4 β | L5 γa | 16.440 ± 0.121 | 15.069 ± 0.082 | 14.200 ± 0.068 | 13.367 ± 0.026 | 12.917 ± 0.029 | 12.054 ± 0.316 | 8.426 ± – | 22, 27 |
| 21544859–7459134 | – – | M9.5 β | 14.288 ± 0.029 | 13.568 ± 0.042 | 13.084 ± 0.032 | 12.708 ± 0.025 | 12.376 ± 0.025 | 11.991 ± 0.211 | 8.913 ± – | 5 |
| 21572060+8340575 | L0 – | M9 γ | 13.972 ± 0.026 | 13.066 ± 0.033 | 12.584 ± 0.025 | 12.088 ± 0.023 | 11.681 ± 0.021 | 11.007 ± 0.079 | 8.762 ± – | 5 |
| 22025794–5605087 | – – | M9 γ | 14.356 ± 0.034 | 13.616 ± 0.035 | 13.16 ± 0.036 | 12.809 ± 0.025 | 12.555 ± 0.025 | 11.728 ± 0.18 | 9.322 ± – | 5 |
| 22064498–4217208 | L4 γ | L4 γa | 15.555 ± 0.065 | 14.447 ± 0.061 | 13.610 ± 0.055 | 12.823 ± 0.024 | 12.376 ± 0.025 | 11.887 ± 0.222 | 9.259 ± – | 5, 27 |
| 22081363+2921215 | L3 γ | L3 γ | 15.797 ± 0.084 | 14.793 ± 0.070 | 14.150 ± 0.073 | 13.354 ± 0.027 | 12.888 ± 0.027 | 12.584 ± 0.391 | 9.298 ± – | 14, 5 |
| 22134491–2136079 | L0 γ | L0 γ | 15.376 ± 0.032 | 14.404 ± 0.055 | 13.760 ± 0.038 | 13.229 ± 0.027 | 12.832 ± 0.029 | 11.552 ± 0.203 | 9.070 ± – | 14, 6 |
| 22351658–3844154 | – – | L1.5 γ | 15.183 ± 0.051 | 14.272 ± 0.046 | 13.631 ± 0.044 | 13.007 ± 0.024 | 12.647 ± 0.027 | 12.535 ± 0.436 | 8.773 ± – | 5 |
| 22353560–5906306 | – – | M8.5 β | 14.281 ± 0.029 | 13.592 ± 0.037 | 13.168 ± 0.032 | 12.691 ± 0.024 | 12.363 ± 0.026 | 12.08 ± 0.309 | 9.094 ± – | 5 |
| 22443167+2043433 | L6.5p – | L6-L8 γa | 16.476 ± 0.140 | 14.999 ± 0.065 | 14.022 ± 0.073 | 12.777 ± 0.024 | 12.108 ± 0.024 | 11.136 ± 0.115 | 9.301 ± – | 14, 6, 27 |
| 22495345+0044046 | L4 γ | L3 βa | 16.587 ± 0.124 | 15.421 ± 0.109 | 14.360 ± 0.070 | 13.576 ± 0.027 | 13.144 ± 0.050 | 11.284 ± – | 7.687 ± – | 14, 6, 27 |
| 23153135+0617146 | L0 γ | L0 γa | 15.861 ± 0.082 | 14.757 ± 0.069 | 14.070 ± 0.063 | 13.552 ± 0.026 | 13.095 ± 0.031 | 11.671 ± 0.230 | 8.592 ± – | 27, 36 |
| 23224684–3133231 | L0 β | L2 β | 13.577 ± 0.027 | 12.789 ± 0.023 | 12.324 ± 0.024 | 11.974 ± 0.023 | 11.707 ± 0.023 | 11.253 ± 0.128 | 9.153 ± – | 1, 6 |
| 23225299–6151275 | L2 γ | L3 γa | 15.545 ± 0.061 | 14.535 ± 0.062 | 13.860 ± 0.042 | 13.243 ± 0.026 | 12.841 ± 0.029 | 12.679 ± 0.391 | 9.378 ± – | 2, 5, 27 |
| 23231347–0244360 | M8.5 – | M8 β | 13.58 ± 0.023 | 12.925 ± 0.03 | 12.481 ± 0.026 | 12.237 ± 0.025 | 11.954 ± 0.024 | 12.228 ± 0.391 | 8.512 ± – | 3, 5 |
| 23255604–0259508 | L3 – | L1 γ | 15.961 ± 0.077 | 14.935 ± 0.069 | 14.115 ± 0.056 | 13.695 ± 0.027 | 13.348 ± 0.034 | 11.883 ± – | 8.677 ± – | 16, 5 |
| 23360735–3541489 | – – | M9 β | 14.651 ± 0.025 | 13.809 ± 0.025 | 13.385 ± 0.041 | 13.002 ± 0.024 | 12.647 ± 0.026 | 12.518 ± 0.418 | 9.177 ± – | 5 |
| 23433470–3646021 | – – | L3-L6 γ | 16.568 ± 0.13 | 15.011 ± 0.063 | 14.194 ± 0.064 | 13.121 ± 0.024 | 12.612 ± 0.027 | 11.698 ± 0.188 | 9.138 ± – | 5 |
| 23453903+0055137 | M9 – | M9 β | 13.771 ± 0.027 | 13.117 ± 0.026 | 12.581 ± 0.028 | 12.212 ± 0.025 | 11.879 ± 0.023 | 11.465 ± 0.203 | 8.941 ± – | 1, 5 |
| 23520507–1100435 | M7 – | M8 β | 12.84 ± 0.018 | 12.166 ± 0.02 | 11.742 ± 0.018 | 11.44 ± 0.025 | 11.146 ± 0.022 | 10.849 ± 0.109 | 8.877 ± – | 3, 5 |
Notes.
aThese sources have new infrared spectra presented in this paper. In the majority of cases, we use the infrared spectral type and gravity classification diagnosed in this work. If an object had SpeX data, we defaulted to the resultant type and classification with that data. bThis source is referred to as PSO318 for the remainder of the text. cThe sources PSO318, 2M1119, and 2M1147 have photometry reported on the MKO system that we have converted to 2MASS using the relations in Stephens et al. (2009). In the case of PSO318, JHK was converted to MKO, whereas J and H were converted for 2M119, and only J was converted for 2M1147. dTeegardens Star. eReferences are for the spectral data and gravity analysis (if different then the original spectral data reference). fReferred to as TVLM831-154910 in Tinney et al. (1995).References. 1. Reid et al. (2008), 2. Cruz et al. (2009), 3. Cruz et al. (2007), 4. Schmidt et al. (2007), 5. Gagné et al. (2015b), 6. Allers & Liu (2013), 7. Cruz et al. (2003), 8. Faherty et al. (2012), 9. Liu et al. (2013), 10. Gizis (2002), 11. Looper et al. (2007), 12. Reid et al. (2002), 13. Faherty et al. (2009), 14. Kirkpatrick et al. (2008), 15. Kirkpatrick et al. (2010), 16. Burgasser et al. (2010a), 17. Reid et al. (2007), 18. Kirkpatrick et al. (2000), 19. Gagné et al. (2014a), 20. Teegarden et al. (2003), 21. Faherty et al. (2013), 22. Gagné et al. (2014b), 23. Scholz et al. (2005), 24. Salim & Gould (2003), 25. Burgasser et al. (2008), 26. Crifo et al. (2005), 27. This paper, 28. Kirkpatrick et al. (2006), 29. Looper et al. (2008), 30. Sahlmann et al. (2016), 31. Schneider et al. (2016), 32. Kellogg et al. (2016), 33. Kellogg et al. (2015), 34. Gizis et al. (2012), 35. Gizis et al. (2015), 36. Cruz et al. 2016.
For assigning a gravity designation, there are two classification systems based on spectral features. The Cruz et al. (2009) system uses optical spectra and assigns a low surface gravity (γ), intermediate gravity (β), or field gravity ("–" in Table 1 and throughout) based on the strength of metal oxide absorption bands and alkali lines. In certain cases a classification of δ is also used for objects that look more extreme than γ (see Gagné et al. 2015b). In this work we label objects as δ in tables but plot them and discuss them along with γ sources. On the Cruz et al. (2009) scheme, γ and β objects are thought to be younger than the Pleiades (age ≲ 120 Myr, Stauffer et al. 1998). The Allers & Liu (2013) system uses near-infrared spectra and evaluates spectral indices to assign a very low-gravity (vl-g), intermediate gravity (int-g), or field gravity (fld-g) to a given source. As discussed in Allers & Liu (2013), the optical and near-infrared gravity systems are broadly consistent. However, to anchor either requires an age-calibrated sample to ground the gravity designations as age-indicators.
Figure 1 shows a histogram distribution of the spectral subtypes in the optical and the infrared highlighting the gravity classification. There are 51 objects classified optically as γ and 80 with the equivalent infrared classification. There are 27 objects classified optically as β and 57 with the equivalent infrared classification. Of the objects which have both optical and infrared gravity designations, 16 sources (17%) have different gravity classifications from the two methods and 23 objects (24%) have a low-gravity infrared classification but are not noted as peculiar in the optical. For simplification of the text (and in large part because the two systems are generally consistent), we have adopted the convention that any object classified as vl-g or int-g in the infrared is referred to as γ or β, respectively, in the text, tables, and figures.

Figure 1. Distribution of objects analyzed in this work organized by spectral subtype and gravity classification in either the near-infrared (left) or optical (right). For ease of labels in this work, we have chosen to label VL-G and INT-G objects classified using the Allers & Liu (2013) spectral indices as γ and β, respectively. On this plot, we also show the number of γ and β at each subtype as a ratio of #γ/#β.
Download figure:
Standard image High-resolution image3. DATA
The sample of 152 M7-L8 ultra-cool dwarfs comprising our sample were placed on follow-up programs—either imaging (parallax, proper motion), spectroscopy (radial velocity), or both—to determine kinematic membership in a nearby moving group. Below, we describe the data collected for the suspected young brown dwarf sample.
3.1. Parallax and Proper-motion Imaging
The astrometric images for this program were obtained using three different instruments and telescopes in the northern and southern hemispheres. We report parallaxes for 8 low-gravity and 10 field dwarfs. For 19 objects, we report proper motion alone as we lack enough epochs to decouple parallaxes. An additional 13 objects have not yet been imaged by either the northern or southern instruments, and so we report proper motions using the time baseline between 2MASS and WISE.
3.1.1. Northern Hemisphere Targets
For Northern Hemisphere astrometry targets, we obtained I-band images with the MDM Observatory 2.4 m Hiltner telescope on Kitt Peak, Arizona. Parallaxes are being measured for both low surface gravity and field ultra-cool dwarfs, and for this work we report 5 of the former and 10 of the latter (field dwarfs used for comparison in the analysis discussed in Section 7).
For most observations at MDM, we used a thinned SITe CCD detector (named "echelle") with 2048 × 2048 pixels and an image scale of 0 275 pixel−1. This suffered a hardware failure and was unavailable for some of the runs. As a substitute, we began using "Nellie," a thick, frontside-illuminated STIS CCD which gave 0240 pixel−1. The change in instrument made no discernible difference to the astrometry. Table 2 gives the pertinent astrometric information. In addition to the parallax imaging, we took V-band images and determined V − I colors for the field stars for use in the parallax reduction and analysis. For a single target field (1552+2948) we used SDSS colors instead. The reduction and analysis were similar to those described in Thorstensen (2003) and Thorstensen et al. (2008) with some modifications.
Table 2. Details on Parallax Targets and Observations
| 2MASS Designation | SpT | SpT | Nights | Framesa | References Starsa | Δt | Telescope | Noteb | References |
|---|---|---|---|---|---|---|---|---|---|
| OpT | IR | (years) | |||||||
| (1) | (2) | (3) | (4) | (5) | (6) | (7) | (8) | (9) | (10) |
| 00452143+1634446 | L2β | L2γ | 4 | 26 | 24 | 3.0 | MDM | LG | 1, 2 |
| 01410321+1804502 | L1 | L4.5 | 4 | 23 | 26 | 3.3 | MDM | N | 3, 4 |
| 02132880+4444453 | L1.5 | – | 5 | 34 | 81 | 3.0 | MDM | N | 5 |
| 02235464–5815067 | L0γ | – | 5 | 48 | 26 | 4.9 | DuPont | LG | 1 |
| 02411151–0326587 | L0γ | L1γ | 6 | 55 | 20 | 4.9 | DuPont | LG | 2, 13 |
| 02535980+3206373 | M7β | M6 | 5 | 28 | 53 | 3.9 | MDM | LG | 14 |
| 03140344+1603056 | L0 | – | 5 | 31 | 37 | 3.0 | MDM | N | 6 |
| 05002100+0330501 | L4 | – | 5 | 30 | 61 | 2.8 | MDM | N | 6 |
| 06023045+3910592 | L1 | L1β | 7 | 77 | 71 | 9.9 | MDM | LG | 2, 15 |
| 06154934–0100415 | L2 | – | 5 | 34 | 62 | 2.2 | MDM | N | 7 |
| 06523073+4710348 | L4.5 | – | 5 | 27 | 49 | 3.0 | MDM | N | 5 |
| 09111297+7401081 | L0 | – | 4 | 24 | 35 | 2.9 | MDM | N | 6 |
| 10224821+5825453 | L1β | L1β | 6 | 30 | 15 | 4.9 | MDM | LG | 2, 13 |
| 10484281+0111580 | L1 | L4 | 3 | 17 | 14 | 3.0 | MDM | N | 8, 9 |
| 13004255+1912354 | L1 | L3 | 5 | 47 | 10 | 2.4 | MDM | N | 10, 11 |
| 14162408+1348263 | L6 | L6 | 5 | 29 | 11 | 3.3 | MDM | N | 12 |
| 15525906+2948485 | L0β | L0β | 6 | 27 | 33 | 5.3 | MDM | LG | 1, 2 |
| 21265040–8140293 | L3γ | L3γ | 6 | 90 | 38 | 5.4 | DuPont | LG | 1 |
Notes.
aThe number of reference stars and individual image frames used in the parallax solution. bLG is a low surface gravity object and N is a field object.References. 1. Cruz et al. (2009), 2. Allers & Liu (2013), 3. Wilson et al. (2003), 4. Cruz et al. (2007), 5. Cruz et al. (2003), 6. Reid et al. (2008), 7. Phan-Bao et al. (2008), 8. Hawley et al. (2002), 9. Kendall et al. (2004), 10. Gizis et al. (2000), 11. Burgasser et al. (2008), 12. Bowler et al. (2010a), 13. Kirkpatrick et al. (2008), 14. This paper, 15. Salim & Gould (2003).
Download table as: ASCIITypeset image
Parallax observations through a broadband filter are subject to differential color refraction (DCR). The effective wavelength of the light reaching the detector for each star will depend on its spectral energy distribution. Consequently, the target and reference stars can be observed to have different positions depending on how far from the zenith the target is observed at each epoch. In previous studies we approximated the I-band DCR correction as a simple linear trend with V − I color, amounting to 5 mas per unit V − I per unit tan z (where z is the zenith distance of each observation). We checked this by explicitly computing the correction for stars of varying color using library spectra from Pickles (1998), a tabulation of the I passband from Bessell (1990), and the atmospheric refraction as a function of wavelength appropriate to the observatory's elevation. The synthesized corrections agreed very well with the empirically derived linear correction. However, the library spectra did not extend to objects as red as the present sample and most are so faint in V that we could not measure V − I accurately. We therefore computed DCR corrections using the spectral classifications of our targets and spectra of L and T dwarfs assembled by Neill Reid.15 The resulting corrections typically amounted to ∼25 mas per unit tan z, that is, the DCR expected on the basis of the linear relation for a star with  .
.
To minimize DCR effects, we restricted the parallax observations to hour angles within ±2 hr of the meridian. The effect of DCR on parallax is mainly along the east-west (or X) direction, and the X-component of refraction is proportional to  , where p is the parallactic angle. This quantity averaged 0.12 for our observations, reflecting a slight westward bias in hour angle, and its standard deviation was 0.15. We are therefore confident that the DCR correction is not unduly affecting our results.
As in previous papers, we used our parallax observations to estimate distances using a Bayesian formalism that takes into account proper motion, parallax, and a plausible range of absolute magnitude (Thorstensen 2003). For these targets we assumed a large spread in absolute magnitude, so that it had essentially no effect on the distance, and used a velocity distribution characteristic of a disk population to formulate the proper-motion prior. For most of the targets, the parallax π was precise enough that the Lutz–Kelker correction and other Bayesian priors had little effect on the estimated distance, which was therefore close to 1/π.
Table 3 lists our measured parallaxes and proper motions and Table 4 shows the comparison with literature values for four sources with previously reported values. In the case of MDM measured proper motions, they are relative to the reference stars, and not absolute. Although the formal errors of the proper motions are typically 1–2 mas yr−1, this precision is spurious in that the dispersion of the reference star proper motions is usually over 10 mas yr−1, and so the relative zero point is correspondingly uncertain.
Table 3. Results of Parallax Program
| Name | SpT | SpT | μαa | μδa | πabs |
|---|---|---|---|---|---|
| OpT | IR | '' yr−1 | '' yr−1 | mas | |
| (1) | (2) | (3) | (4) | (5) | (6) |
| 00452143+1634446 | L2β | L2γ | 0.355 ± 0.01 | −0.04 ± 0.01 | 62.5 ± 3.7 |
| 01410321+1804502 | L1 | L4.5 | 0.41 ± 0.01 | −0.047 ± 0.01 | 41.0 ± 2.8 |
| 02132880+4444453 | L1.5 | – | −0.054 ± 0.01 | −0.147 ± 0.01 | 50.0 ± 2.1 |
| 02235464–5815067 | L0γ | – | 0.0986 ± 0.0008 | −0.0182 ± 0.0009 | 27.4 ± 2.6 |
| 02411151–0326587 | L0γ | L1γ | 0.0737 ± 0.001 | −0.0242 ± 0.0019 | 26.7 ± 3.3 |
| 02535980+3206373 | M7β | M6 | 0.087 ± 0.01 | −0.096 ± 0.01 | 17.7 ± 2.5 |
| 03140344+1603056 | L0 | – | −0.247 ± 0.01 | −0.05 ± 0.01 | 69.0 ± 2.4 |
| 05002100+0330501 | L4 | – | 0.008 ± 0.01 | −0.353 ± 0.01 | 75.2 ± 3.7 |
| 06023045+3910592 | L1 | L2β | 0.157 ± 0.01 | −0.504 ± 0.01 | 88.5 ± 1.6 |
| 06154934–0100415 | L2 | – | 0.197 ± 0.01 | −0.055 ± 0.01 | 49.8 ± 2.8 |
| 06523073+4710348 | L4.5 | – | −0.118 ± 0.01 | 0.136 ± 0.01 | 114.9 ± 4.0 |
| 09111297+7401081 | L0 | – | −0.2 ± 0.01 | −0.145 ± 0.01 | 45.2 ± 3.1 |
| 10224821+5825453 | L1β | L1β | −0.807 ± 0.01 | −0.73 ± 0.01 | 54.3 ± 2.5 |
| 10484281+0111580 | L1 | L4 | −0.436 ± 0.01 | −0.218 ± 0.01 | 71.9 ± 7.4 |
| 13004255+1912354 | L1 | L3 | −0.793 ± 0.01 | −1.231 ± 0.01 | 70.4 ± 2.5 |
| 14162408+1348263 | L6 | L6 | 0.088 ± 0.01 | 0.136 ± 0.01 | 107.5 ± 3.5 |
| 15525906+2948485 | L0β | L0β | −0.162 ± 0.01 | −0.06 ± 0.01 | 48.8 ± 2.7 |
| 21265040–8140293 | L3γ | L3γ | 0.0556 ± 0.0014 | −0.1018 ± 0.003 | 31.3 ± 2.6 |
Note.
aThe proper motions from MDM are not corrected to absolute and have zero-point uncertainties of ∼10 mas yr−1; see Weinberger et al. (2013) for a discussion of the du Pont proper motions.Download table as: ASCIITypeset image
Table 4. Literature Parallax Comparisons
| 2MASS Designation | SpT | SpT | μα | μδ | π | References |
|---|---|---|---|---|---|---|
| '' yr−1 | '' yr−1 | mas | ||||
| (1) | (2) | (3) | (4) | (5) | (6) | (7) |
| 00452143+1634446 | L2β | L2γ | 0.355 ± 0.01 | −0.04 ± 0.01 | 62.5 ± 3.7 | 1 |
| 0.3562 ± 0.00137 | −0.035 ± 0.0109 | 57.3 ± 2.0 | 2 | |||
| 02411151–0326587 | L0γ | L1γ | 0.0737 ± 0.001 | −0.0242 ± 0.0019 | 26.7 ± 3.3 | 1 |
| 0.084 ± 0.0117 | −0.0224 ± 0.0086 | 21.4 ± 2.6 | 2 | |||
| 10224821+5825453 | L1β | L1β | −0.807 ± 0.01 | −0.73 ± 0.01 | 54.3 ± 2.5 | 1 |
| −0.799 ± 0.0064 | −0.7438 ± 0.0132 | 46.3 ± 1.3 | 2 | |||
| 14162408+1348263 | L6 | L6 | 0.088 ± 0.01 | 0.136 ± 0.01 | 107.5 ± 3.5 | 1 |
| 0.0951 ± 0.003 | 0.1303 ± 0.003 | 109.9 ± 1.8 | 2 | |||
| 15525906+2948485 | L0β | L0β | −0.162 ± 0.01 | −0.06 ± 0.01 | 48.8 ± 2.7 | 1 |
| −0.1541 ± 0.0053 | −0.0622 ± 0.0106 | 47.7 ± 0.9 | 3 | |||
References. 1. This work, 2. Zapatero Osorio et al. (2014), 3. Dupuy & Liu (2012).
Download table as: ASCIITypeset image
3.1.2. Southern Hemisphere Targets
We observed 16 of the most southern targets with the Carnegie Astrometric Planet Search Camera (CAPSCam) on the 100 inch du Pont telescope and 5 with the FourStar imaging camera (Persson et al. 2013) on the Magellan Baade Telescope. For both programs, we are continually imaging objects for the purpose of measuring parallaxes. However, for this work, we report parallaxes (and proper motions) for only three objects with CAPScam. The remaining 18 objects (13—CAPScam, 5—FourStar) need more epochs to decouple parallax from proper motion and will be the subject of a future paper.
A description of the CAPSCam instrument and the basic data reduction techniques are described in Boss et al. (2009) and Anglada-Escudé et al. (2012). CAPSCam utilizes a Hawaii-2RG HyViSI detector filtered to a bandpass of 100 nm centered at 865 nm with 2048 × 2048 pixels, each subtending 0196 on a side. CAPSCam was built to simultaneously image bright target stars in a 64 × 64 pixel guide window allowing short exposures while obtaining longer exposures of fainter reference stars in the full frame window (e.g., Weinberger et al. 2013). The brown dwarfs targeted in this program were generally fainter than the astrometric reference stars so we worked with only the full frame window. Data were processed as described in Weinberger et al. (2013). For exposure times, we used 30–120 s for our bright targets and 150–300 s for our faint targets with no coadds in an 8–12 point dither pattern contained in a 15'' box. Pertinent astrometric information for parallax targets is given in Table 2.
FourStar is a near-infrared mosaic imager (Persson et al. 2013) with four 2048 × 2048 Teledyne HAWAII-2RG arrays that produce a 10 9 × 10⁹ field of view at a plate scale of 0159 pixel−1. Each target was observed with the J3 (1.22–1.36 μm) narrow-band filter and centered in chip 2. This procedure has proven successful in our astrometric program for late-T and Y dwarfs (e.g., Tinney et al. 2012, 2014; Faherty et al. 2014b). Exposure times of 15 s with 2 coadds in an 11 point dither pattern contained in a 15'' box were used for each target. The images were processed as described in Tinney et al. (2014).
In the case of the 18 proper-motion-only targets from either CAPSCam or FourStar, we combine our latest image with that of 2MASS (Δt listed in Table 5). Proper motions were calculated using the astrometric strategy described in Faherty et al. (2009). Results are listed in Table 5.
Table 5. New Proper-motion Measurements
| 2MASS | SpT | SpT | μR.A. | μdecl. | References | Δt |
|---|---|---|---|---|---|---|
| OpT | NIR | '' yr−1 | '' yr−1 | yr | ||
| (1) | (2) | (3) | (4) | (5) | (6) | (7) |
| 00040288–6410358 | L1γ | L1γ | 0.064 ± 0.012 | −0.047 ± 0.012 | WISE-2MASS | 10.02 |
| 00374306–5846229 | L0γ | – | 0.057 ± 0.01 | 0.017 ± 0.005 | FourStar | 14.15 |
| 01174748–3403258 | L1β | L1β | 0.084 ± 0.015 | −0.045 ± 0.008 | FourStar | 15.08 |
| 01262109+1428057 | L4γ | L2γ | 0.07 ± 0.012 | −0.008 ± 0.012 | WISE-2MASS | 9.68 |
| 01415823–4633574 | L0γ | L0γ | 0.105 ± 0.01 | −0.049 ± 0.01 | FourStar | 14.29 |
| 02103857–3015313 | L0γ | L0γ | 0.145 ± 0.036 | −0.04 ± 0.007 | FourStar | 14.39 |
| 02340093–6442068 | L0γ | L0βγ | 0.088 ± 0.012 | −0.015 ± 0.012 | WISE-2MASS | 10.53 |
| 03032042–7312300 | L2γ | – | 0.043 ± 0.012 | 0.003 ± 0.012 | WISE-2MASS | 10.48 |
| 03231002–4631237 | L0γ | L0γ | 0.066 ± 0.008 | 0.001 ± 0.016 | FourStar | 14.30 |
| 04062677–3812102 | L0γ | L1γ | 0.009 ± 0.012 | 0.029 ± 0.012 | WISE-2MASS | 9.79 |
| 05120636–2949540 | L5γ | L5β | −0.01 ± 0.013 | 0.08 ± 0.015 | CAPSCam | 15.14 |
| 05341594–0631397 | M8γ | M8γ | 0.002 ± 0.012 | −0.007 ± 0.012 | WISE-2MASS | 9.52 |
| 09532126–1014205 | M9γ | M9β | −0.07 ± 0.007 | −0.06 ± 0.009 | CAPSCam | 15.06 |
| 09593276+4523309 | – | L3γ | −0.087 ± 0.009 | −0.126 ± 0.012 | WISE-2MASS | 11.33 |
| TWA 28 | M8.5γ | M9γ | −0.06 ± 0.008 | −0.014 ± 0.009 | CAPSCam | 14.90 |
| 11544223–3400390 | L0β | L1β | −0.161 ± 0.008 | 0.012 ± 0.007 | CAPSCam | 14.89 |
| 14112131–2119503 | M9β | M8β | −0.078 ± 0.009 | −0.073 ± 0.011 | CAPSCam | 15.77 |
| 14482563+1031590 | L4 | L4pec | 0.223 ± 0.017 | −0.118 ± 0.013 | CAPSCam | 13.82 |
| 15382417–1953116 | L4γ | L4γ | 0.026 ± 0.007 | −0.045 ± 0.007 | CAPSCam | 15.69 |
| 15474719–2423493 | M9γ | L0β | −0.135 ± 0.009 | −0.127 ± 0.008 | CAPSCam | 14.79 |
| 15575011–2952431 | M9δ | L1γ | −0.01 ± 0.012 | −0.028 ± 0.012 | WISE-2MASS | 11.04 |
| 16154255+4953211 | L4γ | L3-L6γ | −0.08 ± 0.012 | 0.018 ± 0.012 | WISE-2MASS | 12.11 |
| 17111353+2326333 | L0γ | L1β | −0.063 ± 0.015 | −0.035 ± 0.012 | CAPSCam | 16.85 |
| 18212815+1414010 | L4.5 | L4pec | 0.226 ± 0.008 | −0.24 ± 0.007 | CAPSCam | 15.07 |
| 19355595–2846343 | M9γ | M9γ | 0.034 ± 0.012 | −0.058 ± 0.012 | CAPSCam | 14.79 |
| 19564700–7542270 | L0γ | L2γ | 0.009 ± 0.012 | −0.059 ± 0.012 | WISE-2MASS | 9.72 |
| 20004841–7523070 | M9γ | M9γ | 0.069 ± 0.012 | −0.11 ± 0.004 | CAPSCam | 13.79 |
| 20025073–0521524 | L5β | L5-L7γ | −0.098 ± 0.005 | −0.11 ± 0.008 | CAPSCam | 15.54 |
| 20135152–2806020 | M9γ | L0γ | 0.043 ± 0.012 | −0.068 ± 0.012 | WISE-2MASS | 11.03 |
| 21543454–1055308 | L4β | L5γ | 0.175 ± 0.012 | 0.009 ± 0.012 | WISE-2MASS | 11.77 |
| 22064498–4217208 | L4γ | L4γ | 0.128 ± 0.013 | −0.181 ± 0.008 | CAPSCam | 15.52 |
| 23153135+0617146 | L0γ | L0γ | 0.056 ± 0.012 | −0.039 ± 0.012 | WISE-2MASS | 9.96 |
| 23225299–6151275 | L2γ | L3γ | 0.062 ± 0.01 | −0.085 ± 0.009 | FourStar | 14.07 |
Download table as: ASCIITypeset image
For three CAPSCam targets there is sufficient data to solve for both proper motions and parallaxes. For these sources, the astrometric pipeline described in Weinberger et al. (2013) was employed. Table 3 lists our measured parallaxes and proper motions and Table 4 shows the comparison with literature values for 0241-0326.
3.2. Low- and Medium-resolution Spectroscopy
3.2.1. Folded-port InfraRed Echellette (FIRE)
We used the 6.5 m Baade Magellan telescope and the FIRE (Simcoe et al. 2013) spectrograph to obtain near-infrared spectra of 36 sources. Observations were made over seven runs between 2013 July and 2014 September. For all of the observations, we used the echellette mode and the 06 slit (resolution λ/Δλ ∼ 6000) covering the full 0.8–2.5 μm band with a spatial resolution of 018/pixel. Exposure times for each source and the number of images acquired are listed in Table 6. Immediately after each science image, we obtained an A star for telluric correction and obtained a ThAr lamp spectra. At the start of the night, we obtained dome flats and Xe flash lamps to construct a pixel-to-pixel response calibration. Data were reduced using the FIREHOSE package, which is based on the MASE and SpeX reduction tools (Vacca et al. 2003; Cushing et al. 2004; Bochanski et al. 2009).
Table 6. Near-infrared Spectral Data
| 2MASS | Date-Observed | Instrument | Mode | Slit | Int time | Images |
|---|---|---|---|---|---|---|
| (1) | (2) | (3) | (4) | (5) | (6) | (7) |
| 00040288–6410358 | 11 Sep 2014 | FIRE | Echelle | 0.6 | 900 | 2 |
| 00274197+0503417 | 08 Aug 2014 | FIRE | Echelle | 0.6 | 900 | 2 |
| 00452143+1634446 | 08 Aug 2014 | FIRE | Echelle | 0.6 | 900 | 2 |
| 00550564+0134365 | 04 Sep 2003 | SpeX | Prism | 0.8 | 180 | 2 |
| 01174748–3403258 | 12 Sep 2014 | FIRE | Echelle | 0.6 | 900 | 2 |
| 01174748–3403258(2) | 11 Sep 2014 | FIRE | Echelle | 0.6 | 600 | 2 |
| 01244599–5745379 | 11 Sep 2014 | FIRE | Echelle | 0.6 | 900 | 2 |
| 02103857–3015313 | 11 Sep 2014 | FIRE | Echelle | 0.6 | 750 | 2 |
| 02103857–3015313(2) | 29 Dec 2009 | TripleSpec | – | 11 × 43'' |
300 | 6 |
| 02251947–5837295 | 28 Jul 2013 | FIRE | Echelle | 0.6 | 600 | 2 |
| 02340093–6442068 | 28 Jul 2013 | FIRE | Echelle | 0.6 | 750 | 2 |
| 03231002–4631237 | 13 Nov 2007 | SpeX | Prism | 0.5 | 180 | 5 |
| 03264225–2102057 | 13 Nov 2007 | SpeX | Prism | 0.5 | 180 | 6 |
| 04210718–6306022 | 11 Sep 2014 | FIRE | Echelle | 0.6 | 900 | 2 |
| 04351455–1414468 | 13 Nov 2007 | SpeX | SXD | 0.5 | 200 | 4 |
| 05012406–0010452 | 12 Oct 2007 | SpeX | Prism | 0.5 | 90 | 6 |
| 05120636–2949540 | 15 Nov 2013 | FIRE | Echelle | 0.6 | 500 | 2 |
| 05120636–2949540(2) | 08 Dec 2011 | SpeX | Prism | 0.5 | 180 | 8 |
| 05361998–1920396 | 13 Dec 2013 | FIRE | Echelle | 0.6 | 650 | 2 |
| 07123786–6155528 | 15 Nov 2013 | FIRE | Echelle | 0.6 | 650 | 2 |
| 09532126–1014205 | 02 Mar 2009 | TripleSpec | – | 11 × 43'' |
300 | 6 |
| 09593276+4523309 | 30 Dec 2009 | SpeX | Prism | 0.5 | 180 | 3 |
| 11020983–3430355 | 12 May 2014 | FIRE | Echelle | 0.6 | 600 | 2 |
| 11544223–3400390 | 12 May 2014 | FIRE | Echelle | 0.6 | 750 | 2 |
| 12563961–2718455 | 12 May 2014 | FIRE | Echelle | 0.6 | 900 | 2 |
| 14112131–2119503 | 12 May 2014 | FIRE | Echelle | 0.6 | 500 | 2 |
| 14482563+1031590 | 13 May 2014 | FIRE | Echelle | 0.6 | 900 | 2 |
| 15382417–1953116 | 28 Jul 2013 | FIRE | Echelle | 0.6 | 900 | 2 |
| 15382417–1953116(2) | 04 Sep 2003 | SpeX | Prism | 0.8 | 180 | 6 |
| 15515237+0941148 | 15 Aug 2013 | FIRE | Echelle | 0.6 | 900 | 2 |
| 15575011–2952431 | 28 Jul 2013 | FIRE | Echelle | 0.6 | 900 | 2 |
| 17111353+2326333 | 12 May 2014 | FIRE | Echelle | 0.6 | 800 | 2 |
| 17260007+1538190 | 12 May 2014 | FIRE | Echelle | 0.6 | 800 | 2 |
| 17410280–4642218 | 11 Sep 2014 | FIRE | Echelle | 0.6 | 1500 | 2 |
| 18212815+1414010 | 12 May 2014 | FIRE | Echelle | 0.6 | 650 | 2 |
| 19355595–2846343 | 08 Aug 2014 | FIRE | Echelle | 0.6 | 600 | 2 |
| 19564700–7542270 | 28 Jul 2013 | FIRE | Echelle | 0.6 | 900 | 4 |
| 20004841–7523070 | 28 Jul 2013 | FIRE | Echelle | 0.6 | 300 | 3 |
| 20025073–0521524 | 28 Jul 2013 | FIRE | Echelle | 0.6 | 600 | 2 |
| 20135152–2806020 | 12 May 2014 | FIRE | Echelle | 0.6 | 600 | 2 |
| 20135152–2806020(2) | 08 Aug 2014 | FIRE | Echelle | 0.6 | 600 | 2 |
| PSO318 | 13 Dec 2013 | FIRE | Echelle | 0.6 | 900 | 4 |
| 21265040–8140293 | 15 Aug 2013 | FIRE | Echelle | 0.6 | 900 | 2 |
| 21265040–8140293(2) | 12 May 2014 | FIRE | Echelle | 0.6 | 800 | 2 |
| 21543454–1055308 | 08 Aug 2014 | FIRE | Echelle | 0.6 | 1200 | 2 |
| 22064498–4217208 | 12 May 2014 | FIRE | Echelle | 0.6 | 700 | 2 |
| 22064498–4217208(2) | 08 Aug 2014 | FIRE | Echelle | 0.6 | 750 | 2 |
| 22064498–4217208(3) | 21 Aug 2006 | SpeX | Prism | 0.5 | 180 | 5 |
| 22443167+2043433 | 11 Sep 2014 | FIRE | Echelle | 0.6 | 900 | 2 |
| 22495345+0044046 | 08 Aug 2014 | FIRE | Echelle | 0.6 | 1200 | 2 |
| 23153135+0617146 | 08 Aug 2014 | FIRE | Echelle | 0.6 | 750 | 2 |
| 23153135+0617146(2) | 14 Nov 2007 | SpeX | Prism | 0.5 | 180 | 6 |
Download table as: ASCIITypeset image
3.2.2. Infrared Telescope Facility (IRTF)
We used the 3 m NASA IRTF to obtain low-resolution near-infrared spectroscopy for 10 targets. We used either the 05 slit or the 08 slit depending on conditions. All of the observations were aligned to the parallactic angle to obtain R ≡ λ/Δλ ≈120 spectral data over the wavelength range of 0.7–2.5 μm. Exposure times for each source and the number of images acquired are listed in Table 6. Immediately after each science observation, we observed an A0 star at a similar airmass for telluric corrections and flux calibration, as well as an exposure of an internal flat-field and Ar arc lamp. All of the data were reduced using the SpeXtool package version 3.4 using standard settings (Vacca et al. 2003; Cushing et al. 2004).
3.2.3. TSpec
We used the Triple Spectrograph (TSpec) at the 5 m Hale Telescope at Palomar Observatory to obtain near-infrared spectra of two targets. TSpec uses a 1024 × 2048 HAWAII-2 array to cover simultaneously the range from 1.0 to 2.45 μm (Herter et al. 2008). With a 1.1 × 43'' slit, it achieves a resolution of ∼2500. Observations were acquired in an ABBA nod sequence with an exposure time per nod position of 300 s (see Table 6) so as to mitigate problems with changing OH background levels. Observations of A0 stars were taken near in time and in airmass to the target objects and were used for telluric correction and flux calibration. Dome flats were taken to calibrate the pixel-to-pixel response. Data were reduced using a modified version of Spextool (see Kirkpatrick et al. 2011).
3.3. High-resolution Spectroscopy
3.3.1. Keck II NIRSPEC
The Keck II near-infrared SPECtrograph (NIRSPEC) is a Nasmyth focus spectrograph designed to obtain spectra at wavelengths from 0.95 to 5.5 μm (McLean et al. 1998). It offers a choice of low-resolution and cross-dispersed, high-resolution spectrographic modes, with optional adaptive optics guidance. In high-resolution mode, it can achieve resolving powers of up to R = 25000 using a 3 pixel entrance slit, with two orders visible on the output spectrum (selectable by filter).
Multiple observations of 17 sources were taken in high-resolution mode on Keck II on 2008 September 14–16, using the NIRSPEC-5 filter to obtain H-band spectra in Order 49 (1.545–1.570 μm ). Observational data for each source are listed in Table 7. The data were reduced using the IDL-based spectroscopy reduction package REDSPEC. Many of our observations had very low signal to noise, and so multiple exposures were co-added before extracting spectra. We tested this procedure by using objects with sufficient signa to noise prior to co-adding, and by comparing individual against co-added spectra. The resulting individual exposure spectra were almost identical to those obtained by co-adding prior to running REDSPEC reductions. Heliocentric radial velocity corrections were calculated with the IRAF task rvcorrect, and applied using custom python code.
Table 7. Radial Velocities
| Name | Telescope | Resolving Power | Date-obs | Standards Used | RV | RV final |
|---|---|---|---|---|---|---|
| (1) | (2) | (3) | (4) | (5) | (6) | (7) |
| 00325584–4405058 | Magellan Clay MIKE | 25000 | 01 Nov 2006 | 4, 5 | 12.95 ± 1.92 | 12.95 ± 1.92 |
| 00332386–1521309 | Gemini South Phoenix | 50000 | 28 Oct 2009 | 6, 7 | −6.37 ± 0.40 | −6.37 ± 0.40 |
| 00374306–5846229 | Gemini South Phoenix | 50000 | 20 Nov 2007 | 6, 7 | 6.63 ± 0.08 | 6.62 ± 0.07 |
| 00374306–5846229 | Gemini South Phoenix | 50000 | 23 Dec 2007 | 6, 7 | 6.01 ± 0.74 | |
| 00452143+1634446 | Keck II NIRSPEC | 20000 | 15 Sep 2008 | 1, 3 | 3.16 ± 0.83 | 3.16 ± 0.83 |
| 00464841+0715177 | Keck II NIRSPEC | 20000 | 14 Sep 2008 | 1, 2, 3 | −2.75 ± 0.27 | −2.75 ± 0.27 |
| 00550564+0134365 | Keck II NIRSPEC | 20000 | 14 Sep 2008 | 1, 2, 3 | −1.21 ± 0.38 | −1.21 ± 0.38 |
| 01415823–4633574 | Magellan Clay MIKE | 25000 | 02 Nov 2006 | 4, 5 | 6.41 ± 1.56 | 6.41 ± 1.56 |
| 02103857–3015313 | Gemini South Phoenix | 50000 | 22 Dec 2007 | 6, 7 | 7.63 ± 0.35 | 7.82 ± 0.27 |
| 02103857–3015313 | Gemini South Phoenix | 50000 | 24 Dec 2007 | 6, 7 | 7.05 ± 0.45 | |
| 02103857–3015313 | Gemini South Phoenix | 50000 | 26 Dec 2007 | 6, 7 | 7.96 ± 0.16 | |
| 02215494–5412054 | Gemini South Phoenix | 50000 | 27 Oct 2009 | 6, 7 | 10.18 ± 0.10 | 10.18 ± 0.10 |
| 02235464–5815067 | Gemini South Phoenix | 50000 | 05 Dec 2007 | 6, 7 | 9.55 ± 0.62 | 10.36 ± 0.23 |
| 02235464–5815067 | Gemini South Phoenix | 50000 | 25 Dec 2007 | 6, 7 | 10.42 ± 0.18 | |
| 02340093–6442068 | Gemini South Phoenix | 50000 | 27 Oct 2009 | 6, 7 | 12.56 ± 0.14 | 11.76 ± 0.72 |
| 02340093–6442068 | Gemini South Phoenix | 50000 | 29 Oct 2009 | 6, 7 | 11.11 ± 0.13 | |
| 02411151–0326587a | Keck II NIRSPEC | 20000 | 13 Sep 2008 | 1, 2, 3 | 6.34 ± 7.98 | 6.34 ± 7.98 |
| 03231002–4631237 | Gemini South Phoenix | 50000 | 21 Dec 2007 | 6, 7 | 13.02 ± 0.13 | 13.00 ± 0.05 |
| 03231002–4631237 | Gemini South Phoenix | 50000 | 23 Dec 2007 | 6, 7 | 12.90 ± 0.29 | |
| 03393521–3525440 | Magellan Clay MIKE | 25000 | 04 Jul 2006 | 4, 5 | 7.43 ± 0.72 | 7.43 ± 0.72 |
| 03572695–4417305 | Magellan Clay MIKE | 25000 | 01 Nov 2006 | 4, 5 | 10.73 ± 4.60 | 10.73 ± 4.60 |
| 04210718–6306022 | Gemini South Phoenix | 50000 | 14 Dec 2007 | 6, 7 | 15.81 ± 0.53 | 14.70 ± 0.33 |
| 04210718–6306022 | Gemini South Phoenix | 50000 | 15 Dec 2007 | 6, 7 | 14.60 ± 0.16 | |
| 04351455–1414468 | Magellan Clay MIKE | 25000 | 01 Nov 2006 | 4, 5 | 16.16 ± 1.76 | 16.16 ± 1.76 |
| 04362788–4114465 | Magellan Clay MIKE | 25000 | 02 Nov 2006 | 4, 5 | 14.97 ± 1.45 | 14.97 ± 1.45 |
| 04433761+0002051 | Magellan Clay MIKE | 25000 | 01 Nov 2006 | 4, 5 | 16.97 ± 0.76 | 16.97 ± 0.76 |
| 05012406–0010452 | Magellan Clay MIKE | 25000 | 02 Nov 2006 | 4, 5 | 21.29 ± 0.85 | 21.77 ± 0.66 |
| 05012406–0010452 | Gemini South Phoenix | 50000 | 28 Oct 2009 | 6, 7 | 22.68 ± 1.16 | |
| 05184616–2756457 | Keck II NIRSPEC | 20000 | 13 Sep 2008 | 1, 2 | 24.52 ± 0.41 | 24.35 ± 0.19 |
| 05184616–2756457 | Keck II NIRSPEC | 20000 | 15 Sep 2008 | 1, 2 | 24.15 ± 0.45 | |
| 06085283–2753583 | Magellan Clay MIKE | 25000 | 02 Nov 2006 | 4, 5 | 28.08 ± 1.93 | 26.35 ± 0.07 |
| 06085283–2753583 | Gemini South Phoenix | 50000 | 28 Oct 2009 | 6, 7 | 26.35 ± 0.08 | |
| 15474719–2423493 | Magellan Clay MIKE | 25000 | 04 Jul 2006 | 4, 5 | −6.52 ± 0.35 | −6.52 ± 0.35 |
| 15525906+2948485 | Magellan Clay MIKE | 25000 | 04 Jul 2006 | 4, 5 | −19.90 ± 1.38 | −19.90 ± 1.38 |
| 16154255+4953211a | Keck II NIRSPEC | 20000 | 13 Sep 2008 | 1, 2, 3 | −25.59 ± 3.18 | −25.59 ± 3.18 |
| 17111353+2326333 | Keck II NIRSPEC | 20000 | 14 Sep 2008 | 1, 2, 3 | −20.69 ± 0.75 | −20.69 ± 0.75 |
| 17260007+1538190 | Keck II NIRSPEC | 20000 | 15 Sep 2008 | 1, 2, 3 | −20.54 ± 0.84 | −20.54 ± 0.84 |
| 18212815+1414010 | Keck II NIRSPEC | 20000 | 15 Sep 2008 | 2, 3 | 9.08 ± 0.17 | 9.08 ± 0.17 |
| 19350976–6200473b | Magellan Clay MIKE | 25000 | 04 Jul 2006 | |||
| 20004841–7523070 | Magellan Clay MIKE | 25000 | 04 Jul 2006 | 4, 5 | 4.40 ± 2.84 | 4.40 ± 2.84 |
| 20135152–2806020 | Magellan Clay MIKE | 25000 | 04 Jul 2006 | 4, 5 | −6.53 ± 0.24 | −6.53 ± 0.24 |
| 21265040–8140293 | Gemini South Phoenix | 50000 | 29 Oct 2009 | 6, 7 | 10.03 ± 0.49 | 10.03 ± 0.49 |
| 22081363+2921215 | Keck II NIRSPEC | 20000 | 13 Sep 2008 | 1, 2, 3 | −15.59 ± 1.93 | −15.59 ± 1.93 |
| 22134491–2136079 | Magellan Clay MIKE | 25000 | 04 Jul 2006 | 4, 5 | −4.92 ± 4.18 | −4.92 ± 4.18 |
| 22495345+0044046 | Keck II NIRSPEC | 20000 | 13 Sep 2008 | 1, 2, 3 | −3.26 ± 0.90 | −3.26 ± 0.90 |
| 23153135+0617146 | Keck II NIRSPEC | 20000 | 15 Sep 2008 | 1, 2, 3 | −14.69 ± 0.52 | −14.69 ± 0.52 |
| 23224684–3133231 | Gemini South Phoenix | 50000 | 27 Oct 2009 | 6, 7 | 33.86 ± 1.11 | 33.86 ± 1.11 |
| 23225299–6151275 | Gemini South Phoenix | 50000 | 28 Oct 2009 | 6, 7 | 7.20 ± 0.46 | 6.75 ± 0.75 |
| 23225299–6151275 | Gemini South Phoenix | 50000 | 29 Oct 2009 | 6, 7 | 5.52 ± 0.76 | |
| 00242463–0158201c | Gemini South Phoenix | 50000 | 24 Dec 2007 | 6, 7 | 11.65 ± 1.60 | 11.65 ± 1.60 |
| 1224522–123835c | Magellan Clay MIKE | 25000 | 04 Jul 2006 | 4 | −2.87 ± 0.59 | −2.87 ± 0.59 |
| 01062285-5933185c | Gemini South Phoenix | 50000 | 27 Jul 2007 | 6, 7 | 1.18 ± 0.44 | 1.18 ± 0.44 |
| 05233822–1403022c | Gemini South Phoenix | 50000 | 27 Oct 2009 | 6 | 12.48 ± 0.41 | 12.48 ± 0.41 |
| 05361998–1920396c | Keck II NIRSPEC | 20000 | 14 Sep 2008 | 1, 2 | 22.07 ± 0.70 | 22.07 ± 0.70 |
| 14284323+3310391c | Magellan Clay MIKE | 25000 | 04 Jul 2006 | 5 | −39.14 ± 0.38 | −39.14 ± 0.38 |
| 18284076+1229207a c | Keck II NIRSPEC | 20000 | 14 Sep 2008 | 1 | 51.95 ± 15.04 | 51.95 ± 15.04 |
| 21041491-1037369c | Gemini South Phoenix | 50000 | 28 Oct 2009 | 6, 7 | −30.90 ± 1.58 | −30.90 ± 1.58 |
| 21481633+4003594c | Keck II NIRSPEC | 20000 | 15 Sep 2008 | 1, 2, 3 | −14.52 ± 0.71 | −14.52 ± 0.71 |
| 22244381–0158521c | Keck II NIRSPEC | 20000 | 15 Sep 2008 | 1, 2 | −36.48 ± 0.01 | −36.48 ± 0.01 |
| 22344161+4041387c | Keck II NIRSPEC | 20000 | 15 Sep 2008 | 1, 2, 3 | −12.49 ± 0.42 | −12.49 ± 0.42 |
| 23515044–2537367a c d | Gemini South Phoenix | 50000 | 28 Oct 2009 | 6, 7 | −5.68 ± 1.82 | −5.68 ± 1.82 |
Notes. Data from 2MASS Cutri et al. (2003) and ALLWISE Cutri et al. (2013). Standard stars are as follows: 1. 2MASS J18212815+1414010 (+9.78 Blake et al. 2010), 2. 2MASS J00452143+1634446 (+3.29 Blake et al. 2010), 3. 2MASS J22244381–0158521 (−37.55 Blake et al. 2010), 4. LHS 2924 (−37.4 Mohanty et al. 2003), 5. BRI 1222–1221 (−4.8 Mohanty et al. 2003), 6. 2MASS J11553952–3727350 (+45.0 Seifahrt et al. 2010), 7. 2MASS J05233822–1403022 (+11.82 Blake et al. 2007)
aLow-quality Spectrum. bNo useable spectrum. cNo spectroscopic signs of youth. dThis object is listed in Filippazzo et al. (2015) with a distance and reference to J. Faherty 2016, in preparation. The value in that paper was spectrophotometric and should not be regarded as a parallax.Table 8. Comparison of New and Previously Published RVs.
| Name | Telescope | RVours | RVothers | RV | RVothers | RV | RVothers | RV | RVothers | RV |
|---|---|---|---|---|---|---|---|---|---|---|
| km s−1 | km s−1 | References | km s−1 | References | km s−1 | References | km s−1 | References | ||
| (1) | (2) | (3) | (4) | (5) | (6) | (7) | (8) | (9) | (10) | (11) |
| 00242463–0158201 | Gemini South Phoenix | +11.65 ± 1.60 | +10.4 ± 3 | 3 | +16 ± 2 | 7 | ⋯ | ⋯ | ⋯ | ⋯ |
| 00452143+1634446 | Keck II NIRSPEC | +3.16 ± 0.83 | +3.29 ± 0.43 | 1 | ⋯ | ⋯ | ⋯ | ⋯ | ⋯ | ⋯ |
| 01415823–4633574 | Magellan Clay MIKE | +6.41 ± 1.56 | +12 ± 15 | 2 | ⋯ | ⋯ | ⋯ | ⋯ | ⋯ | ⋯ |
| 03393521–3525440 | Magellan Clay MIKE | +7.43 ± 0.72 | +7.6 ± 3 | 3 | +6 ± 2 | 8 | +5.8 ± 2.4 | 5 | +10 ± 2 | 9 |
| 04433761+0002051 | Magellan Clay MIKE | +16.97 ± 0.76 | +17.1 ± 3 | 3 | ⋯ | ⋯ | ⋯ | ⋯ | ⋯ | ⋯ |
| 05233822–1403022 | Gemini South Phoenix | +12.48 ± 0.41 | +12.21 ± 0.21 | 1 | ⋯ | ⋯ | ⋯ | ⋯ | ⋯ | ⋯ |
| 06085283–2753583 | Magellan Clay MIKE | +26.35 ± 0.07 | +24 ± 1 | 4 | ⋯ | ⋯ | ⋯ | ⋯ | ⋯ | ⋯ |
| 1224522–123835 | Magellan Clay MIKE | −2.87 ± 0.59 | −5.8 ± 3 | 3 | −4.8 ± 2 | 7 | ⋯ | ⋯ | ⋯ | ⋯ |
| 14284323+3310391 | Magellan Clay MIKE | −39.14 ± 0.38 | −37.4 ± 2 | 7 | ⋯ | ⋯ | ⋯ | ⋯ | ⋯ | ⋯ |
| 15525906+2948485 | Magellan Clay MIKE | −19.90 ± 1.38 | −18.43 ± 0.11 | 1 | ⋯ | ⋯ | ⋯ | ⋯ | ⋯ | ⋯ |
| 18212815+1414010 | Keck II NIRSPEC | +9.08 ± 0.17 | +9.78 ± 0.21 | 1 | ⋯ | ⋯ | ⋯ | ⋯ | ⋯ | ⋯ |
| 20004841–7523070 | Magellan Clay MIKE | +4.40 ± 2.84 | +8 ± 2.4 | 5 | +11.77 ± 0.97 | 6 | ⋯ | ⋯ | ⋯ | ⋯ |
| 21041491-1037369 | Gemini South Phoenix | −30.90 ± 1.58 | −21.09 ± 0.41 | 1 | −21.2 ± 2.2 | 5 | ⋯ | ⋯ | ⋯ | ⋯ |
| 22244381–0158521 | Keck II NIRSPEC | −36.48 ± 0.01 | −37.55 ± 0.21 | 1 | ⋯ | ⋯ | ⋯ | ⋯ | ⋯ | ⋯ |
| 23515044–2537367 | Gemini South Phoenix | −5.68 ± 1.82 | −10 ± 3 | 3 | −12.3 ± 2.6 | 5 | ⋯ | ⋯ | ⋯ | ⋯ |
References. 1. Blake et al. (2010), 2. Kirkpatrick et al. (2006), 3. Reiners (2009), 4. Rice et al. (2010), 5. Burgasser et al. (2015), 6. Gálvez-Ortiz et al. (2010), 7. Mohanty et al. (2003), 8. Basri (2000), 9. Reid et al. (2002).
Download table as: ASCIITypeset image
Table 9. Adopted Near-infrared Spectral Types
| Name | SpT | SpT | Gravity Score | Gravity Type | Gravity Score | Gravity Type |
|---|---|---|---|---|---|---|
| Adopted | Allers13 | MedRes | MedRes | LowRes | LowRes | |
| (1) | (2) | (3) | (4) | (5) | (6) | (7) |
| 00040288–6410358 | L1 γ | L2.3 ± 0.3 | 2221 | VL-G | 2211 | VL-G |
| 00274197+0503417 | M8 β | M9.0 ± 0.8 | 2n11 | INT-G | 2n01 | INT-G |
| 00452143+1634446 | L0 β | L1.5 ± 0.4 | 1211 | INT-G | 1211 | INT-G |
| 00550564+0134365 | L2γ | L1.0 ± 0.9 | – | – | 2122 | VL-G |
| 01174748–3403258 | L1 γ | L2.2 ± 0.5 | 1211 | INT-G | 1211 | INT-G |
| 01174748–3403258(2) | L1 γ | L1.9 ± 0.5 | 2212 | VL-G | 2222 | VL-G |
| 01244599–5745379 | L0 γ | L0.7 ± 0.5 | 2222 | VL-G | 2222 | VL-G |
| 02103857–3015313 | L0 γ | L1.0 ± 0.3 | 2211 | VL-G | 2211 | VL-G |
| 02103857–3015313(2) | L0 γ | L2.2 ± 0.1 | 2112 | VL-G | 1122 | VL-G |
| 02251947–5837295 | M9 γ | M9.4 ± 0.1 | 1n11 | INT-G | 1n11 | INT-G |
| 02340093–6442068 | L0 β/γ | L0.8 ± 0.3 | 2211 | VL-G | 2211 | VL-G |
| 03231002–4631237 | L0γ | M9.0 ± 0.4 | – | – | 2222 | VL-G |
| 03264225–2102057 | L5β γ | L4.1 ± 0.1 | – | – | 0n01 | FLD-G |
| 04210718–6306022 | L5 γ | L4.2 ± 0.1 | 0n11 | INT-G | 0n01 | FLD-G |
| 04351455–1414468 | M7γa | M6.8 ± 0.4 | 2n22 | VL-G | 2n22 | VL-G |
| 05012406–0010452 | L4γ | L2.4 ± 0.1 | – | – | 2212 | VL-G |
| 05120636–2949540 | L4 pec | L4.1 ± 0.8 | 2010 | FLD-G | 2010 | FLD-G |
| 05120636–2949540(2) | L5βγ | L4.3 ± 0.4 | – | – | 0n01 | FLD-G |
| 05361998–1920396 | L1 γ | L2.1 ± 0.3 | 1222 | VL-G | 1212 | VL-G |
| 07123786–6155528 | L1 γ | L1.5 ± 0.5 | 2211 | VL-G | 2221 | VL-G |
| 09532126–1014205 | M9β | M9.7 ± 0.3 | 2n12 | VL-G | 2n02 | VL-G |
| 09593276+4523309 | ||||||
| 11020983–3430355 | M9γ | M8.3 ± 1.0 | 2n22 | VL-G | 2n22 | VL-G |
| 11544223–3400390 | L1 β | L0.8 ± 0.5 | 1111 | INT-G | 1101 | INT-G |
| 12563961–2718455 | L4 β | L3.4 ± 0.4 | 1211 | INT-G | 1201 | INT-G |
| 14112131–2119503 | M8 β | M8.3 ± 0.1 | 1n11 | INT-G | 1n01 | INT-G |
| 14482563+1031590 | L4 pec | L4.7 ± 0.8 | 2010 | FLD-G | 1010 | FLD-G |
| 15382417–1953116 | L4 γ | L3.5 ± 0.9 | 2211 | VL-G | 2211 | VL-G |
| 15382417–1953116(2) | L4γ | L2.1 ± 0.6 | – | – | 1021 | INT-G |
| 15515237+0941148 | >L5 γ | L3.3 ± 0.2 | – | – | – | – |
| 15575011–2952431 | L1 γ | L2.3 ± 0.6 | 2222 | VL-G | 2212 | VL-G |
| 17111353+2326333 | L0 pec | L0.4 ± 0.6 | 2211 | VL-G | 2211 | VL-G |
| 17260007+1538190 | L3 β/γ | L2.6 ± 0.3 | 1121 | INT-G | 1121 | INT-G |
| 17410280–4642218 | >L5 γ | L5.3 ± 0.8 | – | – | – | – |
| 18212815+1414010 | L4 pec | L3.5 ± 1.3 | 1111 | INT-G | 0101 | FLD-G |
| 19355595–2846343 | M9 γ | M9.3 ± 0.4 | 2n21 | VL-G | 2n11 | INT-G |
| 19564700–7542270 | L2 γ | L0.9 ± 0.2 | 2222 | VL-G | 2222 | VL-G |
| 20004841–7523070 | M9 γ | L0.2 ± 1.1 | 2n21 | VL-G | 2n21 | VL-G |
| 20025073–0521524 | >L5 β/γ | L5.5 ± 0.2 | – | – | – | – |
| 20135152–2806020 | L0 γ | L0.0 ± 0.4 | 2122 | VL-G | 2122 | VL-G |
| 20135152–2806020(2) | L0 γ | L0.0 ± 0.3 | 2122 | VL-G | 2122 | VL-G |
| PSO318 | L6-L8 γ | L6.8 ± 0.8 | – | – | – | – |
| 21265040–8140293 | L3 γ | L2.4 ± 0.1 | 1221 | VL-G | 1221 | VL-G |
| 21265040–8140293(2) | L3 γ | L2.4 ± 0.2 | 1221 | VL-G | 1221 | VL-G |
| 21543454–1055308 | L5 γ | L5.5 ± 0.8 | 2n11 | INT-G | 2n01 | INT-G |
| 22064498–4217208 | L4 β/γ | L3.3 ± 0.2 | 1111 | INT-G | 1111 | INT-G |
| 22064498–4217208(2) | L3-4 β/γ | L2.7 ± 0.2 | – | – | – | – |
| 22064498–4217208(3) | L3γ | L1.7 ± 0.8 | – | – | 1?12 | INT-G |
| 22443167+2043433 | L6-L8 γ | L6.7 ± 0.8 | – | – | – | – |
| 22495345+0044046 | L1 γ | L3.1 ± 0.3 | 2011 | INT-G | 2011 | INT-G |
| 23153135+0617146 | L0 γ | L1.0 ± 0.5 | 2222 | VL-G | 2212 | VL-G |
| 23153135+0617146(2) | L0γ | M9.9 ± 0.5 | – | – | 2222 | VL-G |
Note.
aReddening E(B–V) = 1.8 and SPT = M7 are a good solution, but spt/reddening is almost degenerate.A spectral type with a ? indicates questionable or extremely uncertain gravity features.Download table as: ASCIITypeset image
3.3.2. Gemini South Phoenix
The Phoenix instrument (previously on Gemini South) is a long-slit, high-resolution infrared echelle spectrograph, designed to obtain spectra between 1 and 5 μm at resolutions between R = 50,000 and R = 80,000. Spectra are not cross-dispersed, leaving only a narrow range of a single-order, selectable by order-sorting filters.
Observations of 18 sources were taken during semesters 2007B and 2009B using the H6420 filter to select H-band spectra in Order 36 (1.551–1.558 μm). Spectra were reduced using the supplied IDL Phoenix reduction codes. Observational data for each source are listed in Table 7.
3.3.3. Magellan Clay Magellan Inamori Kyocera Echelle (MIKE)
The MIKE on the Magellan II (Clay) telescope is a cross-dispersed, high-resolution optical spectrograph designed to cover the entire optical spectrum range (divided into two channels, blue: 0.32–0.48 μm, and red: 0.44–1.00 μm) at resolving powers of R ∼ 28,000 (blue) and R ∼ 22,000 (red) using the 10 slit. The output spectra contain a large range of overlapping echelle orders, each covering roughly 0.02 μm of the red optical spectrum.
Red-side spectra were taken on 2006 July 4, 2006 November 1 and 2. The observations comprise 17 target and standard spectra, with additional B-type and white dwarf flux calibrators. Observational data for each source are listed in Table 7. Spectra were reduced using the IDL MIKE echelle pipeline16 and orders 38–52 (0.92–0.65 μm) were extracted from every spectrum. Many of those orders were unusable for our purposes, and were not used in the final solutions. Telluric atmospheric features dominate the wavebands covered by orders 38 (telluric O2), 45 (A band), and 50 (B band). The orders higher (bluer) than 44 typically had insufficient signal due to the extremely faint and red colors of the target objects.
4. NEW NEAR-INFRARED SPECTRAL TYPES
We obtained spectra with FIRE, SpeX, and TSpec for 43 targets to investigate the near-infrared signatures of youth. Each object had either demonstrated optical low surface gravity features but were missing (or had poor) near-infrared data, or had low signal-to noise near-infrared spectra. Determining the spectral type and gravity classification for peculiar sources has its difficulties; primarily, because one wants to ground the peculiar object type by comparing to an equivalent field source. However, as will be seen in Section 7, the low-gravity sequence does not easily follow from the field sequence. In the infrared, Allers & Liu (2013) have presented a method for determining gravity classification using indices. Alternatively, the population of low-gravity sources (especially earlier L types) has grown in number such that templates of peculiar sources can be made for comparison (e.g., Gagné et al. 2015b, Cruz et al. submitted). For this work, we have defaulted to a visual match to templates or known sources—grounded by their optical data—as our primary spectral typing method. However, we also check each source against indices to ensure consistency.
In the case of each new spectrum, we visually compared to the library of spectra in the SpeX prism library17 as well as the low-gravity templates discussed in Gagné et al. (2015b). For the FIRE and TSpec echelle spectra, we first binned them to prism resolution (∼120). This visual check to known objects gave the match we found most reliable for this work in both type and gravity classification and it is listed in the "SpT adopted" column in Table 9. Figures 3–4 show two example spectra (prism and binned down FIRE data) compared visually to both field and very low-gravity sources, as representations of our spectral typing method.
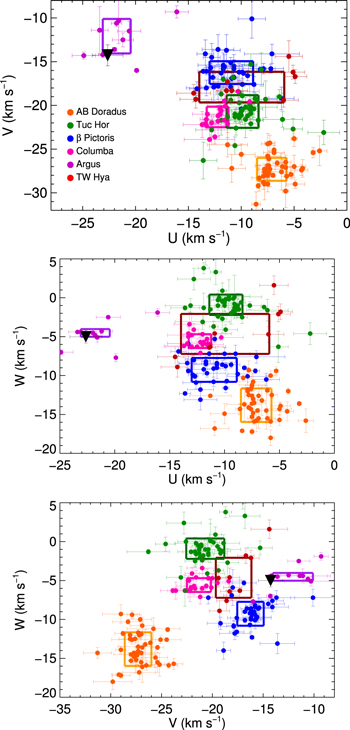
Figure 2. UVW properties of 0045 + 1634 (black filled triangle) compared to those of the members of the nearby young groups. Solid rectangles surround the furthest extent of highly probable members from Torres et al. (2008) but their distribution does not necessarily fill the entire rectangle.
Download figure:
Standard image High-resolution image
Figure 3. SpeX prism spectrum of 0055 + 0134 overplotted with a sample of field and very low-gravity subtype equivalents.
Download figure:
Standard image High-resolution image
Figure 4. FIRE spectrum of 0421–6306 binned to prism resolution and overplotted with a sample of field and very low-gravity subtype equivalents.
Download figure:
Standard image High-resolution imageAs a secondary check, we report the indices analysis of each object. A near-infrared spectral subtype is a required input for evaluating the gravity classification with the Allers & Liu (2013) system so we first applied the subtype indices (as described in Allers & Liu 2013) and list the results in the "SpT Allers13" column in Table 9. Once we had determined the closest near-infrared type, we evaluated the medium resolution (for FIRE and TSpec data) and/or the low-resolution gravity indices (for Prism data). We list the results of each in Table 9. In general we found that matching visually to low-gravity templates or known objects versus using indices were consistent within 1 subtype.
5. RADIAL VELOCITIES
Radial velocities from NIRSPEC, Phoenix, and MIKE were calculated using a custom python routine which uses cross-correlation with standard brown dwarfs to achieve 1 km s−1 radial velocity precision. Useable spectra have a resolving power of R = 20,000 or higher, and generally a signal to noise of at least 20. All of the data were corrected to heliocentric radial velocity by shifting the wavelength grid. Brown dwarf standards (sourced primarily from Blake et al. 2010) were observed and corrected with the same settings as the targets, and paired with objects of matching spectral type. Given that our radial velocity sample is bimodal with peaks at L0 and L4, our spectra are fit against relatively few standards.
The python code calculates radial velocities on the fly, and operates on optical and infrared data without modification. The radial velocity inputs were the wavelength, flux, and uncertainty data as three one-dimensional arrays, for both the target and the standard. The target and standard spectra were first cropped to only the portion where they overlap, and then interpolated onto a log-normal wavelength grid.
From there, 5000 trials were conducted with different randomized Gaussian noise added to the wavelength grids of the target and standard, according to the per-element uncertainties. This was done to account for the uncertainties on the fluxes and to provide a method of quantifying the uncertainty on the output radial velocity. For each of the 5000 trials, the two spectra were cross-correlated to produce a wavelength shift between them. A small 400-element region around the peak of the cross-correlation function was fit with a Gaussian and a linear term, to locate the exact peak of the cross-correlation on a sub-element basis. The widths (and therefore per-measurement errors) of the cross-correlation peak were discarded and assumed to be accounted for in the actual spread of the resulting set of peaks.
The results of the 5000 trials formed (in well-determined cases) a Gaussian histogram centered on the radial velocity shift between the two systems. The width of that Gaussian was taken to represent the uncertainty in the measured radial velocity. This pixel shift was converted into km s−1 radial velocity, and corrected for the known velocity of the standard. Semi-independent verification of the radial velocities was accomplished by measuring the velocity relative to two different standards or, where available, using multiple orders from the same spectrum.
The process was sensitive to virtually all unwanted processes that produce features in the brown dwarf spectra. Chief among these were cosmic rays and detector hot pixels, which were pixel-scale events removed from the spectra prior to interpolation onto the grid and provide very little signal in the RV correlation. The most important effect was telluric lines, which appeared like normal spectral features but did not track the radial velocity of the star. These were dealt with by identifying orders whose contamination was severe enough to produce discordant radial velocities and avoiding them in the analysis.
Table 7 lists the final radial velocity values for each source. Table 8 shows a comparison of sources for which there was a literature value.
5.1. Instrument-specific Differences
MIKE data has multiple echelle orders, and all stars were measured against two L2 dwarf standards: LHS 2924 and BRI 1222–1221 (Mohanty et al. 2003). All orders were examined by eye, and determinations were made as to whether they contained sufficient signal for a believable radial velocity. This was corroborated by cross-checking the result against other orders from the same star and radial velocity. Some orders had broader cross-correlation functions, and the Gaussian was fit to a 200 pixel region around the peak rather than the standard 100 pixels. In other orders, a small a-physical secondary peak in the final results appeared and was removed from the Gaussian fit for the final radial velocity for that order.
After visual inspection, the most consistent orders—both within the match between the two stars, and between the two standards—were combined into a weighted mean and weighted standard deviation. For all stars, the results of orders 39–44, collectively covering 0.77–0.89 μm, were deemed sufficiently reliable (despite the presence of telluric water features) to be used in the final result.
6. COMPUTING KINEMATIC PROBABILITIES IN NEARBY YOUNG MOVING GROUPS
Among the 152 brown dwarfs investigated for kinematic membership in this work, we report 37 new radial velocities, 8 new parallaxes, and 33 new proper motions (13 of which are reported as new from 2MASS to WISE proper-motion measurements). In total, 27 targets have full kinematics (a parallax, proper motion, and radial velocity), and the remaining 123 have only partial kinematics—16 have a parallax and proper motion but no radial velocity, 26 have radial velocity and proper motion but no parallax, and 81 have proper motions but no parallax or radial velocity measurement. All of the astrometric information for this sample is listed in Table 10.
Table 10. Kinematic Data on Low Surface Gravity Dwarfs
| 2MASS Designation | SpT | SpT |  |
μdecl. | πa | RV | (References) |
|---|---|---|---|---|---|---|---|
| (OpT) | (IR) | ('' yr−1) | ('' yr−1) | (mas) | (km s−1) | ||
| (1) | (2) | (3) | (4) | (5) | (6) | (7) | (8) |
| 00011217+1535355 | – – | L4β | 0.1352 ± 0.0107 | −0.1696 ± 0.0137 | – | – | 10 |
| 00040288–6410358 | L1γ | L1γa | 0.064 ± 0.012 | −0.047 ± 0.012 | (17 ± 1) | (6.07 ± 2.89) | 1 |
| 00182834–6703130 | – – | L0γ | 0.066 ± 0.004 | −0.0523 ± 0.0126 | – | – | 1,10 |
| 00191296–6226005 | – – | L1γ | 0.0541 ± 0.0047 | −0.0345 ± 0.0121 | (21 ± 6) | (6.7 ± 2.5) | 1,10 |
| 00192626+4614078 | M8– | M8β | 0.14000 ± 0.06 | −0.1 ± 0.05 | (31 ± 3) | −19.5 ± 2 | 2,4 |
| 00274197+0503417 | M9.5β | L0β | 0.0105 ± 0.0004 | −0.0008 ± 0.0003 | 13.8 ± 1.6 | – | 3 |
| 00303013–1450333 | L7– | L4-L6β | 0.2497 ± 0.0141 | −0.0053 ± 0.015 | 37.42 ± 4.50 | – | 10, 11 |
| 00325584–4405058 | L0γ | L0β | 0.12830 ± 0.0034 | −0.0934 ± 0.003 | 21.6 ± 7.2 | 12.95 ± 1.92 | 1, 5 |
| 003323.86–1521309 | L4β | L1 | 0.30950 ± 0.0104 | 0.0289 ± 0.0183 | 24.8 ± 2.5 | −6.37 ± 0.40 | 1, 6 |
| 00344300–4102266 | – – | L1β | 0.0939 ± 0.0079 | −0.0412 ± 0.0108 | – | – | 10 |
| 00374306–5846229 | L0γ | – – | 0.05700 ± 0.01 | 0.017 ± 0.005 | – | 6.62 ± 0.07 | 1 |
| 00381489–6403529 | – – | M9.5β | 0.0871 ± 0.0038 | −0.0353 ± 0.0105 | (23 ± 5) | (7.27 ± 2.81) | 1, 10 |
| 00425923+1142104 | – – | M9β | 0.0929 ± 0.017 | −0.0758 ± 0.0152 | – | – | 10 |
| 00452143+1634446 | L2β | L2γ | 0.35500 ± 0.01 | −0.04 ± 0.01 | 62.5 ± 3.7 | 3.16 ± 0.83 | 1 |
| 00464841+0715177 | M9β | L0δ | 0.09800 ± 0.022 | −0.051 ± 0.01 | – | −2.75 ± 0.27 | 1, 2 |
| 00470038+6803543 | L7(γ?) | L6-L8γ | 0.38700 ± 0.004 | −0.197 ± 0.004 | 82 ± 3 | −20 ± 1.4 | 7 |
| 00550564+0134365 | L2γ | L2γ | 0.04400 ± 0.024 | −0.082 ± 0.024 | – | −1.21 ± 0.38 | 1, 2 |
| 00584253–0651239 | L0– | L1β | 0.1367 ± 0.002 | −0.1226 ± 0.0018 | 33.8 ± 4.0 | – | 5 |
| 01033203+1935361 | L6β | L6β | 0.29300 ± 0.0046 | 0.0277 ± 0.0047 | 46.9 ± 7.6 | – | 8 |
| 01174748–3403258 | L1β | L1βa | 0.084 ± 0.015 | −0.045 ± 0.008 | (20 ± 3) | (3.96 ± 2.09) | 1 |
| 01205114–5200349 | – – | L1γ | 0.0921 ± 0.0058 | −0.0404 ± 0.0102 | (24 ± 4) | (7.22 ± 2.5) | 1, 10 |
| 01231125–6921379 | M7.5γ | – – | 0.08278 ± 0.00174 | −0.02646 ± 0.00139 | 21.6 ± 3.3 | 10.9 ± 3 | 4, 9 |
| 01244599–5745379 | L0γ | L0γ | −0.00300 ± 0.01 | 0.018 ± 0.019 | – | – | 2 |
| 01262109+1428057 | L4γ | L2γ | 0.07000 ± 0.012 | −0.008 ± 0.012 | – | – | 1 |
| 01294256–0823580 | M5– | M7β | 0.1007 ± 0.0084 | −0.0564 ± 0.009 | – | – | 10 |
| 01415823–4633574 | L0γ | L0γ | 0.105 ± 0.01 | −0.049 ± 0.01 | (25 ± 3) | 6.409 ± 1.56 | 1 |
| 01531463–6744181 | L2– | L3β | 0.071 ± 0.0037 | −0.0166 ± 0.0127 | (21 ± 7) | (10.41 ± 2.71) | 1, 10 |
| 02103857–3015313 | L0γ | L0γa | 0.145 ± 0.036 | −0.04 ± 0.007 | (32 ± 8) | 7.82 ± 0.274 | 1 |
| 02212859–6831400 | M8β | – – | 0.05390 ± 0.0044 | 0.0137 ± 0.0045 | 25.4 ± 3.6 | – | 8 |
| 02215494–5412054 | M9β | – – | 0.136 ± 0.01 | −0.01 ± 0.017 | (31 ± 5) | 10.18 ± 0.097 | 1, 2 |
| 02235464–5815067 | L0γ | – – | 0.09860 ± 0.0008 | −0.0182 ± 0.0009 | 27.4 ± 2.6 | 10.36 ± 0.23 | 1 |
| 02251947–5837295 | M9β | M9γ | 0.08500 ± 0.01 | −0.03 ± 0.018 | – | – | 2 |
| 02265658–5327032 | – – | L0δ | 0.0936 ± 0.0053 | −0.0028 ± 0.0107 | – | – | 1, 10 |
| 02292794–0053282 | – – | L0γ | −0.00900 ± 0.098 | −0.054 ± 0.202 | – | – | 1 |
| 02340093–6442068 | L0γ | L0βγ | 0.088 ± 0.012 | −0.015 ± 0.012 | (21 ± 5) | 11.762 ± 0.721 | 1 |
| 02410564–5511466 | – – | L1γ | 0.0965 ± 0.0052 | −0.0123 ± 0.0106 | (24 ± 4) | (11.73 ± 2.44) | 1, 10 |
| 02411151–0326587 | L0γ | L1γ | 0.07370 ± 0.001 | −0.0242 ± 0.0019 | 21.4 ± 2.6 | 6.34 ± 7.98 | 1 |
| 02501167–0151295 | – – | M7β | 0.0627 ± 0.0087 | −0.0306 ± 0.009 | 30.2 ± 4.5 | – | 25, 10 |
| 02530084+1652532 | – – | M7β | 1.5124 ± 0.0406 | 0.4305 ± 0.0447 | 260.63 ± 2.69 | – | 24 |
| 02535980+3206373 | M7β | M6β | 0.08700 ± 0.01 | −0.096 ± 0.01 | 17.7 ± 2.5 | – | 1 |
| 02583123–1520536 | – – | L3β | 0.0625 ± 0.0098 | −0.0581 ± 0.0097 | – | – | 1, 10 |
| 03032042–7312300 | L2γ | – – | 0.04300 ± 0.012 | 0.003 ± 0.012 | – | – | 1 |
| 03164512–2848521 | L0– | L1β | 0.0952 ± 0.0082 | −0.081 ± 0.0094 | – | – | 10 |
| 03231002–4631237 | L0γ | L0γa | 0.066 ± 0.008 | 0.001 ± 0.016 | (17 ± 3) | 13.001 ± 0.045 | 1 |
| 03264225–2102057 | L5β | L5βγa | 0.108 ± 0.014 | −0.146 ± 0.015 | (41 ± 1) | (22.91 ± 2.07) | 1, 2 |
| 03350208+2342356 | M8.5– | M7.5β | 0.05400 ± 0.01 | −0.056 ± 0.01 | 23.6 ± 1.3 | 15.5 ± 1.7 | 12 |
| 03393521–3525440 | M9β | L0β | 0.30580 ± 0.0004 | 0.270548 ± 0.0004 | 155.89 ± 1.03 | 6.92 ± 1.05 | 1, 13 |
| 03420931–2904317 | – – | L0β | 0.0671 ± 0.01 | −0.0207 ± 0.0122 | – | – | 1, 10 |
| 03421621–6817321 | L4γ | – – | 0.0653 ± 0.0028 | 0.0185 ± 0.0091 | (21 ± 9) | (13.87 ± 2.62) | 1 |
| 03550477–1032415 | M8.5– | M8.5β | 0.0464 ± 0.0072 | −0.0265 ± 0.0065 | – | – | 10 |
| 03552337+1133437 | L5γ | L3-L6γ | 0.22500 ± 0.0132 | −0.63 ± 0.015 | 110.8 ± 4.3 | 11.92 ± 0.22 | 6, 14 |
| 03572695–4417305b | L0β | L0β | 0.06400 ± 0.013 | −0.02 ± 0.019 | – | 10.73 ± 4.60 | 1, 2 |
| 04062677–3812102 | L0γ | L1γ | 0.00900 ± 0.012 | 0.029 ± 0.012 | – | – | 1 |
| 04185879–4507413 | – – | L3γ | 0.0533 ± 0.0084 | −0.0082 ± 0.0126 | – | – | 10 |
| 04210718–6306022 | L5β | L5γ | 0.14600 ± 0.008 | 0.191 ± 0.018 | – | 14.70 ± 0.33 | 1, 2 |
| 04351455–1414468 | M8γ | M7γ | 0.00900 ± 0.014 | 0.016 ± 0.014 | – | 16.16 ± 1.76 | 1, 2 |
| 04362788–4114465 | M8β | M9γ | 0.073 ± 0.012 | 0.013 ± 0.016 | (23 ± 6) | 14.972 ± 1.446 | 1, 2 |
| 04400972–5126544 | – – | L0γ | 0.0458 ± 0.0062 | 0.0078 ± 0.0105 | – | – | 10 |
| 04433761+0002051b | M9γ | M9γ | 0.02800 ± 0.014 | −0.099 ± 0.014 | – | 16.97 ± 0.76 | 1, 2 |
| 04493288+1607226 | – – | M9γ | 0.0196 ± 0.0094 | −0.038 ± 0.0092 | – | – | 10 |
| 05012406–0010452 | L4γ | L3γ | 0.19030 ± 0.0095 | −0.1428 ± 0.0125 | 51 ± 3.7 | 21.77 ± 0.66 | 1, 6 |
| 05104958–1843548 | – – | L2β | 0.0882 ± 0.0095 | −0.0399 ± 0.0106 | – | – | 10 |
| 05120636–2949540 | L5γ | L5β | −0.01000 ± 0.013 | 0.08 ± 0.015 | – | – | 1 |
| 05181131–3101529 | M6.5– | M7β | 0.0416 ± 0.0068 | 0.0008 ± 0.0081 | – | – | 10 |
| 05184616–2756457 | L1γ | L1γ | 0.02860 ± 0.0042 | −0.016 ± 0.004 | 21.4 ± 6.9 | 24.35 ± 0.19 | 1, 8 |
| 05264316–1824315 | – – | M7β | 0.0247 ± 0.0093 | −0.0227 ± 0.0095 | – | – | 10 |
| 05341594–0631397 | M8γ | M8γ | 0.00200 ± 0.012 | −0.007 ± 0.012 | – | – | 1 |
| 05361998–1920396 | L2γ | L2γ | 0.02460 ± 0.0053 | −0.0306 ± 0.005 | 25.6 ± 9.4 | 22.065 ± 0.695 | 1, 8 |
| 05402325–0906326 | – – | M9β | 0.0376 ± 0.0098 | −0.0292 ± 0.0097 | – | – | 10 |
| 05575096–1359503 | M7– | M7γ | 0.00000 ± 0.005 | 0 ± 0.005 | 1.9 ± 1 | 30.3 ± 2.8 | 12 |
| 06023045+3910592 | L1– | L1β | 0.15700 ± 0.01 | −0.504 ± 0.01 | 88.5 ± 1.6 | – | 1 |
| 06085283–2753583 | M8.5γ | L0γ | 0.00890 ± 0.0035 | 0.0107 ± 0.0035 | 32 ± 3.6 | 26.35 ± 0.07 | 1, 8 |
| 06272161–5308428 | – – | L0βγ | 0.0104 ± 0.0066 | 0.0651 ± 0.0123 | – | – | 10 |
| 06322402–5010349 | L3β | L4γ | −0.10020 ± 0.0052 | −0.0046 ± 0.0088– | – | – | 1, 10 |
| 06524851–5741376 | M8β | – – | 0.00100 ± 0.0034 | 0.0292 ± 0.0033 | 31.3 ± 3.2 | – | 8 |
| 07123786–6155528 | L1β | L1γ | −0.03570 ± 0.0049 | 0.0791 ± 0.0048 | 22.9 ± 9.1 | – | 8 |
| 07140394+3702459 | M8– | M7.5β | −0.0984 ± 0.0069 | −0.171 ± 0.0089 | 80.10 ± 4.8 | – | 26 |
| 08095903+4434216 | – – | L6p | −0.1833 ± 0.0081 | −0.2019 ± 0.013 | – | – | 10 |
| 08561384–1342242 | – – | M8γ | −0.0576 ± 0.0078 | −0.0194 ± 0.0081 | – | – | 10 |
| 08575849+5708514 | L8– | L8– | −0.4181 ± 0.0044 | −0.3706 ± 0.0113 | – | – | 10 |
| 09451445–7753150 | – – | M9β | −0.0345 ± 0.0016 | 0.0436 ± 0.0119 | – | – | 10 |
| 09532126–1014205 | M9γ | M9β | −0.07000 ± 0.007 | −0.06 ± 0.009 | – | – | 1 |
| 09593276+4523309 | – – | L3γ | −0.08700 ± 0.009 | −0.126 ± 0.012 | – | 2.7 ± 0.7 | 1 |
| G196-3B | L3β | L3γ | −0.13230 ± 0.0107 | −0.2021 ± 0.0137 | 41 ± 4.1 | – | 6 |
| 10212570–2830427 | – – | L4βγ | −0.0526 ± 0.0131 | −0.0375 ± 0.0163 | – | – | 10 |
| 10220489+0200477 | M9β | M9β | −0.15620 ± 0.0066 | −0.429 ± 0.0068 | 26.4 ± 11.5 | −7.9 ± 4.8 | 8 |
| 10224821+5825453 | L1β | L1β | −0.80700 ± 0.01 | −0.73 ± 0.01 | 54.3 ± 2.5 | 19.29 ± 0.11 | 1 |
| TWA28 | M8.5γ | M9γ | −0.06720 ± 0.0006 | −0.014 ± 0.0006 | 18.1 ± 0.5 | (13.3 ± 1.8) | 18 |
| 11064461–3715115 | – – | M9γ | −0.0408 ± 0.0076 | −0.0066 ± 0.0102 | – | – | 10 |
| 11083081+6830169 | L1γ | L1γ | −0.2389 ± 0.0026 | −0.1922 ± 0.0092 | – | – | 10 |
| 11193254–1137466 | – – | L7γ | -.1451 ± 0.0149 | −0.0724 ± 0.016 | (35 ± 5) | 8.5 ± 3.3 | 27 |
| 11271382–3735076 | – – | L0δ | −0.0613 ± 0.0138 | 0.0132 ± 0.0208 | – | – | 10 |
| TWA26 | M9γ | M9γ | −0.08120 ± 0.0039 | −0.0277 ± 0.0021 | 23.82 ± 2.58 | 11.6 ± 2 | 15,16 |
| 114724.10–204021.3 | – – | L7γ | −0.1221 ± 0.012 | −0.0745 ± 0.0113 | (32 ± 4) | (9.61 ± ) | 28 |
| 11480096–2836488 | – – | L1β | −0.0743 ± 0.0135 | −0.0194 ± 0.0161 | – | – | 10 |
| 11544223–3400390 | L0β | L1β | −0.16100 ± 0.008 | 0.012 ± 0.007 | – | – | 1 |
| TWA27A | M8γ | M8γ | −0.06300 ± 0.002 | −0.023 ± 0.003 | 19.1 ± 0.4 | 11.2 ± 2 | 16,19 |
| 12074836–3900043 | L0γ | L1γ | −0.0572 ± 0.0079 | −0.0248 ± 0.0105 | (15 ± 3) | (9.48 ± 1.91) | 17 |
| 12271545–0636458 | M9– | M8.5β | −0.1141 ± 0.0111 | −0.0646 ± 0.0109 | – | – | 10 |
| TWA29 | M9.5γ | L0γ | −0.04030 ± 0.0117 | −0.0203 ± 0.017 | 12.66 ± 2.07 | (7.74 ± 2.04) | 15 |
| 12474428–3816464 | – – | M9γ | −0.03320 ± 0.0071 | −0.0166 ± 0.0095 | – | – | 17 |
| 12535039–4211215 | – – | M9.5γ | −0.0388 ± 0.009 | −0.0121 ± 0.0132 | – | – | 10 |
| 12563961–2718455 | – – | L4β | −0.0674 ± 0.0102 | −0.0565 ± 0.0127 | – | – | 10 |
| 14112131–2119503 | M9β | M8β | −0.07800 ± 0.009 | −0.073 ± 0.011 | – | −0.9 ± 2.5 | 1 |
| 14252798–3650229 | L3– | L4γ | −0.28489 ± 0.0014 | −0.46308 ± 0.001 | 86.45 ± 0.83 | 5.37 ± 0.25 | 13,14 |
| 15104786–2818174 | M9– | M9β | −0.1092 ± 0.0081 | −0.0399 ± 0.0098 | – | – | 10 |
| 15291017+6312539 | – – | M8β | −0.1132 ± 0.0033 | 0.0447 ± 0.0091 | – | – | 10 |
| 15382417–1953116 | L4γ | L4γ | 0.02600 ± 0.007 | −0.045 ± 0.007 | – | – | 1 |
| 15470557–1626303A | – – | M9β | −0.0539 ± 0.0087 | −0.1253 ± 0.009 | – | – | 10 |
| 15474719–2423493 | M9γ | L0β | −0.13500 ± 0.009 | −0.127 ± 0.008 | – | −6.52 ± 0.35 | 1 |
| 15515237+0941148 | L4γ | >L5γ | −0.07000 ± 0.022 | −0.05 ± 0.022 | – | – | 2 |
| 15525906+2948485 | L0β | L0β | −0.16200 ± 0.01 | −0.06 ± 0.01 | 48.8 ± 2.7 | −18.43 ± 0.11 | 1, 14 |
| 15575011–2952431 | M9δ | L1γ | −0.01000 ± 0.012 | −0.028 ± 0.012 | – | – | 1 |
| 16154255+4953211 | L4γ | L3-L6γ | −0.08000 ± 0.012 | 0.018 ± 0.012 | – | −25.59 ± 3.18 | 1 |
| 17111353+2326333 | L0γ | L1β | −0.06300 ± 0.015 | −0.035 ± 0.012 | – | −20.69 ± 0.75 | 1 |
| 17260007+1538190 | L3.5γ | L3γ | −0.04310 ± 0.0071 | −0.0557 ± 0.0052 | 28.6 ± 2.9 | −20.54 ± 0.84 | 1, 6 |
| 17410280–4642218 | – – | L6-L8γ | −0.02040 ± 0.0092 | −0.343 ± 0.0137 | – | −5.7 ± 5.1 | 20 |
| 18212815+1414010 | L4.5– | L4pec | 0.23027 ± 0.00016 | −0.24149 ± 0.00012 | 106.65 ± 0.23 | 9.08 ± 0.17 | 1, 22 |
| 19350976–6200473 | – – | L1γ | −0.0043 ± 0.0063 | −0.0533 ± 0.0162 | – | – | 10 |
| 19355595–2846343 | M9γ | M9γ | 0.03400 ± 0.012 | −0.058 ± 0.012 | – | – | 1 |
| 19564700–7542270 | L0γ | L2γ | 0.00900 ± 0.012 | −0.059 ± 0.012 | – | – | 1 |
| 20004841–7523070 | M9γ | M9γa | 0.069 ± 0.012 | −0.11 ± 0.004 | (31 ± 1) | 4.397 ± 2.842 | 1 |
| 20025073–0521524 | L5β | L5-L7γ | −0.09800 ± 0.005 | −0.11 ± 0.008 | – | – | 1 |
| 20113196–5048112 | – – | L3γ | 0.0213 ± 0.0081 | −0.0713 ± 0.0145 | – | – | 10 |
| 20135152–2806020 | M9γ | L0γ | 0.04300 ± 0.012 | −0.068 ± 0.012 | – | −6.53 ± 0.24 | 1 |
| 20282203–5637024 | – – | M8.5γ | 0.0233 ± 0.0053 | −0.0604 ± 0.0106 | – | – | 10 |
| 20334473–5635338 | – – | L0γ | 0.016 ± 0.0061 | −0.0731 ± 0.0125 | – | – | 10 |
| 20391314–1126531 | M8– | M7β | 0.0485 ± 0.009 | −0.0898 ± 0.009 | – | – | 10 |
| 20575409–0252302 | L1.5– | L2β | 0.00160 ± 0.0038 | −0.0863 ± 0.0039 | 70.1 ± 3.7 | −24.68 ± 0.61 | 8 |
| PSO318 | – – | L6-L8γ | 0.13730 ± 0.0013 | −0.1387 ± 0.0014 | 40.7 ± 2.4 | −6.0 |
21, 23 |
| 21265040–8140293 | L3γ | L3γ | 0.05560 ± 0.0014 | −0.1018 ± 0.003 | 31.3 ± 2.6 | 10.03 ± 0.49 | 1 |
| 21324036+1029494 | – – | L4β | 0.1078 ± 0.0164 | 0.0297 ± 0.0181 | – | – | 10 |
| 21543454–1055308 | L4β | L5γ | 0.17500 ± 0.012 | 0.009 ± 0.012 | – | – | 1 |
| 21544859–7459134 | – – | M9.5β | 0.0407 ± 0.0022 | −0.0796 ± 0.0122 | (21 ± 7) | (6.21 ± 3.1) | 1, 10 |
| 21572060+8340575 | L0– | M9γ | 0.1248 ± 0.0008 | 0.0441 ± 0.0154 | – | – | 10 |
| 22025794–5605087 | – – | M9γ | 0.0496 ± 0.0052 | −0.0696 ± 0.0103 | – | – | 10 |
| 22064498–4217208 | L4γ | L4γa | 0.128 ± 0.013 | −0.181 ± 0.008 | (35 ± 2) | (7.6 ± 2.0) | 1 |
| 22081363+2921215 | L3γ | L3γ | 0.09070 ± 0.003 | −0.0162 ± 0.0037 | 21.2 ± 0.7 | −15.59 ± 1.93 | 1, 6 |
| 22134491–2136079 | L0γ | L0γ | 0.06000 ± 0.011 | −0.063 ± 0.017 | – | −4.92 ± 4.18 | 1, 2 |
| 22351658–3844154 | – – | L1.5γ | 0.0505 ± 0.0078 | −0.0757 ± 0.0109 | (22 ± 2) | (−4.9 ± 3.1) | 10 |
| 22353560–5906306 | – – | M8.5β | 0.0556 ± 0.0051 | −0.081 ± 0.0108 | (23 ± 5) | (1.71 ± 3.14) | 1, 10 |
| 22443167+2043433 | L6.5p– | L6-L8γa | 0.252 ± 0.014 | −0.214 ± 0.011 | (54 ± 4) | (−15.5 ± 1.7) | 1, 2 |
| 22495345+0044046 | L4γ | L3β | 0.07500 ± 0.018 | 0.026 ± 0.018 | – | −3.26 ± 0.90 | 1, 2 |
| 23153135+0617146 | L0γ | L0γ | 0.05600 ± 0.012 | −0.039 ± 0.012 | – | −14.69 ± 0.52 | 1 |
| 23224684–3133231 | L0β | L2β | −0.19480 ± 0.0074 | −0.5273 ± 0.0075 | 58.6 ± 5.6 | 33.86 ± 1.11 | 1, 8 |
| 23225299–6151275 | L2γ | L3γa | 0.062 ± 0.01 | −0.085 ± 0.009 | (22 ± 1) | 6.747 ± 0.75 | 1 |
| 23231347–0244360 | M8.5– | M8β | 0.0859 ± 0.0097 | −0.0435 ± 0.0106 | – | – | 10 |
| 23255604–0259508 | L3– | L1γ | 0.0783 ± 0.0127 | −0.0958 ± 0.011 | – | – | 10 |
| 23360735–3541489 | – – | M9β | 0.0696 ± 0.0082 | −0.0807 ± 0.0099 | – | – | 10 |
| 23433470–3646021 | – – | L3-L6γ | 0.087 ± 0.0083 | −0.0987 ± 0.0125 | – | – | 10 |
| 23453903+0055137 | M9– | M9β | 0.0841 ± 0.0134 | −0.0461 ± 0.0117 | – | – | 10 |
| 23520507–1100435 | M7– | M8β | 0.0881 ± 0.009 | −0.1145 ± 0.0085 | – | – | 10 |
Notes.
A spectral type with a ? indicates questionable or extremely uncertain gravity features.
aThese sources have new infrared spectra presented in this paper. In the majority of cases, we use the infrared spectral type and gravity classification diagnosed in this work. If an object had SpeX data, then we default to the resultant type and classification with that data.Parallaxes in parentheses "( )" are kinematic distances. bThese sources were listed in Filippazzo et al. (2015) as members of associations but, as has been noted in Table 12, we have downgraded them to ambiguos young objects.References. 1. This Paper, 2. Faherty et al. (2009), 3. Dahn et al. (2002), 4. Reiners & Basri (2009), 5. Marocco et al. (2013), 6. Zapatero Osorio et al. (2014), 7. Gizis et al. (2015), 8. Faherty et al. (2012), 9. Riedel (2015), 10. Gagné et al. (2015b), 11. Vrba et al. (2004), 12. Shkolnik et al. (2012), 13. Dieterich et al. (2014), 14. Blake et al. (2010), 15. Weinberger et al. (2013), 16. Mohanty et al. (2003), 17. Gagné et al. (2014a), 18. Teixeira et al. (2008), 19. Ducourant et al. (2014), 20. Schneider et al. (2014), 21. Liu et al. (2013), 22. Sahlmann et al. (2016), 23. Allers et al. (2016), 24. Henry et al. (2006), 25. Tinney et al. (1995), 26. Dittmann et al. (2014), 27. Kellogg et al. (2016), 28. Schneider et al. (2016).
As discussed in Section 2, there are 51 objects classified optically as γ and 80 with the equivalent infrared classification. There are also 27 objects classified optically as β and 57 with the equivalent infrared classification. Given the gravity indications, we regard each object as a potentially young source and investigate membership in a group within 100 pc of the Sun. To assess the likelihood of membership, we employed four different tools to examine the available kinematic data:
-
1.BANYAN I Bayesian statistical calculator (Malo et al. 2013) and its successor,
-
2.BANYAN II (Gagné et al. 2014c),
-
3.LACEwING (Riedel 2015), and
-
4.Convergent point method of Rodriguez et al. (2013).
The plurality of measurements in combination with a visual inspection of an objects kinematics against bona fide members (BMs) listed in (Malo et al. 2013) along with the individual kinematic boxes of Zuckerman & Song (2004) drove our decision on group membership.
The four different methods test for membership in different sets of groups—LACEwING considers 14 distinct groups, BANYAN I and II consider 7 groups (or 8 including the "Old" object classification), and the convergence method tests for membership in 6 groups. Each method has its benefits and flaws. For instance Banyan I is a fast bayesian formalism that uses flat priors but assumes (probably unrealistically) that radial velocity, and proper motion in a given direction are Gaussian. Banyan II deals better with transforming measurements to probabilities based on the distribution of known members (does not assume a Gaussian distribution) however it likely has incomplete/imperfect lists of bona fide members. LACEwING is similar to Banyan I in its assumption that radial velocity, and proper motion in a given direction are Gaussian but it requires fitting a model to a (arguably much cleaner list of) bona fide members of multiple groups not covered by the other methods. The convergent point method is a simple yet different approach that estimates the probability of membership in a known group by measuring the proper motions in directions parallel and perpendicular to the location of a given groups convergent point. Unfortunately, this method does not take into account measured radial velocities or distances. Given the benefits and flaws of each method, we chose to take the output of each into consideration as we decided on membership for each target. For an adequate comparison, we only considered membership in six groups: TW Hydrae, β Pictoris, Tucana Horologium, Columba, Argus (which is not tested by the Convergence code), and AB Doradus. All other groups could not be consistently checked. Therefore they may be mentioned (e.g., Chamaeleon near, Octans, Hyades) but are only considered tentative until further kinematic investigation.
Furthermore, the output of each code should be viewed slightly differently. In Malo et al. (2013), the authors adopt a membership probability threshold of 90% to recover BMs. Banyan II supplements with a contamination probability and finds this number should be less than a few percent with a high membership probability (we impose >90% based on Banyan I) in order to recover BMs (Gagné et al. 2014c). LACEwING (as described in Riedel 2015) finds <20%–60% is low probability and >60% is high probability for group membership. Convergent point reports distinct probabilities for each group between 0%–100% (hence objects can have >90% probability of membership in more than one group). As with Banyan I, we impose >90% as a high probability threshold for membership on convergent point as well.
In assessing the membership probability, we found four different categories for describing an object:
-
1.Non-member (NM): an object that is kinematically eliminated from falling into a nearby group regardless of future astrometric measurements;
-
2.Ambiguous member (AM): an object that requires updated astrometric precision because it could either belong to more than one group or it cannot be differentiated from the field;
-
3.High-likelihood member (HLM): an object that does not have full kinematics but is regarded as high confidence (>90% in Banayan I, >90% in Banyan II with <5% contamination, >90% in convergent point, >60% in LACEwING) in three of the four codes; and
-
4.BM: an object regarded as a high-likelihood member with full kinematics (parallax, proper motion, radial velocity) demonstrating that it is in line with known higher-mass BMs of nearby groups.
6.1. Full Kinematic Sample
For the 28 targets with full kinematics, we compute the XYZ spatial positions and UVW velocities following the formalism of Johnson & Soderblom (1987), which employs U/X in the direction of the Galactic center, providing a right-handed coordinate system. In general, the resulting values are limited by the parallax precision. For these 28 objects, visual inspection against the positions and velocities of the BMs in each group (as listed by Malo et al. 2013) gave an obvious and strong indication of membership. We used the four other methods listed above as confirmation for the visual inspection. The XYZ spatial positions and UVW velocities for systems with full kinematic information are given in Table 11. A visual example of the phase-space motions of 0045 + 1634, a new BM of Argus, is shown in Figure 2. Among the full kinematic sample, we found that 11 objects stand out as BMs, 9 objects are classified as ambiguous, and 8 are classified as NMs. The outcome of assessing the likelihood of membership from each kinematic method is listed in Table 12.
Table 11. Kinematics for Target Dwarfs
| Name | U | V | W | X | Y | Z |
|---|---|---|---|---|---|---|
| (1) | (2) | (3) | (4) | (5) | (6) | (7) |
| 00325584–4405058 | −10.77 ± 3.85 | −32.08 ± 8.55 | −8.34 ± 2.26 | 8.96 ± 2.59 | −9.24 ± 2.67 | −41.15 ± 11.89 |
| 003323.86–1521309 | −52.85 ± 5.68 | −26.91 ± 3.93 | 3.23 ± 0.86 | −1.86 ± 0.18 | 8.46 ± 0.82 | −39.09 ± 3.8 |
| 00452143+1634446 | −22.62 ± 1.47 | −14.31 ± 1.21 | −5.02 ± 0.84 | −5.66 ± 0.33 | 9.48 ± 0.55 | −11.54 ± 0.67 |
| 00470038+6803543 | −8.58 ± 1.06 | −27.83 ± 1.22 | −13.53 ± 0.49 | −6.52 ± 0.24 | 10.23 ± 0.37 | 1.1 ± 0.04 |
| 01231125–6921379 | −7.92 ± 1.96 | −20.39 ± 2.71 | −1.82 ± 2.42 | 14.9 ± 2.11 | −27.1 ± 3.84 | −33.76 ± 4.78 |
| 02235464–5815067 | −7.94 ± 0.86 | −18.46 ± 1.19 | −1.11 ± 0.7 | 4.29 ± 0.4 | −20.41 ± 1.88 | −29.71 ± 2.74 |
| 02411151–0326587 | −9.68 ± 4.71 | −11.49 ± 1.49 | −1.39 ± 6.56 | −21.39 ± 2.55 | 1.63 ± 0.19 | −30.27 ± 3.6 |
| 03350208+2342356 | −16.91 ± 1.77 | −11.46 ± 2.11 | −8.08 ± 1.95 | −36.8 ± 2.02 | 10.13 ± 0.55 | −18.31 ± 1 |
| 03393521–3525440 | −13.32 ± 0.35 | −4.95 ± 0.52 | −0.1 ± 0.85 | −2.1 ± 0.01 | −3.19 ± 0.02 | −5.15 ± 0.03 |
| 03552337+1133437 | −5.53 ± 0.4 | −26.32 ± 1.18 | −15.34 ± 0.62 | −7.72 ± 0.3 | 0.25 ± 0.01 | −4.64 ± 0.18 |
| 05012406–0010452 | −15.15 ± 0.83 | −27 ± 1.74 | −1.08 ± 1.07 | −16.76 ± 1.16 | −6.02 ± 0.42 | −8.06 ± 0.56 |
| 05184616–2756457 | −10.99 ± 0.93 | −21.09 ± 1.55 | −8.64 ± 1.37 | −23.81 ± 6.57 | −28.98 ± 8 | −23.02 ± 6.35 |
| 05361998–1920396 | −10.85 ± 1.41 | −18.95 ± 1.83 | −7.49 ± 1.06 | -24 ± 7.34 | −22.27 ± 6.81 | −15.21 ± 4.65 |
| 05575096–1359503 | −22.15 ± 7.41 | −18.46 ± 8.29 | −9.3 ± 9.91 | −309.69 ± 83.51 | −257.52 ± 69.45 | −131.51 ± 35.46 |
| 06085283–2753583 | −15.51 ± 0.45 | −19.93 ± 0.34 | −7.79 ± 0.51 | −16.84 ± 1.82 | −23.54 ± 2.54 | −11.12 ± 1.2 |
| 10220489+0200477 | 14.87 ± 4.49 | −53.28 ± 19.96 | −49.14 ± 14.81 | −11.07 ± 3.8 | −20.45 ± 7.02 | 24.35 ± 8.36 |
| 10224821+5825453 | −69.35 ± 2.74 | −67.62 ± 3.48 | 0.1 ± 0.87 | −10.57 ± 0.48 | 5.61 ± 0.26 | 13.98 ± 0.64 |
| TWA26 | −9.02 ± 1.5 | −18.29 ± 1.94 | −3.52 ± 1.42 | 9.92 ± 1.02 | −35.32 ± 3.63 | 19.9 ± 2.04 |
| TWA27A | −7.62 ± 0.94 | −18.24 ± 1.77 | −3.52 ± 1.03 | 19.49 ± 0.41 | −44.22 ± 0.94 | 20.06 ± 0.42 |
| 14252798–3650229 | −5.23 ± 0.21 | −26.29 ± 0.27 | −14.11 ± 0.19 | 8.56 ± 0.08 | −6.42 ± 0.06 | 4.39 ± 0.04 |
| 15525906+2948485 | −9.73 ± 0.88 | −22.44 ± 1.11 | −4.71 ± 0.78 | 8.78 ± 0.47 | 9.7 ± 0.52 | 15.74 ± 0.85 |
| 17260007+1538190 | −8.66 ± 1.05 | −21.01 ± 1.34 | −6.26 ± 1.11 | 24.62 ± 2.4 | 19.25 ± 1.88 | 15.1 ± 1.48 |
| 18212815+1414010 | 12.91 ± 0.12 | 4.62 ± 0.11 | −11.30 ± 0.06 | 6.74 ± 0.01 | 6.17 ± 0.01 | 2.11 ± 0.01 |
| 20575409–0252302 | −12.44 ± 0.45 | −19.97 ± 0.5 | 9.47 ± 0.39 | 8.66 ± 0.45 | 8.9 ± 0.47 | −6.96 ± 0.36 |
| PSO318 | −10.4 ± 0.7 | −16.4 ± 0.6 | −9.8 ± 0.8 | 15.2 ± 0.6 | 7.2 ± 0.3 | −14.6 ± 0.6 |
| 21265040–8140293 | −7.02 ± 1.07 | −18.57 ± 1.09 | −3.67 ± 0.39 | 17.55 ± 1.41 | −20.48 ± 1.64 | −16.95 ± 1.36 |
| 22081363+2921215 | −15.2 ± 0.87 | −18.97 ± 1.83 | −8.76 ± 1.13 | 3.64 ± 0.12 | 43.76 ± 1.4 | −17.14 ± 0.55 |
| 232246843133231 | 40.26 ± 2.74 | −30.87 ± 3.18 | −24.72 ± 1.27 | 5.55 ± 0.51 | 1.46 ± 0.13 | −15.97 ± 1.47 |
Note. Data is only presented for targets with measured parallax, or measured parallax and radial velocity. While the actual uncertainties are best described by a radially oriented ellipsoid, they are given here for comparison to other values.
Download table as: ASCIITypeset image
Table 12. Moving Group Membership Probabilities
| BANYAN II | LACEwING | Convergence | BANYAN I | |||||||||
|---|---|---|---|---|---|---|---|---|---|---|---|---|
| Name | SpT | SpT | Prob. | Contam. | Group | Prob. | Group | Prob. | Group | Prob. | Group | Decision |
| (1) | (2) | (3) | (4) | (5) | (6) | (7) | (8) | (9) | (10) | (11) | (12) | (13) |
| 00011217+1535355 | – – | L4 β | 97.4 | 1.1 | AB DOR | 35.12 | AB DOR | 43.1 | AB DOR | 99.04 | AB DOR | AM |
| 00040288–6410358 | L1 γ | L1 γa | 99.6 | 0 | TUC-HOR | 38.76 | TUC-HOR | 100 | TUC-HOR | 100 | TUC-HOR | HLM |
| 00182834–6703130 | – – | L0 γ | 99.9 | <0.1 | TUC-HOR | 48.71 | TUC-HOR | 76.7 | TUC-HOR | 99.83 | TUC-HOR | AM |
| 00191296–6226005 | – – | L1 γ | 99.7 | <0.1 | TUC-HOR | 0 | NONE | 99.7 | TUC-HOR | 89.44 | TUC-HOR | HLM |
| 00192626+4614078 | M8 – | M8 β | 72 | 13.3 | AB DOR | 66.42 | AB DOR | 99 | AB DOR | 99 | AB DOR | HLM |
| 00274197+0503417 | M9.5 β | L0 βa | 0 | 100 | ARGUS | 0 | NONE | 100 | CHA-NEAR | 100 | OLD | AM |
| 00303013–1450333 | L7 – | L4-L6 β | 26.5 | 2.6 | ARGUS | 29.65 | AB DOR | 98.1 | CHA-NEAR | 97.87 | ARGUS | AM |
| 00325584–4405058 | L0 γ | L0 β | 67.3 | 1 | TUC-HOR | 91.3 | AB DOR | 96 | AB DOR | 100 | AB DOR | HLM |
| 003323.86–152130.9 | L4 β | L1 | 0 | 99.8 | COLUMBA | 0 | NONE | 60 | CHA-NEAR | 100 | OLD | NM |
| 00344300–4102266 | – – | L1 β | 98.7 | <0.1 | TUC-HOR | 41.91 | TUC-HOR | 70.1 | TWHYA | 70.48 | TUC-HOR | AM |
| 00374306–5846229 | L0 γ | – – | 0 | 99.3 | BETA PIC | 0 | NONE | 71 | CHA-NEAR | 100 | OLD | NM |
| 00381489–6403529 | – – | M9.5 β | 99.9 | <0.1 | TUC-HOR | 62.83 | TUC-HOR | 58 | TUC-HOR | 95.91 | TUC-HOR | HLM |
| 00425923+1142104 | – – | M9 β | 19.6 | 53.1 | AB DOR | 0 | NONE | 64.9 | AB DOR | 83.02 | BETA PIC | AM |
| 00452143+1634446 | L2 β | L2 γa | 99.9 | 0.1 | ARGUS | 99.42 | ARGUS | 37 | CHA-NEAR | 100 | ARGUS | BM |
| 00464841+0715177 | M9 β | L0 δ | 31.3 | 48.8 | COLUMBA | 24.44 | AB DOR | 99 | TWHYA | 99 | COLUMBA | AM |
| 00470038+6803543 | L7 (γ?) | L6-L8 γ | 100 | 0.1 | AB DOR | 99.95 | AB DOR | 56 | AB DOR | 100 | AB DOR | BM |
| 00550564+0134365 | L2 γ | L2 γa | 9.2 | 48.3 | BETA PIC | 0 | NONE | 68 | AB DOR | 100 | OLD | NM |
| 00584253–0651239 | L0 – | L1 β | 96.5 | 0.3 | AB DOR | 52.5 | AB DOR | 14.3 | COLUMBA | 91.65 | BETA PIC | AM |
| 01033203+1935361 | L6 β | L6 β | 51.2 | 15.7 | ARGUS | 36.95 | Hyades | 16 | CHA-NEAR | 96 | OLD | AM |
| 01174748–3403258 | L1 β | L1 βa | 98.4 | 0 | TUC-HOR | 30.63 | TUC-HOR | 100 | TUC-HOR | 91 | TUC-HOR | HLM |
| 01205114–5200349 | – – | L1 γ | >99.9 | <0.1 | TUC-HOR | 64.54 | TUC-HOR | 100 | TUC-HOR | 95.18 | TUC-HOR | HLM |
| 01231125–6921379 | M7.5 γ | – – | 100 | 0 | TUC-HOR | 99.97 | TUC-HOR | 100 | TUCHOR | 100 | TUCHOR | BM |
| 01244599–5745379 | L0 γ | L0 γa | 0 | 99.3 | COLUMBA | 0 | NONE | 0 | NONE | 100 | OLD | NM |
| 01262109+1428057 | L4 γ | L2 γ | 0 | 99.9 | BETA PIC | 0 | NONE | 99 | CHA-NEAR | 100 | OLD | AM |
| 01294256–0823580 | M5 – | M7 β | 95.9 | 18.9 | BETA PIC | 0 | NONE | 100 | COLUMBA | 72.46 | COLUMBA | AM |
| 01415823–4633574 | L0 γ | L0 γ | 100 | 0 | TUC-HOR | 99.84 | TUC-HOR | 83.5 | TUC-HOR | 100 | TUC-HOR | HLM |
| 01531463–6744181 | L2 – | L3 β | >99.9 | <0.1 | TUC-HOR | 33.25 | TUC-HOR | 98.8 | TUC-HOR | 99.49 | TUC-HOR | HLM |
| 02103857–3015313 | L0 γ | L0 γa | 99.4 | 0 | TUC-HOR | 96.34 | TUC-HOR | 56 | TUC-HOR | 100 | TUC-HOR | HLM |
| 02212859–6831400 | M8 β | – – | 0.8 | 99.4 | AB DOR | 0 | NONE | 84 | CHA-NEAR | 62 | AB DOR | AM |
| 02215494–5412054 | M9 β | – – | 99.8 | 0 | TUC-HOR | 99.91 | TUC-HOR | 61 | TUC-HOR | 100 | TUC-HOR | HLM |
| 02235464–5815067 | L0 γ | – – | 100 | 0 | TUC-HOR | 99.98 | TUC-HOR | 95 | TUCHOR | 100 | TUCHOR | BM |
| 02251947–5837295 | M9 β | M9γa | 57.5 | 1.2 | BETA PIC | 40.52 | AB DOR | 68 | TUC-HOR | 57 | TUC-HOR | AM |
| 02265658–5327032 | – – | L0 δ | >99.9 | <0.1 | TUC-HOR | 65.9 | TUC-HOR | 43 | TUC-HOR | 77.57 | TUC-HOR | AM |
| 02292794–0053282 | – – | L0 γ | 79.8 | 1.3 | BETA PIC | 81.02 | AB DOR | 96 | AB DOR | 100 | OLD | AM |
| 02340093–6442068 | L0 γ | L0β γa | 100 | 0 | TUC-HOR | 99.56 | TUC-HOR | 80 | TUC-HOR | 100 | TUC-HOR | HLM |
| 02410564–5511466 | – – | L1 γ | >99.9 | <0.1 | TUC-HOR | 71.24 | TUC-HOR | 99.9 | TUC-HOR | 95.36 | TUC-HOR | HLM |
| 02411151–0326587 | L0 γ | L1 γ | 48.5 | 0 | TUC-HOR | 0 | NONE | 35 | CHA-NEAR | 90 | OLD | AM |
| 02501167–0151295 | – – | M7 β | 92.9 | 1.1 | BETA PIC | 0 | NONE | 98.8 | TUC-HOR | 67.1 | OLD | AM |
| 02530084+1652532 | – – | M7 β | ... | ... | FIELD | 0 | NONE | 0 | NONE | 100 | OLD | NM |
| 02535980+3206373 | M7 β | M6 β | 57.8 | 26.5 | BETA PIC | 20.61 | AB DOR | 100 | BETA PIC | 97 | BETA PIC | AM |
| 02583123–1520536 | – – | L3 β | 88.9 | <0.1 | TUC-HOR | 0 | NONE | 77.4 | AB DOR | 49.82 | BETA PIC | AM |
| 03032042–7312300 | L2 γ | – – | 40.7 | 0 | TUC-HOR | 31.44 | TUC-HOR | 98 | TUC-HOR | 87 | OLD | AM |
| 03164512–2848521 | L0 – | L1 β | 96.9 | 3.2 | AB DOR | 50.99 | TUC-HOR | 99.8 | AB DOR | 99.25 | AB DOR | AM |
| 03231002–4631237 | L0 γ | L0 γa | 99.7 | 0 | TUC-HOR | 73.08 | TUC-HOR | 92 | TUC-HOR | 100 | TUC-HOR | HLM |
| 03264225–2102057 | L5 β | L5 βγa | 99.4 | 1 | AB DOR | 44.89 | AB DOR | 66 | AB DOR | 99 | AB DOR | HLM |
| 03350208+2342356 | M8.5 – | M7.5 β | 76.2 | 4.9 | BETA PIC | 32.48 | ARGUS | 98 | COLUMBA | 79 | OLD | AM |
| 03393521–3525440 | M9 β | L0 β | 40.2 | 0.2 | ARGUS | 43.82 | COMA BER | 0 | NONE | 100 | OLD | AM |
| 03420931–2904317 | – – | L0 β | 99.7 | <0.1 | TUC-HOR | 27.86 | TUC-HOR | 96.5 | TUC-HOR | 51.92 | COLUMBA | AM |
| 03421621–6817321 | L4γ | – – | 99.8 | <0.1 | TUC-HOR | 28.33 | TUC-HOR | 99.7 | TUC-HOR | 98.71 | TUC-HOR | HLM |
| 03550477–1032415 | M8.5 – | M8.5 β | 93.8 | <0.1 | TUC-HOR | 0 | NONE | 99.9 | TWHYA | 93.24 | COLUMBA | AM |
| 03552337+1133437 | L5 γ | L3-L6 γ | 99.6 | 1.1 | AB DOR | 100 | AB DOR | 18 | AB DOR | 100 | AB DOR | BM |
| 03572695–4417305c | L0 β | L0 β | 99.2 | 0 | TUC-HOR | 54.84 | TUC-HOR | 62 | TUC-HOR | 53 | TUC-HOR | AM |
| 04062677–3812102 | L0 γ | L1 γ | 0.3 | 79.6 | COLUMBA | 41.07 | Octans | 75 | CHA-NEAR | 100 | OLD | AM |
| 04185879–4507413 | – – | L3 γ | 92.7 | <0.1 | TUC-HOR | 28.97 | AB DOR | 91.6 | AB DOR | 64.9 | AB DOR | AM |
| 04210718–6306022 | L5 β | L5 γa | 99.5 | 2.4 | BETA PIC | 52.74 | TUC-HOR | 96 | BETA PIC | 99 | BETA PIC | AM |
| 04351455–1414468 | M8 γ | M7 γa | 0.5 | 93.8 | BETA PIC | 0 | NONE | 89 | CHA-NEAR | 100 | OLD | NM |
| 04362788–4114465 | M8 β | M9 γ | 99 | 0 | TUC-HOR | 87.97 | TUC-HOR | 87 | TUC-HOR | 100 | TUC-HOR | HLM |
| 04400972–5126544 | – – | L0 γ | 86.7 | <0.1 | TUC-HOR | 27.19 | AB DOR | 99.8 | AB DOR | 72.25 | AB DOR | AM |
| 04433761+0002051c | M9 γ | M9 γ | 99.7 | 3.4 | BETA PIC | 59.73 | AB DOR | 96 | AB DOR | 79 | BETA PIC | AM |
| 04493288+1607226 | – – | M9 γ | 1.6 | 98.2 | BETA PIC | 0 | NONE | 99.9 | TWHYA | 82.24 | BETA PIC | AM |
| 05012406–0010452 | L4 γ | L3 γa | 20.8 | 0.4 | COLUMBA | 82.87 | AB DOR | 99 | TUC-HOR | 100 | OLD | AM |
| 05104958–1843548 | – – | L2 β | 68.6 | 6.6 | COLUMBA | 23.73 | TUC-HOR | 89.6 | TWHYA | 87.1 | COLUMBA | AM |
| 05120636–2949540 | L5 γ | L5βa | 53.1 | 1 | BETA PIC | 0 | NONE | 6 | CHA-NEAR | 88 | OLD | AM |
| 05181131–3101529 | M6.5 – | M7 β | 96.2 | 8.8 | COLUMBA | 0 | NONE | 90.4 | COLUMBA | 91.23 | COLUMBA | AM |
| 05184616–2756457 | L1 γ | L1 γ | 99.4 | 0.1 | COLUMBA | 74.91 | COLUMBA | 13 | COLUMBA | 87 | COLUMBA | BM |
| 05264316–1824315 | – – | M7 β | 93.5 | 12.8 | COLUMBA | 0 | NONE | 83.1 | COLUMBA | 88.66 | COLUMBA | AM |
| 05341594–0631397 | M8 γ | M8 γ | 0 | 99.8 | COLUMBA | 0 | NONE | 100 | BETA PIC | 99 | OLD | AM |
| 05361998–1920396 | L2 γ | L2 γa | 99.2 | 0.1 | COLUMBA | 35.23 | COLUMBA | 78 | BETA PIC | 57 | BETA PIC | AM |
| 05402325–0906326 | – – | M9 β | 72 | 16.1 | COLUMBA | 0 | NONE | 95 | TUC-HOR | 87.3 | COLUMBA | AM |
| 05575096–1359503 | M7 – | M7 γ | 36.4 | 0 | TWHYA | 0 | NONE | 99 | TWHYA | 76 | TWHYA | AM |
| 06023045+3910592 | L1 – | L1 β | 2.4 | 0.8 | AB DOR | 46.33 | AB DOR | 37 | COLUMBA | 98 | OLD | AM |
| 06085283–2753583 | M8.5 γ | L0 γ | 0 | 100 | BETA PIC | 0 | NONE | 94 | CHA-NEAR | 49 | BETA PIC | AM |
| 06272161–5308428 | – – | L0 β γ | 87.2 | 9.1 | CARINA | 37.72 | AB DOR | 90.5 | CHA-NEAR | 84.7 | COLUMBA | AM |
| 06322402–5010349 | L3 β | L4 γ | 29.5 | 76.7 | AB DOR | 41.77 | AB DOR | NONE | 94.89 | NONE | AM | |
| 06524851–5741376 | M8 β | – – | 2.9 | 85.4 | AB DOR | 0 | NONE | 98 | CHA-NEAR | 98 | AB DOR | AM |
| 07123786–6155528 | L1 β | L1 γa | 78.7 | 37.6 | BETA PIC | 39.12 | AB DOR | 78 | BETA PIC | 58 | BETA PIC | AM |
| 07140394+3702459 | M8 – | M7.5 β | 88.9 | 0.5 | ARGUS | 0 | NONE | 10.9 | CHA-NEAR | 87.35 | ARGUS | AM |
| 08095903+4434216 | – – | L6p | 80.7 | 27.4 | ARGUS | 21.49 | AB DOR | 15.7 | CHA-NEAR | 92.79 | ARGUS | AM |
| 08561384–1342242 | – – | M8 γ | 4.9 | <0.1 | TWHYA | 0 | NONE | 78.8 | TWHYA | 95.92 | OLD | AM |
| 08575849+5708514 | L8 – | L8 – | ... | ... | FIELD | 30.21 | HER-LYRr | 4.7 | CHA-NEAR | 93.98 | ARGUS | AM |
| 09451445–7753150 | – – | M9 β | 90.4 | 2.8 | CARINA | 41.86 | Octans | 88.3 | CHA-NEAR | 67.56 | OLD | AM |
| 09532126–1014205 | M9 γ | M9 βa | 28.7 | 0 | TWHYA | 87.4 | COMA BER | 69 | TUC-HOR | 76 | OLD | AM |
| 09593276+4523309 | – – | L3 γ | 2.1 | 0.3 | TWHYA | 0 | NONE | 92 | AB DOR | 69 | OLD | NM |
| G196-3B | L3 β | L3 γ | 41 | 23.3 | AB DOR | 20.19 | AB DOR | 42 | COLUMBA | 95 | AB DOR | AM |
| 10212570–2830427 | – – | L4 β γ | 92.4 | <0.1 | TWHYA | 0 | NONE | 97.2 | AB DOR | 99.3 | TWHYA | AM |
| 10220489+0200477 | M9 β | M9 β | 2.6 | 6.1 | AB DOR | 0 | NONE | 0 | NONE | 100 | OLD | NM |
| 10224821+5825453 | L1 β | L1 β | 0 | 99.9 | AB DOR | 0 | NONE | 14 | AB DOR | 100 | OLD | NM |
| TWA 28 | M8.5 γ | M9 γa | 99.9 | 0 | TWHYA | 100 | TWHYA | 97 | TWHYA | 100 | TWHYA | HLM |
| 11064461–3715115 | – – | M9 γ | 94.6 | <0.1 | TWHYA | 0 | NONE | 99.5 | COLUMBA | 99.85 | TWHYA | AM |
| 11083081+6830169 | L1 γ | L1 γ | 6 | 89.9 | CARINA | 25.05 | AB DOR | 77.6 | COLUMBA | 96.63 | AB DOR | AM |
| 11193254–1137466 | – – | L7γ | 92 | 0.0005 | TWHYA | 16 | TWHYA | 90.4 | TWHYA | 95.87 | TWHYA | HLM |
| 11271382–3735076 | – – | L0 δ | 92.5 | <0.1 | TWHYA | 0 | NONE | 99.7 | CHA-NEAR | 99.39 | TWHYA | AM |
| TWA26 | M9 γ | M9 γ | 100 | 0 | TWHYA | 100 | TWHYA | 98 | TWHYA | 100 | TWHYA | BM |
| 114724.10–204021.3 | – – | L7γ | 91.2 | <0.1 | TWHYA | 19 | TWHYA | 90 | TWHYA | 98 | TWHYA | HLM |
| 11480096–2836488 | – – | L1 β | 68.9 | <0.1 | TWHYA | 91.53 | TWHYA | 91 | TWHYA | 99.93 | TWHYA | AM |
| 11544223–3400390 | L0 β | L1 βa | 91 | 0.6 | ARGUS | 76.31 | TWHYA | 99 | CHA-NEAR | 98 | ARGUS | AM |
| TWA27A | M8 γ | M8 γ | 100 | 0 | TWHYA | 100 | TWHYA | 97 | TWHYA | 100 | TWHYA | BM |
| 12074836–3900043 | L0 γ | L1 γ | 99.6 | 0 | TWHYA | 99.72 | TWHYA | 92 | TWHYA | 100 | TWHYA | HLM |
| 12271545–0636458 | M9 – | M8.5 β | 1.5 | 0.6 | TWHYA | 0 | NONE | 100 | COLUMBA | 72.62 | TWHYA | AM |
| TWA29 | M9.5 γ | L0 γ | 91.6 | 0 | TWHYA | 76.86 | TWHYA | 99 | TWHYA | 95 | TWHYA | HLM |
| 12474428–3816464 | – – | M9 γ | 36.4 | 0 | TWHYA | 0 | NONE | 99 | TWHYA | 76 | TWHYA | AM |
| 12535039–4211215 | – – | M9.5 γ | 59.3 | 0 | TWHYA | 0 | NONE | 97.2 | COLUMBA | 86.18 | TWHYA | AM |
| 12563961–2718455 | – – | L4 βa | 15.9 | <0.1 | TWHYA | 58.05 | TWHYA | 75.8 | AB DOR | 99.14 | TWHYA | AM |
| 14112131–2119503 | M9 β | M8 βa | 0.1 | 27.8 | TWHYA | 65.16 | TWHYA | 86 | BETA PIC | 83 | TWHYA | AM |
| 14252798–3650229 | L3 – | L4 γ | 99.9 | 0.1 | AB DOR | 99.99 | AB DOR | 39 | AB DOR | 100 | AB DOR | BM |
| 15104786–2818174 | M9 – | M9 β | 59.1 | 60.2 | ARGUS | 0 | NONE | 99.1 | CHA-NEAR | 90.45 | ARGUS | AM |
| 15291017+6312539 | – – | M8 β | 24.6 | 79.2 | AB DOR | 0 | NONE | 81.4 | AB DOR | 93.16 | AB DOR | AM |
| 15382417–1953116 | L4 γ | L4 γa | 0 | 100 | BETA PIC | 0 | NONE | 0 | NONE | 100 | OLD | NM |
| 15470557–1626303A | – – | M9 β | 10.6 | 63.4 | AB DOR | 0 | NONE | 97.1 | AB DOR | 78.03 | AB DOR | AM |
| 15474719–2423493 | M9 γ | L0 β | 0 | 98.8 | BETA PIC | 34.23 | AB DOR | 17 | TUC-HOR | 97 | OLD | NM |
| 15515237+0941148 | L4 γ | >L5 γa | 0.1 | 99.1 | AB DOR | 94.65 | COMA BER | 100 | BETA PIC | 93 | OLD | AM |
| 15525906+2948485 | L0 β | L0 β | 0 | 92.7 | AB DOR | 21.95 | HER-LYRr | 19 | TUC-HOR | 80 | OLD | AM |
| 15575011–2952431 | M9 δ | L1 γa | 0 | 100 | BETA PIC | 0 | NONE | 100 | AB DOR | 100 | OLD | NM |
| 16154255+4953211 | L4 γ | L3-L6 γ | 13.7 | 69 | AB DOR | 31.82 | AB DOR | 92 | COLUMBA | 63 | AB DOR | AM |
| 17111353+2326333 | L0 γ | L1βa | 0 | 100 | BETA PIC | 0 | NONE | 94 | BETA PIC | 96 | BETA PIC | NM |
| 17260007+1538190 | L3.5 γ | L3 γa | 0 | 99.8 | AB DOR | 0 | NONE | 65 | BETA PIC | 80 | OLD | NM |
| 17410280–4642218 | – – | L6-L8 γa | 99.7 | 1.8 | BETA PIC | 78.78 | ARGUS | 94 | BETA PIC | 100 | BETA PIC | AM |
| 18212815+1414010 | L4.5– | L4 peca | 0 | 100 | NONE | 0 | NONE | 0 | NONE | 100 | OLD | NM |
| 19350976–6200473 | – – | L1 γ | 20.8 | 0.2 | TUC-HOR | 0 | NONE | 100 | TUC-HOR | 97.32 | TUC-HOR | AM |
| 19355595–2846343 | M9 γ | M9 γa | 25.3 | 12.6 | ARGUS | 0 | NONE | 100 | CHA-NEAR | 93 | OLD | AM |
| 19564700–7542270 | L0 γ | L2 γa | 53.3 | 0 | TUC-HOR | 26.8 | TUC-HOR | 97 | COLUMBA | 97 | TUC-HOR | AM |
| 20004841–7523070 | M9 γ | M9 γa | 99.4 | 3.5 | BETA PIC | 84.05 | TUC-HOR | 71 | BETA PIC | 100 | BETA PIC | HLM |
| 20025073–0521524 | L5 β | L5-L7 γa | 0 | 47.8 | BETA PIC | 0 | NONE | 0 | NONE | 100 | OLD | NM |
| 20113196–5048112 | – – | L3 γ | 42.6 | <0.1 | TUC-HOR | 0 | NONE | 96.5 | COLUMBA | 66.53 | TUC-HOR | AM |
| 20135152–2806020 | M9 γ | L0 γa | 77.6 | 39.5 | BETA PIC | 28.94 | BETA PIC | 100 | BETA PIC | 100 | BETA PIC | AM |
| 20282203–5637024 | – – | M8.5 γ | 44.3 | <0.1 | TUC-HOR | 0 | NONE | 94.6 | AB DOR | 69.85 | TUC-HOR | AM |
| 20334473–5635338 | – – | L0 γ | 93.4 | <0.1 | TUC-HOR | 0 | NONE | 81.7 | TUC-HOR | 99.85 | TUC-HOR | AM |
| 20391314–1126531 | M8 – | M7 β | 2.2 | 46.6 | AB DOR | 0 | NONE | 100 | COLUMBA | 71.24 | AB DOR | AM |
| 20575409–0252302 | L1.5 – | L2 β | 0 | 100 | TUC-HOR | 0 | NONE | 0 | NONE | 100 | OLD | NM |
| PSO318 | – – | L6-L8 γa | 99.7 | 0.1 | BETA PIC | 60.77 | ARGUS | 99 | BETA PIC | 100 | BETA PIC | BM |
| 21265040–8140293b | L3 γ | L3 γa | 9.3 | 1.4 | BETA PIC | 76.51 | BETA PIC | 26 | CHA-NEAR | 94 | TUC-HOR | AM |
| 21324036+1029494 | – – | L4 β | 30.8 | 61.6 | ARGUS | 0 | NONE | 92.8 | CHA-NEAR | 53.44 | ARGUS | AM |
| 21543454–1055308 | L4 β | L5 γa | 16.3 | 5.6 | ARGUS | 0 | NONE | 29 | CHA-NEAR | 70 | ARGUS | AM |
| 21544859–7459134 | – – | M9.5 β | 99.4 | <0.1 | TUC-HOR | 44.34 | TUC-HOR | 100 | TUC-HOR | 99.94 | TUC-HOR | HLM |
| 21572060+8340575 | L0 – | M9 γ | 30.8 | 62.9 | AB DOR | 0 | NONE | 63.3 | AB DOR | 84 | AB DOR | AM |
| 22025794–5605087 | – – | M9 γ | 98.4 | <0.1 | TUC-HOR | 32.49 | TUC-HOR | 41.7 | TUC-HOR | 98.75 | TUC-HOR | AM |
| 22064498–4217208 | L4 γ | L4 γa | 99.1 | 1.4 | AB DOR | 41.75 | AB DOR | 89 | AB DOR | 96 | AB DOR | HLM |
| 22081363+2921215 | L3 γ | L3 γ | 0.2 | 91.2 | BETA PIC | 0 | NONE | 99 | TWHYA | 66 | BETA PIC | NM |
| 22134491–2136079 | L0 γ | L0 γ | 35.4 | 45.8 | BETA PIC | 0 | NONE | 100 | COLUMBA | 72 | BETA PIC | AM |
| 22351658–3844154 | – – | L1.5 γ | 96.2 | <0.1 | TUC-HOR | 20.7 | TUC-HOR | 93.6 | TUC-HOR | 94.01 | TUC-HOR | HLM |
| 22353560–5906306 | – – | M8.5 β | 99.8 | <0.1 | TUC-HOR | 50.74 | TUC-HOR | 99.7 | TUC-HOR | 99.95 | TUC-HOR | HLM |
| 22443167+2043433 | L6.5p – | L6-L8 γa | 99.4 | 0.5 | AB DOR | 38.38 | AB DOR | 69 | AB DOR | 99 | AB DOR | HLM |
| 22495345+0044046 | L4 γ | L3 βa | 0.2 | 96.1 | ARGUS | 0 | NONE | 61 | CHA-NEAR | 100 | OLD | NM |
| 23153135+0617146 | L0 γ | L0 γa | 0 | 99.6 | COLUMBA | 0 | NONE | 92 | COLUMBA | 100 | OLD | NM |
| 23224684–3133231 | L0 β | L2 β | 0 | 54.5 | AB DOR | 0 | NONE | 0 | NONE | 100 | OLD | NM |
| 23225299–6151275 | L2 γ | L3γa | 99.9 | 0 | TUC-HOR | 98.88 | TUC-HOR | 34 | TUC-HOR | 100 | TUC-HOR | HLM |
| 23231347–0244360 | M8.5 – | M8 β | 30.6 | 54.4 | BETA PIC | 0 | NONE | 99.9 | TWHYA | 55.28 | OLD | AM |
| 23255604–0259508 | L3 – | L1 γ | 73.4 | 12.3 | AB DOR | 21.28 | AB DOR | 91.2 | AB DOR | 98.5 | AB DOR | AM |
| 23360735–3541489 | – – | M9 β | 50.8 | 30.3 | AB DOR | 30.17 | TUC-HOR | 74.5 | AB DOR | 60.89 | TUC-HOR | AM |
| 23433470–3646021 | – – | L3-L6 γ | 68.9 | 4.8 | AB DOR | 38.46 | TUC-HOR | 65.9 | AB DOR | 56.17 | TUC-HOR | AM |
| 23453903+0055137 | M9 – | M9 β | ... | ... | FIELD | 0 | NONE | 99.6 | BETA PIC | 40.39 | COLUMBA | AM |
| 23520507–1100435 | M7 – | M8 β | 90.6 | 4 | AB DOR | 27.22 | AB DOR | 57.2 | AB DOR | 97.85 | AB DOR | AM |
Notes. Computations of BANYAN I and II were done with the web calculator, without photometric data. BANYAN II and LACEwING were computed assuming the objects are young. The predicted distance and RV (as predicted by LACEwING for the final group) should be compared to the values in Table 10.
A spectral type with a ? indicates questionable or extremely uncertain gravity features.
aThese sources have new infrared spectra presented in this paper. In the majority of cases, we use the infrared spectral type and gravity classification diagnosed in this work. If an object had SpeX data, then we default to the resultant type and classification with that data. bDeacon et al. (2016) use the parallax reported in this work to show that this source is co-moving with the M dwarf TYC 9486-927-1. In that work, they report a likelihood of membership in the β pictoris moving group, however, we find this to be unlikely with the given kinematics. The membership of this interesting wide system remains unknown. cThese sources were listed in Filippazzo et al. (2015) as members of associations, but as has been noted in Table 12, we have downgraded them to ambiguos young objects. dThe source 0335+2342 is listed as a bona fide member of β Pictoris in Gagné et al. (2014c) using a 2MASS to WISE proper motion. Aside from the Shkolnik et al. (2012) proper motion used in this work, this source also has a PPMXL proper motion. Depending on which value is used in the kinematic analysis, the probability of membership varies. Based on its position on the various photometric and absolute magnitude diagrams in this work, we suspect this source is a β Pictoris member. However, refined kinematics will confirm this. Furthermore, Allers & Liu (2013) list this object as an M7 VLG source, however, we have chosen to list it as an M7.5 β based on the analysis in Gagné et al. (2014c).6.2. Partial Kinematic Sample
Having only partial kinematics for 124 objects limits our ability to definitively place these targets in a nearby group. As stated above, the BANYAN I/II, Convergent Point, and LACEwING methods use varying techniques to yield membership probabilities. We list the outcomes of assessing the likelihood of membership for each source in Table 12. As can be seen from this tabulation, the results varied across methods. In the case of an object like 2322–6151, all of the methods yield a probability of membership in the Tucana Horologium moving group with 3 of the 4 yielding >90% membership. The most difficult cases were objects like 1154–3400, where each method yielded a moderate to high probability in a different group (Banyan I and Banyan II both predict Argus, LACEwING predicts TW Hydrae, and Convergent point predicts Chameleon-near). Our approach to the analysis was to be conservative with group membership to eliminate assigning objects to groups that were uncertain. In all, we concluded that there were 28 objects to be regarded as HLMs of a known group, 83 objects that were ambiguous (AM), and 13 objects that were NMs. Adding the full kinematic sample, the final tally is 28 HLMs, 11 bona fide group members (BM), 92 ambiguous (AM), and 21 NMs.
6.3. Comparison with Previous Works
Among the 152 brown dwarfs examined in this work, 11 are newly identified as low gravity and 141 have been previously discussed in the literature for membership in a nearby moving group (e.g., Gagné et al. 2015b, 2015c). Several of the objects (2M0355, PSO318, 0047 + 6803, 1741–4642, 2154–1055, 0608–2753) have been the subject of single-object papers (Rice et al. 2010; Faherty et al. 2013; Liu et al. 2013; Gagné et al. 2014a, 2014b; Schneider et al. 2014). The remaining 129 objects were examined for membership in a nearby group primarily by Gagné et al. (2014c, hereafter G14) and Gagné et al. (2015b, hereafter G15) using BANYAN II.
There are 69 objects from our sample included in G14, 73 objects in G15, and 6 in both. In G14, there is a hierarchical probability structure that categorizes potential members as: (1) Bona fide, (2) High probability, (3) Moderate probability and, (4) Low Probability.18 That structure is not used in G15, but replaced by noting the probability of membership in a group (multiple groups if deemed necessary) along with its contamination potential.
Of the 69 objects from our sample examined in G14, three objects—2M0355, 2M0123, and TWA 26—were declared BMs of AB Doradus, Tucana Horologium, and TW Hydrae, respectively. A further 29 objects were deemed high probability members of Argus (2), AB Doradus (5), β Pictoris (4), Columba (4), and Tucana Horologium (14). Ten objects were deemed modest probability members of AB Doradus (3), β Pictoris (3), Columba (1), Argus (1), and Tucana Horologium (2). Eight objects were deemed low probability members of Argus (1), AB Doradus (1), β Pictoris (4), and TW Hydrae (2). There were also 16 objects designated as young field sources (also known as "no group membership possible") and 3 objects designated as peripheral members or contaminants in a group.
In Table 12, we use our new kinematics and show the predictions from BANYAN I, BANYAN II, and LACEwING, the convergent point, and our plurality decision based on reviewing the results from all four methods with updated astrometric measurements for many of the sources. For the G14 overlap, we agree with 2M0355, 2M0123, and TWA 26 being considered BMs. Among the high-likelihood sample from G14 we add a new radial velocity, parallax, and/or proper motion to 19 of the 29 objects and confirm 11 objects as HLMs and demote 5 objects to ambiguous or non-member. Our re-evaluation of the kinematics also leads us to demote 3 objects to AMs rather than considering them high-likelihood sources in a given group. Among the moderate and low probability objects in G14, we add new kinematics to 8 objects and find 5 remain ambiguous and 3 are demoted to NMs. Our re-evaluation of the kinematics finds that 15 of the low- or moderate-probability sources are ambiguous, and therefore we cannot say anything about membership. The remaining 19 sources that were young field, periphery, or contaminants in G14 are ambiguous or non-members in our analysis.
For the 67 objects in G15, we add three new kinematic points. One object is deemed high likelihood while the other two are ambiguous. Otherwise, our re-evaluation of the kinematics leads us to classify 13 objects as HLMs of groups while the remaining 54 are ambiguous (52) or NMs (2).
In all, we find that when the Bayesian II analysis predictions find that group members have a high likelihood of membership in a single group (>99%) while yielding a contamination probability of <1%, the various kinematic methods are consistent in their predictions and we take this to mean that the source is a reliable member.
7. DIVERSITY OF YOUNG BROWN DWARFS
Each one of these moving group members is a possible benchmark for examining the evolutionary properties of the brown dwarf and directly imaged exoplanet populations. In this section, we evaluate the homogeneity and diversity of the sample as a whole as well as the subsamples from each moving group.
7.1. Do Gravity Classifications Correspond With Age?
In total, there are 51 optically classified γ objects (80 infrared classified equivalents) as well as 27 optically classified β objects (57 infrared equivalents). We confirm 20 (28) of the γ objects and 5 (7) of the β objects, respectively, as high confidence or BMs of moving groups. There are an additional 19 (44) γ objects and 17 (41) β objects regarded as AMs to a known group, and 12 (10) γ objects and 5 (8) β objects found to be NMs. As stated in Section 2, γ classified sources have spectral features indicating that they are a lower surface gravity than the β classified objects. Furthermore, β classified sources are subtly but distinctly different from the field sample, indicating (as noted in Allers & Liu 2013 and Cruz et al. 2009) that they are also younger, but not to the extent of the γ objects. The age-calibrated sample allows us to test how well gravity features trace the age of an object.
In Table 13, we list the new members of each group as well as their optical and/or near-infrared spectral and gravity classification. As stated in Section 6.1, nine bona fide objects have full kinematics. For the 28 sources missing a radial velocity or parallax but regarded as high confidence members to a group, we list the kinematically predicted radial velocity and/or parallax from BANYAN II—checked to be consistent with LACEwING predictions—in parentheses in Table 13.
Table 13. High Confidence Moving Group Members
| 2MASS | SpT | SpT | μR.A. | μdecl. | πa | RV | LBol | Teff | Massa | References |
|---|---|---|---|---|---|---|---|---|---|---|
| OpT | NIR | '' yr−1 | '' yr−1 | mas | km s−1 | |||||
| (1) | (2) | (3) | (4) | (5) | (6) | (7) | (8) | |||
| AB DORADUS | ||||||||||
| 00192626+4614078 | M8 – | M8 β | 0.14000 ± 0.06 | −0.1 ± 0.05 | (31 ± 3) | −19.5 ± 2 | −2.773 ± 0.129 | 2637.0 ± 371.0 | 66.62 ± 48.99 | 2, 4 |
| 00325584–4405058 | L0 γ | L0 β | 0.12830 ± 0.0034 | −0.0934 ± 0.003 | 21.6 ± 7.2 | 12.95 ± 1.92 | −3.388 ± 0.289 | 2066.0 ± 413.0 | 41.64 ± 29.47 | 1, 5 |
| 00470038+6803543 | L7 (γ?) | L6-L8 γ | 0.38700 ± 0.004 | −0.197 ± 0.004 | 82 ± 3 | -20 ± 1.4 | −4.429 ± 0.033 | 1230.0 ± 27.0 | 11.84 ± 2.63 | 7 |
| 03264225–2102057 | L5 β | L5βγa | 0.108 ± 0.014 | −0.146 ± 0.015 | (41 ± 1) | (22.91 ± 2.07) | −4.235 ± 0.022 | 1346.0 ± 26.0 | 13.77 ± 2.6 | 1, 2 |
| 03552337+1133437 | L5 γ | L3-L6 γ | 0.22500 ± 0.0132 | −0.63 ± 0.015 | 110.8 ± 4.3 | 11.92 ± 0.22 | −4.104 ± 0.034 | 1478.0 ± 58.0 | 21.62 ± 6.14 | 6, 14 |
| 14252798–3650229 | L3 – | L4γ | −0.28489 ± 0.0014 | −0.46308 ± 0.001 | 86.45 ± 0.83 | 5.37 ± 0.25 | −4.038 ± 0.009 | 1535.0 ± 53.0 | 22.52 ± 6.07 | 13, 14 |
| 22064498–4217208 | L4 γ | L4 γa | 0.128 ± 0.013 | −0.181 ± 0.008 | (35 ± 2) | (7.6 ± 2.0) | −3.997 ± 0.009 | 1566.0 ± 59.0 | 23.15 ± 6.37 | 1 |
| 22443167+2043433 | L6.5p – | L6-L8 γa | 0.252 ± 0.014 | −0.214 ± 0.011 | (54 ± 4) | (−15.5 ± 1.7) | −4.503 ± 0.007 | 1184.0 ± 10.0 | 10.46 ± 1.49 | 1, 2 |
| ARGUS | ||||||||||
| 00452143+1634446 | L2 β | L2 γa | 0.35500 ± 0.01 | −0.04 ± 0.01 | 62.5 ± 3.7 | 3.16 ± 0.83 | −3.405 ± 0.031 | 2059.0 ± 45.0 | 24.98 ± 4.62 | 1 |
| β Pictoris | ||||||||||
| 20004841–7523070 | M9 γ | M9 γa | 0.069 ± 0.012 | −0.11 ± 0.004 | (31 ± 1) | 4.397 ± 2.842 | −2.972 ± 0.028 | 2375.0 ± 74.0 | 24.28 ± 5.63 | 1 |
| PSO318 | – – | L6-L8 γa | 0.13730 ± 0.0013 | −0.1387 ± 0.0014 | 40.7 ± 2.4 | −6.0 |
−4.39 ± 0.052 | 1213.0 ± 38.0 | 6.44 ± 1.29 | 21 |
| COLUMBA | ||||||||||
| 05184616–2756457 | L1 γ | L1 γ | 0.02860 ± 0.0042 | −0.016 ± 0.004 | 21.4 ± 6.9 | 24.35 ± 0.19 | −3.575 ± 0.28 | 1808.0 ± 301.0 | 19.94 ± 9.23 | 1, 8 |
| TUCANA HOROLOGIUM | ||||||||||
| 00040288–6410358 | L1 γ | L1 γa | 0.064 ± 0.012 | −0.047 ± 0.012 | (17 ± 1) | (6.07 ± 2.89) | −3.48 ± 0.051 | 1904.0 ± 63.0 | 16.11 ± 2.9 | 1 |
| 00191296–6226005 | – – | L1 γ | 0.0541 ± 0.0047 | −0.0345 ± 0.0121 | (21 ± 6) | (6.7 ± 2.5) | −3.644 ± 0.248 | 1755.0 ± 258.0 | 14.88 ± 4.52 | 1, 10 |
| 00381489–6403529 | – – | M9.5 β | 0.0871 ± 0.0038 | −0.0353 ± 0.0105 | (23 ± 5) | (7.27 ± 2.81) | −3.423 ± 0.189 | 1957.0 ± 226.0 | 22.03 ± 9.39 | 1, 10 |
| 01174748–3403258 | L1 β | L1 βa | 0.084 ± 0.015 | −0.045 ± 0.008 | (20 ± 3) | (3.96 ± 2.09) | −3.477 ± 0.13 | 1902.0 ± 152.0 | 16.36 ± 3.69 | 1 |
| 01205114–5200349 | – – | L1 γ | 0.0921 ± 0.0058 | −0.0404 ± 0.0102 | (24 ± 4) | (7.22 ± 2.5) | −3.737 ± 0.145 | 1685.0 ± 145.0 | 13.97 ± 3.51 | 1, 10 |
| 01231125–6921379 | M7.5 γ | – – | 0.08278 ± 0.00174 | −0.02646 ± 0.00139 | 21.6 ± 3.3 | 10.9 ± 3 | −2.525 ± 0.133 | 2743.0 ± 317.0 | 55.56 ± 33.21 | 4, 9 |
| 01415823–4633574 | L0 γ | L0 γ | 0.105 ± 0.01 | −0.049 ± 0.01 | (25 ± 3) | 6.409 ± 1.56 | −3.485 ± 0.104 | 1899.0 ± 123.0 | 16.2 ± 3.4 | 1 |
| 01531463–6744181 | L2 – | L3 β | 0.071 ± 0.0037 | −0.0166 ± 0.0127 | (21 ± 7) | (10.41 ± 2.71) | −3.91 ± 0.29 | 1545.0 ± 264.0 | 11.89 ± 5.36 | 1, 10 |
| 02103857–3015313 | L0 γ | L0 γa | 0.145 ± 0.036 | −0.04 ± 0.007 | (32 ± 8) | 7.82 ± 0.274 | −3.826 ± 0.217 | 1610.0 ± 207.0 | 13.03 ± 4.31 | 1 |
| 02215494–5412054 | M9 β | – – | 0.136 ± 0.01 | −0.01 ± 0.017 | (31 ± 5) | 10.18 ± 0.097 | – | – | – | 1, 2 |
| 02235464–5815067 | L0 γ | – – | 0.09860 ± 0.0008 | −0.0182 ± 0.0009 | 27.4 ± 2.6 | 10.36 ± 0.23 | −3.509 ± 0.082 | 1879.0 ± 98.0 | 15.91 ± 3.12 | 1 |
| 02340093–6442068 | L0 γ | L0β γ | 0.088 ± 0.012 | −0.015 ± 0.012 | (21 ± 5) | 11.762 ± 0.721 | −3.538 ± 0.207 | 1848.0 ± 229.0 | 15.97 ± 4.29 | 1 |
| 02410564–5511466 | – – | L1 γ | 0.0965 ± 0.0052 | −0.0123 ± 0.0106 | (24 ± 4) | (11.73 ± 2.44) | −3.679 ± 0.145 | 1731.0 ± 151.0 | 14.49 ± 3.49 | 1, 10 |
| 03231002–4631237 | L0 γ | L0 γa | 0.066 ± 0.008 | 0.001 ± 0.016 | (17 ± 3) | 13.001 ± 0.045 | −3.348 ± 0.153 | 2031.0 ± 201.0 | 23.17 ± 9.75 | 1 |
| 03421621–6817321 | L4 γ | – – | 0.0653 ± 0.0028 | 0.0185 ± 0.0091 | (21 ± 9) | (13.87 ± 2.62) | −3.848 ± 0.372 | 1590.0 ± 349.0 | 12.38 ± 6.11 | 1 |
| 04362788–4114465 | M8 β | M9 γ | 0.073 ± 0.012 | 0.013 ± 0.016 | (23 ± 6) | 14.972 ± 1.446 | −2.872 ± 0.227 | 2452.0 ± 404.0 | 38.5 ± 22.59 | 1, 2 |
| 21544859–7459134 | – – | M9.5 β | 0.0407 ± 0.0022 | −0.0796 ± 0.0122 | (21 ± 7) | (6.21 ± 3.1) | −3.219 ± 0.29 | 2118.0 ± 385.0 | 28.51 ± 15.15 | 1, 10 |
| 22351658–3844154 | – – | L1.5 γ | 0.0505 ± 0.0078 | −0.0757 ± 0.0109 | (22 ± 2) | (−4.9 ± 3.1) | – | – | – | 10 |
| 22353560–5906306 | – – | M8.5 β | 0.0556 ± 0.0051 | −0.081 ± 0.0108 | (23 ± 5) | (1.71 ± 3.14) | −3.294 ± 0.189 | 2076.0 ± 251.0 | 25.13 ± 11.58 | 1, 10 |
| 23225299–6151275 | L2 γ | L3γa | 0.062 ± 0.01 | −0.085 ± 0.009 | (22 ± 1) | 6.747 ± 0.75 | −3.606 ± 0.04 | 1793.0 ± 50.0 | 15.05 ± 2.66 | 1 |
| TW HYDRAE | ||||||||||
| TWA28 | M8.5 γ | M9 γa | −0.06720 ± 0.0006 | −0.014 ± 0.0006 | 18.1 ± 0.5 | (13.3 ± 1.8) | −2.561 ± 0.024 | 2664.0 ± 81.0 | 35.39 ± 10.23 | 18 |
| TWA26 | M9 γ | M9 γ | −0.08120 ± 0.0039 | −0.0277 ± 0.0021 | 23.82 ± 2.58 | 11.6 ± 2 | −2.587 ± 0.094 | 2641.0 ± 192.0 | 35.3 ± 13.73 | 15, 16 |
| TWA27A | M8 γ | M8 γ | −0.06300 ± 0.002 | −0.023 ± 0.003 | 19.1 ± 0.4 | 11.2 ± 2 | −2.602 ± 0.018 | 2635.0 ± 73.0 | 33.04 ± 9.32 | 16, 19 |
| 11193254–1137466 | – – | L7γ | -.1451 ± 0.0149 | −0.0724 ± 0.016 | (35 ± 5) | 8.5 ± 3.3 | −4.363 ± 0.124 | 1223.0 ± 90.0 | 6.57 ± 1.94 | 27 |
| 114724.10−204021.3 | – – | L7γ | −0.1221 ± 0.012 | −0.0745 ± 0.0113 | (32 ± 4) | (9.61 ± ) | −4.346 ± 0.109 | 1235.0 ± 80.0 | 6.64 ± 1.89 | 28 |
| 12074836–3900043 | L0 γ | L1 γ | −0.0572 ± 0.0079 | −0.0248 ± 0.0105 | (15 ± 3) | (9.48 ± 1.91) | −3.485 ± 0.076 | 1882.0 ± 84.0 | 13.75 ± 0.75 | 17 |
| TWA29 | M9.5 γ | L0 γ | −0.04030 ± 0.0117 | −0.0203 ± 0.017 | 12.66 ± 2.07 | (7.74 ± 2.04) | −2.905 ± 0.142 | 2394.0 ± 236.0 | 24.74 ± 8.43 | 15 |
Notes.
A spectral type with a ? indicates questionable or extremely uncertain gravity features.
aThese sources have new infrared spectra presented in this paper. In the majority of cases, we use the infrared spectral type and gravity classification diagnosed in this work. If an object had SpeX data, then we defaulted to the resultant type and classification with that those.Parallaxes in parentheses "( )" are kinematic distances.References. see Table 10.
In TW Hydrae and β Pictoris, which are the two youngest groups at ∼10 and ∼20 Myr, respectively, there are nine M7 or later objects, all of which have a gravity classification of γ in both the infrared and optical. In AB Doradus, the oldest association at ∼110–130 Myr, there are eight sources with 4 optical γ (6 infrared) and 1 optical β (2 infrared) objects. Similarly, in Tucana Horologium, where we have the most number of bona fide or HLMs, 20 M7 or later, there are 9 optical γ (10 infrared) and 3 optical β (5 infrared) objects.
Splitting the sample of BM/HLM objects into <25 Myr (β Pictoris, TW Hydrae), ∼40 Myr (Tucana Horologium, Columba, Argus), and >100 Myr (AB Doradus) categories, and using the default spectral type and gravity classes used in plots within this text, we find there are (9 γ, 0 β) in <25 Myr, (14 γ, 8 β) in ∼40 Myr, and (6γ, 2 β) in >100 Myr associations. While these are still small numbers, the lack of a correlation of numbers of (γ, β) objects as a function of bin, indicates that spectral features do not correspond one to one with age. We note that there are 25 objects that have both an infrared and optical spectral type and while 6 have differing gravity classifications, 19 are consistent with each other affirming the diversity. Clearly, what have been assigned as gravity-sensitive features are influenced by secondary parameters (see also discussions in Allers & Liu 2013; Liu et al. 2013, G15).
7.2. Photometric Properties: What Do the Colors Tell Us?
The majority of flux for a brown dwarf emerges in the infrared. Interestingly, an enormous amount of diversity among the population can be found by examining infrared colors alone (e.g., Kirkpatrick et al. 2008; Faherty et al. 2009, 2013; Schmidt et al. 2010).
As quantified in Tables 15 and 16 and visualized in Figures 5–14, the scatter for "normal" sources is pronounced, especially among the mid- to late- L dwarfs. Past works have attributed this to variations in effective temperature, metallicity, age, or atmosphere conditions (Knapp et al. 2004; Patten et al. 2006; Kirkpatrick et al. 2008; Faherty et al. 2013).

Figure 5. Distribution of J–H color as a function of spectral type. The black filled circle at each subtype is the mean value and the gray filled area marks the standard deviation spread. The isolated sources that compose this "normal" sample have no spectral peculiarities (e.g., subdwarfs, low-gravity, unresolved binarity), and were only included if they had a photometric uncertainty in each band <0.2 mag. The full list was gathered from the dwarfarchives compendium and supplemented with the large ultra-cool dwarf surveys from Schmidt et al. (2010), Mace et al. (2013), Kirkpatrick et al. (2011), and West et al. (2008; for M dwarfs). Individual filled squares or five-point stars are γ or β, respectively, classified objects. Spectral types, as well as gravity classifications, are from optical data unless only infrared was available. We note that most sources plotted have spectral type uncertainties of 0.5. Objects are color-coded by group assignments (or lack thereof) discussed in this work. 2MASS photometry is used for the JHKs bands.
Download figure:
Standard image High-resolution image
Figure 6. Distribution of J–Ks color as a function of spectral type. Symbols are as described in Figure 5.
Download figure:
Standard image High-resolution image
Figure 7. Distribution of J–W1 color as a function of spectral type. Symbols are as described in Figure 5.
Download figure:
Standard image High-resolution image
Figure 8. Distribution of J–W2 color as a function of spectral type. Symbols are as described in Figure 5.
Download figure:
Standard image High-resolution image
Figure 9. Distribution of H–Ks color as a function of spectral type. Symbols are as described in Figure 5.
Download figure:
Standard image High-resolution image
Figure 10. Distribution of H–W1 color as a function of spectral type. Symbols are as described in Figure 5.
Download figure:
Standard image High-resolution image
Figure 11. Distribution of H–W2 color as a function of spectral type. Symbols are as described in Figure 5.
Download figure:
Standard image High-resolution image
Figure 12. Distribution of Ks–W1 color as a function of spectral type. Symbols are as described in Figure 5.
Download figure:
Standard image High-resolution image
Figure 13. Distribution of Ks–W2 color as a function of spectral type. Symbols are as described in Figure 5.
Download figure:
Standard image High-resolution image
Figure 14. Distribution of W1–W2 color as a function of spectral type. Symbols are as described in Figure 5.
Download figure:
Standard image High-resolution imageTable 14. Fundamental Parameters for Young Sources
| 2MASS | SpT | SpT | πa | LBolb | Teffb | Massb |
|---|---|---|---|---|---|---|
| OpT | NIR | mas | K | MJupiter | ||
| (1) | (2) | (3) | (4) | (5) | (6) | (7) |
| 00040288–6410358 | L1 γ | L1 γa | (17 ± 1) | −3.48 ± 0.051 | 1904.0 ± 63.0 | 16.11 ± 2.9 |
| 00191296–6226005 | – – | L1 γ | (21 ± 6) | −3.644 ± 0.248 | 1755.0 ± 258.0 | 14.88 ± 4.52 |
| 00192626+4614078 | M8 – | M8 β | (31 ± 3) | −2.773 ± 0.129 | 2637.0 ± 371.0 | 66.62 ± 48.99 |
| 00274197+0503417 | M9.5β | L0β | 13.8 ± 1.6 | −3.545 ± 0.101 | 1945.0 ± 197.0 | 31.64 ± 19.25 |
| 00303013–1450333 | L7– | L4-L6β | 37.42 ± 4.50 | −4.378 ± 0.105 | 1436.0 ± 131.0 | 50.89 ± 23.43 |
| 00325584–4405058 | L0γ | L0β | 21.6 ± 7.2 | −3.388 ± 0.289 | 2066.0 ± 413.0 | 41.64 ± 29.47 |
| 003323.86–1521309 | L4β | L1 | 24.8 ± 2.5 | −3.616 ± 0.088 | 1880.0 ± 173.0 | 29.68 ± 17.71 |
| 00381489–6403529 | – – | M9.5 β | (23 ± 5) | −3.423 ± 0.189 | 1957.0 ± 226.0 | 22.03 ± 9.39 |
| 00452143+1634446 | L2β | L2γ | 62.5 ± 3.7 | −3.405 ± 0.031 | 2059.0 ± 45.0 | 24.98 ± 4.62 |
| 00470038+6803543 | L7(γ?) | L6-L8γ | 82 ± 3 | −4.429 ± 0.033 | 1230.0 ± 27.0 | 11.84 ± 2.63 |
| 00584253–0651239 | L0– | L1β | 33.8 ± 4.0 | −3.635 ± 0.103 | 1860.0 ± 180.0 | 29.48 ± 17.76 |
| 01033203+1935361 | L6β | L6β | 46.9 ± 7.6 | −4.407 ± 0.141 | 1223.0 ± 113.0 | 12.82 ± 8.43 |
| 01174748–3403258 | L1 β | L1 βa | (20 ± 3) | −3.477 ± 0.13 | 1902.0 ± 152.0 | 16.36 ± 3.69 |
| 01205114–5200349 | – – | L1 γ | (24 ± 4) | −3.737 ± 0.145 | 1685.0 ± 145.0 | 13.97 ± 3.51 |
| 01231125–6921379 | M7.5γ | – – | 21.6 ± 3.3 | −2.525 ± 0.133 | 2743.0 ± 317.0 | 55.56 ± 33.21 |
| 01415823–4633574 | L0 γ | L0 γ | (25 ± 3) | −3.485 ± 0.104 | 1899.0 ± 123.0 | 16.2 ± 3.4 |
| 01531463–6744181 | L2 – | L3 β | (21 ± 7) | −3.91 ± 0.29 | 1545.0 ± 264.0 | 11.89 ± 5.36 |
| 02103857–3015313 | L0 γ | L0 γa | (32 ± 8) | −3.826 ± 0.217 | 1610.0 ± 207.0 | 13.03 ± 4.31 |
| 02212859–6831400 | M8β | – – | 25.4 ± 3.6 | – | – | – |
| 02215494–5412054 | M9 β | – – | (31 ± 5) | – | – | – |
| 02235464–5815067 | L0γ | – – | 27.4 ± 2.6 | −3.509 ± 0.082 | 1879.0 ± 98.0 | 15.91 ± 3.12 |
| 02340093–6442068 | L0 γ | L0β γ | (21 ± 5) | −3.538 ± 0.207 | 1848.0 ± 229.0 | 15.97 ± 4.29 |
| 02410564–5511466 | – – | L1 γ | (24 ± 4) | −3.679 ± 0.145 | 1731.0 ± 151.0 | 14.49 ± 3.49 |
| 02411151–0326587 | L0γ | L1γ | 21.4 ± 2.6 | −3.717 ± 0.106 | 1787.0 ± 172.0 | 27.68 ± 16.67 |
| 02501167–0151295 | – – | M7β | 30.2 ± 4.5 | −3.001 ± 0.129 | 2821.0 ± 242.0 | 103.42 ± 16.17 |
| 02530084+1652532 | – – | M7β | 260.63 ± 2.69 | −3.193 ± 0.121 | 2641.0 ± 210.0 | 90.37 ± 13.88 |
| 02535980+3206373 | M7β | M6β | 17.7 ± 2.5 | −2.788 ± 0.123 | 2627.0 ± 362.0 | 65.02 ± 47.48 |
| 03231002–4631237 | L0 γ | L0 γa | (17 ± 3) | −3.348 ± 0.153 | 2031.0 ± 201.0 | 23.17 ± 9.75 |
| 03264225–2102057 | L5 β | L5βγa | (41 ± 1) | −4.235 ± 0.022 | 1346.0 ± 26.0 | 13.77 ± 2.6 |
| 03350208+2342356 | M8.5– | M7.5β | 23.6 ± 1.3 | – | – | – |
| 03393521–3525440 | M9β | L0β | 155.89 ± 1.03 | −3.563 ± 0.005 | 1939.0 ± 142.0 | 29.62 ± 16.67 |
| 03421621–6817321 | L4 γ | – – | (21 ± 9) | −3.848 ± 0.372 | 1590.0 ± 349.0 | 12.38 ± 6.11 |
| 03552337+1133437 | L5γ | L3-L6γ | 110.8 ± 4.3 | −4.104 ± 0.034 | 1478.0 ± 58.0 | 21.62 ± 6.14 |
| 04362788–4114465 | M8 β | M9 γ | (23 ± 6) | −2.872 ± 0.227 | 2452.0 ± 404.0 | 38.5 ± 22.59 |
| 05012406–0010452 | L4γ | L3γ | 51 ± 3.7 | −3.962 ± 0.063 | 1563.0 ± 116.0 | 22.15 ± 13.2 |
| 05184616–2756457 | L1γ | L1γ | 21.4 ± 6.9 | −3.575 ± 0.28 | 1808.0 ± 301.0 | 19.94 ± 9.23 |
| 05361998–1920396 | L2γ | L2γ | 25.6 ± 9.4 | −3.826 ± 0.319 | 1666.0 ± 334.0 | 27.71 ± 20.46 |
| 05575096–1359503 | M7– | M7γ | 1.9 ± 1 | – | – | – |
| 06023045+3910592 | L1– | L1β | 88.5 ± 1.6 | −3.65 ± 0.016 | 1857.0 ± 133.0 | 27.88 ± 15.63 |
| 06085283–2753583 | M8.5γ | L0γ | 32 ± 3.6 | −3.344 ± 0.098 | 2147.0 ± 228.0 | 37.85 ± 24.05 |
| 06524851–5741376 | M8β | – – | 31.3 ± 3.2 | – | – | – |
| 07123786–6155528 | L1β | L1γ | 22.9 ± 9.1 | −3.598 ± 0.345 | 1861.0 ± 412.0 | 35.66 ± 25.8 |
| 07140394+3702459 | M8– | M7.5β | 80.10 ± 4.8 | −3.479 ± 0.052 | 2352.0 ± 97.0 | 77.81 ± 11.75 |
| G196-3B | L3β | L3γ | 41 ± 4.1 | −3.752 ± 0.087 | 1789.0 ± 177.0 | 32.83 ± 20.25 |
| 10220489+0200477 | M9β | M9β | 26.4 ± 11.5 | −3.323 ± 0.378 | 2097.0 ± 526.0 | 47.09 ± 35.09 |
| 10224821+5825453 | L1β | L1β | 54.3 ± 2.5 | −3.682 ± 0.041 | 1823.0 ± 136.0 | 27.55 ± 15.72 |
| TWA28 | M8.5γ | M9γ | 18.1 ± 0.5 | −2.561 ± 0.024 | 2664.0 ± 81.0 | 35.39 ± 10.23 |
| 11193254–1137466 | – – | L7γ | (35 ± 5) | −4.363 ± 0.124 | 1223.0 ± 90.0 | 6.57 ± 1.94 |
| TWA26 | M9γ | M9γ | 23.82 ± 2.58 | −2.587 ± 0.094 | 2641.0 ± 192.0 | 35.3 ± 13.73 |
| 114724.10−204021.3 | – – | L7γ | (32 ± 4) | −4.346 ± 0.109 | 1235.0 ± 80.0 | 6.64 ± 1.89 |
| TWA27A | M8γ | M8γ | 19.1 ± 0.4 | −2.602 ± 0.018 | 2635.0 ± 73.0 | 33.04 ± 9.32 |
| 12074836–3900043 | L0 γ | L1 γ | (15 ± 3) | −3.485 ± 0.076 | 1882.0 ± 84.0 | 13.75 ± 0.75 |
| TWA29 | M9.5γ | L0γ | 12.66 ± 2.07 | −2.905 ± 0.142 | 2394.0 ± 236.0 | 24.74 ± 8.43 |
| 14252798–3650229 | L3– | L4γ | 86.45 ± 0.83 | −4.038 ± 0.009 | 1535.0 ± 53.0 | 22.52 ± 6.07 |
| 15525906+2948485 | L0β | L0β | 48.8 ± 2.7 | −3.538 ± 0.017 | 1967.0 ± 153.0 | 30.34 ± 17.3 |
| 17260007+1538190 | L3.5γ | L3γ | 28.6 ± 2.9 | −3.844 ± 0.088 | 1667.0 ± 146.0 | 24.82 ± 14.86 |
| 18212815+1414010 | L4.5– | L4pec | 106.65 ± 0.23 | −2.801 ± 0.006 | 2986.0 ± 23.0 | 121.27 ± 6.38 |
| 20004841–7523070 | M9 γ | M9 γa | (31 ± 1) | −2.972 ± 0.028 | 2375.0 ± 74.0 | 24.28 ± 5.63 |
| 20575409–0252302 | L1.5– | L2β | 70.1 ± 3.7 | −3.767 ± 0.046 | 2041.0 ± 88.0 | 69.5 ± 13.04 |
| PSO318 | – – | L6-L8γ | 40.7 ± 2.4 | −4.39 ± 0.052 | 1213.0 ± 38.0 | 6.44 ± 1.29 |
| 21265040–8140293 | L3γ | L3γ | 31.3 ± 2.6 | −3.866 ± 0.072 | 1651.0 ± 132.0 | 24.21 ± 14.3 |
| 21544859–7459134 | – – | M9.5 β | (21 ± 7) | −3.219 ± 0.29 | 2118.0 ± 385.0 | 28.51 ± 15.15 |
| 22064498–4217208 | L4 γ | L4 γa | (35 ± 2) | −3.997 ± 0.009 | 1566.0 ± 59.0 | 23.15 ± 6.37 |
| 22081363+2921215 | L3γ | L3γ | 21.2 ± 0.7 | −3.705 ± 0.029 | 1799.0 ± 131.0 | 26.96 ± 15.2 |
| 22351658–3844154 | – – | L1.5 γ | (22 ± 2) | – | – | – |
| 22353560–5906306 | – – | M8.5 β | (23 ± 5) | −3.294 ± 0.189 | 2076.0 ± 251.0 | 25.13 ± 11.58 |
| 22443167+2043433 | L6.5p – | L6-L8 γa | (54 ± 4) | −4.503 ± 0.007 | 1184.0 ± 10.0 | 10.46 ± 1.49 |
| 23224684–3133231 | L0β | L2β | 58.6 ± 5.6 | −3.85 ± 0.083 | 1667.0 ± 139.0 | 24.65 ± 14.69 |
| 23225299–6151275 | L2 γ | L3 γa | (22 ± 1) | −3.606 ± 0.04 | 1793.0 ± 50.0 | 15.05 ± 2.66 |
Notes.
A spectral type with a ? indicates questionable or extremely uncertain gravity features.
aThese sources have new infrared spectra presented in this paper. In the majority of cases, we use the infrared spectral type and gravity classification diagnosed in this work. If an object had SpeX data, then we defaulted to the resultant type and classification with that data.Parallaxes in parentheses "( )" are kinematic distances. bLbol, Teff, and Mass are calculated as described in Filippazzo et al. (2015). Values that are slightly different from that work have been updated using new data presented in this paper.References. See Table 10.
Table 15. Average Infrared Colors of Late-type M and L dwarfs
| SpT | N a a |
(J–H)avg | σ(J–H) | N a a |
(J–K)avg | σ(J-K) | N a a |
(J–W1)avg | σ(J–W1) | N a a |
(J–W2)avg | σ(J–W2) | N a a |
(H–K)avg | σ(H–K) |
|---|---|---|---|---|---|---|---|---|---|---|---|---|---|---|---|
| (1) | (2) | (3) | (4) | (5) | (6) | (7) | (8) | (9) | (10) | (11) | (12) | (13) | (14) | (15) | (16) |
| M7 | 1998 | 0.61 | 0.09 | 1976 | 0.97 | 0.10 | 1992 | 1.17 | 0.09 | 1990 | 1.37 | 0.10 | 1976 | 0.36 | 0.10 |
| M8 | 703 | 0.65 | 0.09 | 698 | 1.06 | 0.11 | 692 | 1.27 | 0.12 | 692 | 1.49 | 0.13 | 698 | 0.41 | 0.09 |
| M9 | 430 | 0.69 | 0.10 | 428 | 1.15 | 0.11 | 420 | 1.41 | 0.14 | 420 | 1.65 | 0.17 | 428 | 0.45 | 0.10 |
| L0 | 231 | 0.75 | 0.12 | 223 | 1.22 | 0.15 | 228 | 1.55 | 0.17 | 225 | 1.83 | 0.19 | 210 | 0.48 | 0.12 |
| L1 | 129 | 0.81 | 0.14 | 125 | 1.35 | 0.19 | 114 | 1.71 | 0.21 | 114 | 1.97 | 0.23 | 127 | 0.54 | 0.13 |
| L2 | 65 | 0.91 | 0.14 | 66 | 1.51 | 0.21 | 57 | 1.98 | 0.28 | 57 | 2.27 | 0.32 | 65 | 0.59 | 0.11 |
| L3 | 65 | 0.96 | 0.14 | 64 | 1.61 | 0.22 | 59 | 2.11 | 0.29 | 59 | 2.42 | 0.34 | 64 | 0.65 | 0.15 |
| L4 | 39 | 1.07 | 0.17 | 38 | 1.74 | 0.25 | 34 | 2.40 | 0.34 | 33 | 2.74 | 0.40 | 38 | 0.67 | 0.14 |
| L5 | 36 | 1.09 | 0.14 | 36 | 1.75 | 0.22 | 39 | 2.48 | 0.25 | 39 | 2.83 | 0.30 | 36 | 0.66 | 0.11 |
| L6 | 18 | 1.11 | 0.20 | 19 | 1.84 | 0.28 | 21 | 2.59 | 0.41 | 21 | 3.00 | 0.52 | 23 | 0.76 | 0.16 |
| L7 | 12 | 1.11 | 0.12 | 12 | 1.81 | 0.16 | 13 | 2.54 | 0.26 | 13 | 3.01 | 0.30 | 12 | 0.70 | 0.09 |
| L8 | 18 | 1.11 | 0.12 | 19 | 1.78 | 0.16 | 17 | 2.56 | 0.20 | 17 | 3.13 | 0.24 | 20 | 0.67 | 0.09 |
Note.
aOnly normal (non-low surface gravity, subdwarf, or young) L dwarfs with photometric uncertainty <0.1 were used in calculating the average.Download table as: ASCIITypeset image
Table 16. Average Infrared Colors of Late-type M and L Dwarfs
| SpT | N a a |
(H–W1)avg | σ(H–W1) | N a a |
(H–W2)avg | σ(H–W2) | N a a |
(K–W1)avg | σ(K–W1) | N a a |
(K–W2)avg | σ(K–W2) | N a a |
(W1-W2)avg | σ(W1–W2) |
|---|---|---|---|---|---|---|---|---|---|---|---|---|---|---|---|
| (1) | (2) | (3) | (4) | (5) | (6) | (7) | (8) | (9) | (10) | (11) | (12) | (13) | (14) | (15) | (16) |
| M7 | 1992 | 0.55 | 0.09 | 1988 | 0.76 | 0.10 | 1970 | 0.20 | 0.09 | 1970 | 0.41 | 0.10 | 1991 | 0.21 | 0.06 |
| M8 | 692 | 0.62 | 0.10 | 692 | 0.84 | 0.12 | 687 | 0.22 | 0.09 | 687 | 0.44 | 0.11 | 692 | 0.22 | 0.06 |
| M9 | 420 | 0.72 | 0.11 | 420 | 0.96 | 0.15 | 417 | 0.26 | 0.10 | 417 | 0.51 | 0.14 | 421 | 0.24 | 0.06 |
| L0 | 222 | 0.81 | 0.13 | 219 | 1.08 | 0.17 | 223 | 0.34 | 0.12 | 219 | 0.61 | 0.13 | 229 | 0.27 | 0.08 |
| L1 | 113 | 0.91 | 0.15 | 113 | 1.17 | 0.18 | 112 | 0.37 | 0.11 | 111 | 0.63 | 0.14 | 118 | 0.26 | 0.06 |
| L2 | 56 | 1.05 | 0.17 | 56 | 1.34 | 0.22 | 57 | 0.45 | 0.12 | 57 | 0.74 | 0.16 | 58 | 0.29 | 0.07 |
| L3 | 58 | 1.16 | 0.20 | 58 | 1.47 | 0.24 | 59 | 0.51 | 0.14 | 59 | 0.82 | 0.18 | 63 | 0.31 | 0.06 |
| L4 | 34 | 1.34 | 0.24 | 34 | 1.67 | 0.29 | 34 | 0.68 | 0.14 | 34 | 1.01 | 0.18 | 35 | 0.34 | 0.07 |
| L5 | 40 | 1.39 | 0.15 | 39 | 1.74 | 0.20 | 38 | 0.74 | 0.12 | 37 | 1.08 | 0.18 | 41 | 0.35 | 0.08 |
| L6 | 21 | 1.49 | 0.30 | 21 | 1.92 | 0.38 | 22 | 0.77 | 0.20 | 22 | 1.19 | 0.26 | 23 | 0.41 | 0.12 |
| L7 | 14 | 1.45 | 0.19 | 14 | 1.91 | 0.24 | 14 | 0.76 | 0.14 | 14 | 1.22 | 0.19 | 15 | 0.45 | 0.09 |
| L8 | 19 | 1.46 | 0.16 | 18 | 2.04 | 0.19 | 19 | 0.80 | 0.11 | 18 | 1.37 | 0.14 | 19 | 0.56 | 0.11 |
Note.
aOnly normal (non-low surface gravity, subdwarf, or young) L dwarfs with photometric uncertainty <0.1 were used in calculating the average.Download table as: ASCIITypeset image
In Figures 5–14, we plot infrared color combinations for the population. These can be used to examine trends or lack thereof among the new age-calibrated sample. The spread for "normal" objects (gray shaded area) in Figures 5–14 was created by isolating sources without peculiar spectral features (e.g., subdwarfs, low-gravity objects, and unresolved binaries were eliminated), and only keeping sources with photometric uncertainties in the color shown <0.2 mag. The list was gathered from the dwarfarchives19 compendium and supplemented with the large ultra-cool dwarf surveys from Schmidt et al. (2010), Mace et al. (2013), Kirkpatrick et al. (2011), and West et al. (2008; for M dwarfs).
For the low-gravity sample, spectral types, as well as gravity classifications, are from optical data unless only infrared was available. We note that most sources plotted have spectral type uncertainties of 0.5. However, as can be seen in Table 1, low-gravity sources can have up to a two-type difference in subtype, as well as differing gravity indications between the optical and the infrared. We investigated whether isolating the smaller samples of optical only or infrared only yielded different trends than this mixed sample, but found similar results in all cases. Hence, we default to optical classifications and designations where available, as this is the wavelength range where the original spectral typing schemes for this expected temperature range were created.
Overplotted on the gray field sequences in Figures 5–14 are the individual γ or β low-gravity objects. We have color-coded each source by the group it has been assigned or labeled it as "young field?" for those with ambiguous or non-conforming group kinematics. We have also given the β and γ objects different symbols so that their trends could be highlighted. Tables 17 and 18 give the infrared color of each source as well as its deviation from the mean (see Tables 15 and 16) of normal objects in its spectral subtype.
Table 17. Infrared Colors of Low-gravity, Late-type M and L Dwarfs
| Name | SpT | SpT | (J–H) | # of  a a |
(J–K) | # of  a a |
(J–W1) | # of  a a |
(J–W2) | # of  a a |
(H–K) | # of  a a |
|---|---|---|---|---|---|---|---|---|---|---|---|---|
| (1) | (2) | (3) | (4) | (5) | (6) | (7) | (8) | (9) | (10) | (11) | (12) | (13) |
| 01231125–6921379 | M7.5γ | – – | 0.61 ± 0.03 | 0.0 | 1.00 ± 0.03 | 0.3 | 1.26 ± 0.03 | 1.0 | 1.50 ± 0.03 | 1.3 | 0.39 ± 0.03 | 0.3 |
| 01294256–0823580 | M5 – | M7β | 0.57 ± 0.03 | −0.4 | 0.88 ± 0.03 | −0.9 | 1.11 ± 0.03 | −0.7 | 1.33 ± 0.03 | −0.4 | 0.31 ± 0.03 | −0.5 |
| 02501167–0151295 | – – | M7β | 0.61 ± 0.03 | 0.0 | 0.98 ± 0.03 | 0.1 | 1.20 ± 0.03 | 0.3 | 1.44 ± 0.03 | 0.6 | 0.37 ± 0.03 | 0.1 |
| 02530084+1652532 | – – | M7β | 0.51 ± 0.04 | −1.1 | 0.81 ± 0.05 | −1.6 | 1.07 ± 0.03 | −1.1 | 1.34 ± 0.03 | −0.3 | 0.30 ± 0.06 | −0.6 |
| 02535980+3206373 | M7β | M6β | 0.69 ± 0.03 | 0.8 | 1.07 ± 0.03 | 1.0 | 1.29 ± 0.03 | 1.4 | 1.49 ± 0.03 | 1.2 | 0.38 ± 0.03 | 0.2 |
| 03350208+2342356 | M8.5– | M7.5β | 0.60 ± 0.03 | −0.2 | 0.99 ± 0.02 | 0.2 | 1.21 ± 0.03 | 0.4 | 1.48 ± 0.03 | 1.1 | 0.39 ± 0.02 | 0.3 |
| 05181131–3101529 | M6.5– | M7β | 0.64 ± 0.03 | 0.4 | 0.98 ± 0.03 | 0.1 | 1.24 ± 0.03 | 0.7 | 1.48 ± 0.03 | 1.1 | 0.33 ± 0.03 | −0.3 |
| 05264316–1824315 | – – | M7β | 0.52 ± 0.03 | −1.0 | 0.91 ± 0.03 | −0.6 | 1.16 ± 0.03 | −0.1 | 1.41 ± 0.03 | 0.4 | 0.39 ± 0.03 | 0.3 |
| 05575096–1359503 | M7– | M7γ | 0.73 ± 0.03 | 1.3 | 1.14 ± 0.03 | 1.7 | 1.54 ± 0.03 | 4.1 | 2.07 ± 0.03 | 7.0 | 0.41 ± 0.03 | 0.5 |
| 07140394+3702459 | M8– | M7.5β | 0.72 ± 0.03 | 1.3 | 1.14 ± 0.03 | 1.7 | 1.41 ± 0.03 | 2.7 | 1.63 ± 0.03 | 2.6 | 0.41 ± 0.03 | 0.5 |
| 20391314–1126531 | M8– | M7β | 0.66 ± 0.04 | 0.6 | 1.11 ± 0.04 | 1.4 | 1.33 ± 0.03 | 1.7 | 1.63 ± 0.03 | 2.6 | 0.45 ± 0.05 | 0.9 |
| 00192626+4614078 | M8 – | M8 β | 0.66 ± 0.03 | 0.1 | 1.10 ± 0.02 | 0.4 | 1.34 ± 0.03 | 0.6 | 1.60 ± 0.03 | 0.9 | 0.44 ± 0.02 | 0.3 |
| 02212859–6831400 | M8β | – – | 0.69 ± 0.05 | 0.4 | 1.16 ± 0.05 | 0.9 | 1.49 ± 0.04 | 1.9 | 1.77 ± 0.04 | 2.2 | 0.47 ± 0.05 | 0.7 |
| 03550477–1032415 | M8.5– | M8.5β | 0.62 ± 0.03 | −0.4 | 1.11 ± 0.03 | 0.4 | 1.37 ± 0.03 | 0.8 | 1.66 ± 0.03 | 1.3 | 0.49 ± 0.03 | 0.9 |
| 04351455–1414468 | M8γ | M7γ | 1.26 ± 0.04 | 6.7 | 1.93 ± 0.04 | 7.9 | 2.17 ± 0.04 | 7.5 | 2.61 ± 0.04 | 8.6 | 0.67 ± 0.03 | 2.9 |
| 04362788–4114465 | M8 β | M9 γ | 0.67 ± 0.03 | 0.2 | 1.05 ± 0.03 | −0.1 | 1.36 ± 0.03 | 0.7 | 1.64 ± 0.03 | 1.1 | 0.38 ± 0.03 | −0.3 |
| 05341594–0631397 | M8γ | M8γ | 0.68 ± 0.12 | 0.4 | 1.11 ± 0.12 | 0.5 | 1.27 ± 0.08 | 0.0 | 1.80 ± 0.09 | 2.4 | 0.43 ± 0.14 | 0.2 |
| 06085283–2753583 | M8.5γ | L0γ | 0.70 ± 0.04 | 0.5 | 1.23 ± 0.04 | 1.5 | 1.62 ± 0.04 | 2.9 | 1.97 ± 0.03 | 3.7 | 0.53 ± 0.03 | 1.3 |
| 06524851–5741376 | M8β | – – | 0.67 ± 0.03 | 0.2 | 1.18 ± 0.03 | 1.1 | 1.48 ± 0.03 | 1.7 | 1.78 ± 0.03 | 2.2 | 0.52 ± 0.03 | 1.2 |
| 08561384–1342242 | – – | M8γ | 0.63 ± 0.04 | −0.3 | 1.11 ± 0.03 | 0.5 | 1.45 ± 0.03 | 1.5 | 1.98 ± 0.03 | 3.8 | 0.49 ± 0.04 | 0.9 |
| TWA28 | M8.5γ | M9γ | 0.68 ± 0.03 | 0.3 | 1.14 ± 0.03 | 0.8 | 1.60 ± 0.03 | 2.7 | 2.24 ± 0.03 | 5.8 | 0.47 ± 0.03 | 0.6 |
| TWA27A | M8γ | M8γ | 0.61 ± 0.04 | −0.4 | 1.05 ± 0.04 | −0.1 | 1.44 ± 0.04 | 1.5 | 1.99 ± 0.04 | 3.9 | 0.44 ± 0.04 | 0.3 |
| 12271545–0636458 | M9– | M8.5β | 0.81 ± 0.04 | 1.7 | 1.31 ± 0.04 | 2.3 | 1.68 ± 0.04 | 3.4 | 1.94 ± 0.04 | 3.4 | 0.50 ± 0.05 | 1.1 |
| 15291017+6312539 | – – | M8β | 0.71 ± 0.04 | 0.6 | 1.09 ± 0.03 | 0.3 | 1.35 ± 0.03 | 0.7 | 1.59 ± 0.03 | 0.7 | 0.38 ± 0.04 | −0.3 |
| 20282203–5637024 | – – | M8.5γ | 0.59 ± 0.03 | −0.6 | 1.13 ± 0.03 | 0.6 | 1.37 ± 0.03 | 0.8 | 1.66 ± 0.03 | 1.3 | 0.53 ± 0.04 | 1.4 |
| 22353560–5906306 | – – | M8.5 β | 0.69 ± 0.05 | 0.4 | 1.11 ± 0.04 | 0.5 | 1.59 ± 0.04 | 2.7 | 1.92 ± 0.04 | 3.3 | 0.42 ± 0.05 | 0.2 |
| 23231347–0244360 | M8.5– | M8β | 0.65 ± 0.04 | 0.1 | 1.10 ± 0.03 | 0.4 | 1.34 ± 0.03 | 0.6 | 1.63 ± 0.03 | 1.0 | 0.44 ± 0.04 | 0.4 |
| 23520507–1100435 | M7– | M8β | 0.67 ± 0.03 | 0.3 | 1.10 ± 0.03 | 0.3 | 1.40 ± 0.03 | 1.1 | 1.69 ± 0.03 | 1.6 | 0.42 ± 0.03 | 0.2 |
| 00274197+0503417 | M9.5β | L0β | 0.90 ± 0.14 | 2.1 | 1.23 ± 0.15 | 0.7 | 1.57 ± 0.10 | 1.1 | 2.05 ± 0.11 | 2.4 | 0.33 ± 0.15 | −1.2 |
| 00381489–6403529 | – – | M9.5β | 0.66 ± 0.05 | −0.3 | 1.13 ± 0.04 | −0.2 | 1.62 ± 0.04 | 1.5 | 1.98 ± 0.04 | 2.0 | 0.47 ± 0.06 | 0.2 |
| 00425923+1142104 | – – | M9β | 0.68 ± 0.06 | −0.1 | 1.24 ± 0.05 | 0.8 | 1.52 ± 0.04 | 0.8 | 1.84 ± 0.05 | 1.1 | 0.56 ± 0.05 | 1.1 |
| 00464841+0715177 | M9β | L0δ | 0.71 ± 0.04 | 0.2 | 1.34 ± 0.04 | 1.7 | 1.82 ± 0.04 | 2.9 | 2.25 ± 0.03 | 3.5 | 0.63 ± 0.04 | 1.8 |
| 02215494–5412054 | M9β | – – | 0.68 ± 0.04 | −0.1 | 1.23 ± 0.04 | 0.7 | 1.58 ± 0.04 | 1.2 | 1.94 ± 0.04 | 1.7 | 0.55 ± 0.04 | 1.0 |
| 02251947–5837295 | M9β | M9γ | 0.68 ± 0.04 | −0.1 | 1.18 ± 0.04 | 0.3 | 1.50 ± 0.03 | 0.7 | 1.81 ± 0.03 | 1.0 | 0.50 ± 0.04 | 0.5 |
| 03393521–3525440 | M9β | L0β | 0.71 ± 0.03 | 0.2 | 1.18 ± 0.03 | 0.2 | 1.59 ± 0.03 | 1.3 | 1.92 ± 0.03 | 1.6 | 0.47 ± 0.03 | 0.2 |
| 04433761+0002051 | M9γ | M9γ | 0.70 ± 0.03 | 0.1 | 1.29 ± 0.03 | 1.2 | 1.68 ± 0.03 | 1.9 | 2.03 ± 0.03 | 2.2 | 0.58 ± 0.03 | 1.3 |
| 04493288+1607226 | – – | M9γ | 0.78 ± 0.04 | 0.9 | 1.20 ± 0.04 | 0.4 | 1.54 ± 0.04 | 0.9 | 1.85 ± 0.04 | 1.2 | 0.41 ± 0.04 | −0.4 |
| 05402325–0906326 | – – | M9β | 0.74 ± 0.05 | 0.5 | 1.26 ± 0.06 | 1.0 | 1.56 ± 0.04 | 1.0 | 1.84 ± 0.05 | 1.1 | 0.52 ± 0.06 | 0.7 |
| 09451445–7753150 | – – | M9β | 0.66 ± 0.04 | −0.3 | 1.11 ± 0.04 | −0.4 | 1.38 ± 0.04 | −0.2 | 1.61 ± 0.04 | −0.2 | 0.44 ± 0.04 | −0.1 |
| 09532126–1014205 | M9γ | M9β | 0.82 ± 0.04 | 1.3 | 1.33 ± 0.03 | 1.6 | 1.71 ± 0.03 | 2.2 | 2.07 ± 0.03 | 2.4 | 0.50 ± 0.03 | 0.5 |
| 10220489+0200477 | M9β | M9β | 0.70 ± 0.04 | 0.1 | 1.20 ± 0.04 | 0.5 | 1.49 ± 0.04 | 0.6 | 1.76 ± 0.04 | 0.6 | 0.50 ± 0.04 | 0.5 |
| 11064461–3715115 | – – | M9γ | 0.64 ± 0.04 | −0.5 | 1.15 ± 0.05 | 0.0 | 1.42 ± 0.04 | 0.0 | 1.73 ± 0.04 | 0.5 | 0.51 ± 0.05 | 0.6 |
| TWA26 | M9γ | M9γ | 0.69 ± 0.03 | 0.0 | 1.18 ± 0.03 | 0.3 | 1.53 ± 0.03 | 0.9 | 1.89 ± 0.03 | 1.4 | 0.49 ± 0.03 | 0.4 |
| TWA29 | M9.5γ | L0γ | 0.72 ± 0.05 | 0.3 | 1.15 ± 0.05 | 0.0 | 1.52 ± 0.04 | 0.8 | 1.90 ± 0.04 | 1.4 | 0.43 ± 0.05 | −0.2 |
| 12474428–3816464 | – – | M9γ | 0.69 ± 0.05 | 0.0 | 1.21 ± 0.05 | 0.6 | 1.68 ± 0.04 | 1.9 | 2.26 ± 0.04 | 3.6 | 0.52 ± 0.05 | 0.7 |
| 12535039–4211215 | – – | M9.5γ | 0.70 ± 0.15 | 0.1 | 1.26 ± 0.15 | 1.0 | 1.72 ± 0.11 | 2.2 | 2.08 ± 0.11 | 2.5 | 0.56 ± 0.15 | 1.1 |
| 14112131–2119503 | M9β | M8β | 0.61 ± 0.03 | −0.8 | 1.11 ± 0.03 | −0.4 | 1.36 ± 0.03 | −0.4 | 1.62 ± 0.03 | −0.2 | 0.50 ± 0.03 | 0.5 |
| 15104786–2818174 | M9– | M9β | 0.73 ± 0.04 | 0.4 | 1.15 ± 0.04 | 0.0 | 1.52 ± 0.04 | 0.8 | 1.83 ± 0.04 | 1.0 | 0.42 ± 0.04 | −0.3 |
| 15470557–1626303A | – – | M9β | 0.62 ± 0.04 | −0.7 | 1.13 ± 0.04 | −0.2 | 1.43 ± 0.04 | 0.1 | 1.72 ± 0.04 | 0.4 | 0.51 ± 0.04 | 0.6 |
| 15474719–2423493 | M9γ | L0β | 0.70 ± 0.04 | 0.1 | 1.23 ± 0.03 | 0.7 | 1.56 ± 0.04 | 1.1 | 1.87 ± 0.04 | 1.3 | 0.53 ± 0.04 | 0.8 |
| 15575011–2952431 | M9δ | L1γ | 0.87 ± 0.16 | 1.8 | 1.47 ± 0.16 | 2.9 | 1.88 ± 0.12 | 3.4 | 2.25 ± 0.13 | 3.5 | 0.60 ± 0.15 | 1.5 |
| 19355595–2846343 | M9γ | M9γ | 0.77 ± 0.03 | 0.8 | 1.24 ± 0.04 | 0.8 | 1.61 ± 0.04 | 1.4 | 2.04 ± 0.03 | 2.3 | 0.47 ± 0.03 | 0.2 |
| 20004841–7523070 | M9 γ | M9 γa | 0.77 ± 0.03 | 0.8 | 1.22 ± 0.03 | 0.7 | 1.63 ± 0.03 | 1.5 | 1.94 ± 0.03 | 1.7 | 0.46 ± 0.04 | 0.1 |
| 20135152–2806020 | M9γ | L0γ | 0.78 ± 0.04 | 0.9 | 1.30 ± 0.04 | 1.4 | 1.72 ± 0.04 | 2.2 | 2.08 ± 0.04 | 2.5 | 0.52 ± 0.04 | 0.7 |
| 21544859–7459134 | – – | M9.5 β | 0.72 ± 0.05 | 0.3 | 1.20 ± 0.04 | 0.5 | 1.58 ± 0.04 | 1.2 | 1.91 ± 0.04 | 1.5 | 0.48 ± 0.05 | 0.3 |
| 21572060+8340575 | L0– | M9γ | 0.91 ± 0.04 | 2.2 | 1.39 ± 0.04 | 2.2 | 1.88 ± 0.03 | 3.4 | 2.29 ± 0.03 | 3.8 | 0.48 ± 0.04 | 0.3 |
| 22025794–5605087 | – – | M9γ | 0.74 ± 0.05 | 0.5 | 1.20 ± 0.05 | 0.4 | 1.55 ± 0.04 | 1.0 | 1.80 ± 0.04 | 0.9 | 0.46 ± 0.05 | 0.1 |
| 23360735–3541489 | – – | M9β | 0.84 ± 0.04 | 1.5 | 1.27 ± 0.05 | 1.1 | 1.65 ± 0.03 | 1.7 | 2.00 ± 0.04 | 2.1 | 0.42 ± 0.05 | −0.3 |
| 23453903+0055137 | M9– | M9β | 0.65 ± 0.04 | −0.4 | 1.19 ± 0.04 | 0.4 | 1.56 ± 0.04 | 1.1 | 1.89 ± 0.04 | 1.4 | 0.54 ± 0.04 | 0.9 |
| 00182834–6703130 | – – | L0γ | 0.98 ± 0.08 | 1.9 | 1.75 ± 0.07 | 3.5 | 2.29 ± 0.06 | 4.3 | 2.69 ± 0.06 | 4.5 | 0.77 ± 0.07 | 2.4 |
| 00325584–4405058 | L0γ | L0β | 0.92 ± 0.05 | 1.4 | 1.51 ± 0.05 | 1.9 | 1.96 ± 0.04 | 2.4 | 2.29 ± 0.04 | 2.4 | 0.59 ± 0.05 | 0.9 |
| 00374306–5846229 | L0γ | – – | 1.12 ± 0.07 | 3.0 | 1.78 ± 0.07 | 3.8 | 2.25 ± 0.06 | 4.1 | 2.64 ± 0.06 | 4.2 | 0.67 ± 0.07 | 1.6 |
| 01244599–5745379 | L0γ | L0γ | 1.25 ± 0.14 | 4.2 | 1.99 ± 0.14 | 5.1 | 2.54 ± 0.11 | 5.8 | 2.97 ± 0.11 | 6.0 | 0.74 ± 0.12 | 2.2 |
| 01415823–4633574 | L0 γ | L0 γ | 0.96 ± 0.05 | 1.7 | 1.73 ± 0.05 | 3.4 | 2.28 ± 0.05 | 4.3 | 2.66 ± 0.05 | 4.4 | 0.78 ± 0.04 | 2.5 |
| 02103857–3015313 | L0 γ | L0 γa | 0.91 ± 0.06 | 1.3 | 1.57 ± 0.06 | 2.3 | 2.06 ± 0.05 | 3.0 | 2.41 ± 0.05 | 3.1 | 0.66 ± 0.06 | 1.5 |
| 02235464–5815067 | L0γ | – – | 1.07 ± 0.06 | 2.6 | 1.65 ± 0.06 | 2.9 | 2.25 ± 0.05 | 4.1 | 2.64 ± 0.05 | 4.3 | 0.58 ± 0.06 | 0.9 |
| 02265658–5327032 | – – | L0δ | 1.06 ± 0.07 | 2.6 | 1.65 ± 0.06 | 2.9 | 2.18 ± 0.05 | 3.7 | 2.62 ± 0.05 | 4.2 | 0.59 ± 0.07 | 0.9 |
| 02292794–0053282 | – – | L0γ | 0.74 ± 0.14 | −0.1 | 1.31 ± 0.17 | 0.6 | 1.77 ± 0.10 | 1.3 | 2.16 ± 0.11 | 1.7 | 0.56 ± 0.17 | 0.7 |
| 02340093–6442068 | L0 γ | L0β γ | 0.88 ± 0.08 | 1.1 | 1.48 ± 0.09 | 1.7 | 2.08 ± 0.07 | 3.1 | 2.42 ± 0.07 | 3.1 | 0.59 ± 0.09 | 0.9 |
| 02411151–0326587 | L0γ | L1γ | 0.99 ± 0.08 | 2.0 | 1.76 ± 0.08 | 3.6 | 2.16 ± 0.07 | 3.6 | 2.54 ± 0.07 | 3.8 | 0.77 ± 0.07 | 2.4 |
| 03231002–4631237 | L0 γ | L0 γa | 1.07 ± 0.09 | 2.7 | 1.69 ± 0.09 | 3.1 | 2.31 ± 0.07 | 4.5 | 2.72 ± 0.07 | 4.7 | 0.62 ± 0.08 | 1.2 |
| 03420931–2904317 | – – | L0β | 0.57 ± 0.14 | −1.5 | 1.54 ± 0.12 | 2.1 | 1.95 ± 0.09 | 2.3 | 2.38 ± 0.09 | 2.9 | 0.98 ± 0.14 | 4.1 |
| 03572695–4417305 | L0β | L0β | 0.84 ± 0.04 | 0.7 | 1.46 ± 0.04 | 1.6 | 1.89 ± 0.04 | 2.0 | 2.28 ± 0.04 | 2.4 | 0.62 ± 0.04 | 1.2 |
| 04062677–3812102 | L0γ | L1γ | 1.06 ± 0.16 | 2.6 | 1.66 ± 0.17 | 2.9 | 2.32 ± 0.13 | 4.5 | 2.67 ± 0.13 | 4.4 | 0.60 ± 0.15 | 1.0 |
| 04400972–5126544 | – – | L0γ | 0.91 ± 0.09 | 1.3 | 1.51 ± 0.09 | 2.0 | 2.10 ± 0.07 | 3.2 | 2.49 ± 0.07 | 3.5 | 0.61 ± 0.08 | 1.1 |
| 06272161–5308428 | – – | L0βγ | 1.15 ± 0.15 | 3.3 | 1.70 ± 0.14 | 3.2 | 2.50 ± 0.12 | 5.6 | 2.88 ± 0.12 | 5.5 | 0.54 ± 0.13 | 0.5 |
| 11271382–3735076 | – – | L0δ | 0.90 ± 0.14 | 1.3 | 1.24 ± 0.18 | 0.1 | 2.01 ± 0.10 | 2.7 | 2.37 ± 0.11 | 2.8 | 0.34 ± 0.19 | −1.2 |
| 11544223–3400390 | L0β | L1β | 0.86 ± 0.04 | 1.0 | 1.35 ± 0.04 | 0.8 | 1.85 ± 0.04 | 1.7 | 2.16 ± 0.04 | 1.7 | 0.48 ± 0.04 | 0.0 |
| 12074836–3900043 | L0 γ | L1 γ | 0.89 ± 0.08 | 1.1 | 1.45 ± 0.08 | 1.6 | 1.86 ± 0.06 | 1.8 | 2.28 ± 0.06 | 2.4 | 0.57 ± 0.08 | 0.7 |
| 15525906+2948485 | L0β | L0β | 0.87 ± 0.03 | 1.0 | 1.46 ± 0.03 | 1.6 | 1.93 ± 0.03 | 2.3 | 2.27 ± 0.03 | 2.3 | 0.59 ± 0.04 | 0.9 |
| 17111353+2326333 | L0γ | L1β | 0.83 ± 0.04 | 0.7 | 1.44 ± 0.04 | 1.5 | 1.92 ± 0.03 | 2.2 | 2.27 ± 0.03 | 2.3 | 0.61 ± 0.04 | 1.1 |
| 19564700–7542270 | L0γ | L2γ | 1.12 ± 0.14 | 3.1 | 1.92 ± 0.12 | 4.7 | 2.46 ± 0.11 | 5.4 | 2.91 ± 0.11 | 5.7 | 0.81 ± 0.12 | 2.7 |
| 20334473–5635338 | – – | L0γ | 0.58 ± 0.14 | −1.4 | 1.47 ± 0.12 | 1.7 | 1.90 ± 0.09 | 2.1 | 2.30 ± 0.09 | 2.5 | 0.89 ± 0.14 | 3.4 |
| 22134491–2136079 | L0γ | L0γ | 0.97 ± 0.06 | 1.9 | 1.62 ± 0.05 | 2.6 | 2.15 ± 0.04 | 3.5 | 2.54 ± 0.04 | 3.8 | 0.64 ± 0.07 | 1.4 |
| 23153135+0617146 | L0γ | L0γ | 1.10 ± 0.11 | 3.0 | 1.79 ± 0.10 | 3.8 | 2.31 ± 0.09 | 4.5 | 2.77 ± 0.09 | 4.9 | 0.69 ± 0.09 | 1.7 |
| 23224684–3133231 | L0β | L2β | 0.79 ± 0.04 | 0.3 | 1.25 ± 0.04 | 0.2 | 1.60 ± 0.04 | 0.3 | 1.87 ± 0.04 | 0.2 | 0.47 ± 0.03 | −0.1 |
| 00040288–6410358 | L1 γ | L1 γa | 0.96 ± 0.10 | 1.0 | 1.78 ± 0.08 | 2.2 | 2.42 ± 0.08 | 3.4 | 2.85 ± 0.08 | 3.8 | 0.82 ± 0.09 | 2.2 |
| 00191296–6226005 | – – | L1 γ | 1.02 ± 0.08 | 1.5 | 1.68 ± 0.08 | 1.8 | 2.29 ± 0.07 | 2.8 | 2.76 ± 0.07 | 3.4 | 0.66 ± 0.07 | 0.9 |
| 00344300–4102266 | – – | L1β | 0.90 ± 0.09 | 0.6 | 1.62 ± 0.09 | 1.4 | 2.21 ± 0.07 | 2.4 | 2.61 ± 0.07 | 2.8 | 0.72 ± 0.09 | 1.4 |
| 00584253–0651239 | L0– | L1β | 0.87 ± 0.04 | 0.4 | 1.41 ± 0.04 | 0.3 | 1.75 ± 0.03 | 0.2 | 2.06 ± 0.04 | 0.4 | 0.54 ± 0.04 | 0.0 |
| 01174748–3403258 | L1 β | L1 βa | 0.97 ± 0.05 | 1.1 | 1.69 ± 0.05 | 1.8 | 2.15 ± 0.04 | 2.1 | 2.56 ± 0.04 | 2.5 | 0.72 ± 0.05 | 1.4 |
| 01205114–5200349 | – – | L1 γ | 0.98 ± 0.10 | 1.2 | 1.89 ± 0.09 | 2.8 | 2.41 ± 0.08 | 3.3 | 2.86 ± 0.08 | 3.9 | 0.91 ± 0.09 | 2.8 |
| 02410564–5511466 | – – | L1 γ | 1.06 ± 0.08 | 1.8 | 1.65 ± 0.07 | 1.6 | 2.20 ± 0.06 | 2.3 | 2.58 ± 0.06 | 2.6 | 0.59 ± 0.06 | 0.4 |
| 03164512–2848521 | L0– | L1β | 0.81 ± 0.05 | 0.0 | 1.46 ± 0.05 | 0.6 | 1.93 ± 0.05 | 1.0 | 2.27 ± 0.05 | 1.3 | 0.66 ± 0.05 | 0.9 |
| 05184616–2756457 | L1γ | L1γ | 0.97 ± 0.06 | 1.1 | 1.64 ± 0.06 | 1.5 | 2.22 ± 0.05 | 2.4 | 2.60 ± 0.05 | 2.7 | 0.68 ± 0.06 | 1.0 |
| 06023045+3910592 | L1– | L1β | 0.85 ± 0.03 | 0.3 | 1.44 ± 0.03 | 0.4 | 1.87 ± 0.03 | 0.7 | 2.18 ± 0.03 | 0.9 | 0.59 ± 0.03 | 0.4 |
| 07123786–6155528 | L1β | L1γ | 0.90 ± 0.07 | 0.7 | 1.63 ± 0.08 | 1.5 | 2.31 ± 0.07 | 2.8 | 2.67 ± 0.07 | 3.0 | 0.72 ± 0.06 | 1.4 |
| 10224821+5825453 | L1β | L1β | 0.86 ± 0.04 | 0.3 | 1.34 ± 0.03 | −0.1 | 1.74 ± 0.03 | 0.1 | 2.00 ± 0.03 | 0.1 | 0.48 ± 0.04 | −0.4 |
| 11083081+6830169 | L1γ | L1γ | 0.89 ± 0.03 | 0.6 | 1.54 ± 0.03 | 1.0 | 2.02 ± 0.03 | 1.5 | 2.37 ± 0.03 | 1.7 | 0.65 ± 0.03 | 0.9 |
| 11480096–2836488 | – – | L1β | 0.93 ± 0.11 | 0.8 | 1.55 ± 0.12 | 1.1 | 1.97 ± 0.08 | 1.3 | 2.34 ± 0.09 | 1.6 | 0.62 ± 0.12 | 0.6 |
| 19350976–6200473 | – – | L1γ | 0.96 ± 0.14 | 1.1 | 1.53 ± 0.14 | 0.9 | 2.20 ± 0.11 | 2.3 | 2.60 ± 0.11 | 2.8 | 0.57 ± 0.14 | 0.2 |
| 22351658–3844154 | – – | L1.5 γ | 0.91 ± 0.07 | 0.7 | 1.55 ± 0.07 | 1.1 | 2.18 ± 0.06 | 2.2 | 2.54 ± 0.06 | 2.5 | 0.64 ± 0.06 | 0.8 |
| 23255604–0259508 | L3– | L1γ | 1.03 ± 0.10 | 1.5 | 1.85 ± 0.10 | 2.6 | 2.27 ± 0.08 | 2.6 | 2.61 ± 0.08 | 2.8 | 0.82 ± 0.09 | 2.2 |
| 00452143+1634446 | L2β | L2γ | 1.00 ± 0.04 | 0.6 | 1.69 ± 0.03 | 0.9 | 2.29 ± 0.03 | 1.1 | 2.67 ± 0.03 | 1.2 | 0.69 ± 0.04 | 0.9 |
| 00550564+0134365 | L2γ | L2γ | 1.17 ± 0.14 | 1.8 | 2.00 ± 0.13 | 2.3 | 2.75 ± 0.12 | 2.8 | 3.23 ± 0.12 | 3.0 | 0.83 ± 0.10 | 2.2 |
| 03032042–7312300 | L2γ | – – | 1.04 ± 0.14 | 0.9 | 1.82 ± 0.14 | 1.5 | 2.36 ± 0.11 | 1.4 | 2.79 ± 0.11 | 1.6 | 0.78 ± 0.12 | 1.7 |
| 05104958–1843548 | – – | L2β | 1.01 ± 0.08 | 0.7 | 1.54 ± 0.08 | 0.1 | 2.10 ± 0.06 | 0.4 | 2.41 ± 0.06 | 0.4 | 0.53 ± 0.08 | −0.6 |
| 05361998–1920396 | L2γ | L2γ | 1.08 ± 0.10 | 1.2 | 1.92 ± 0.10 | 1.9 | 2.51 ± 0.08 | 1.9 | 2.98 ± 0.08 | 2.2 | 0.84 ± 0.09 | 2.3 |
| 20575409–0252302 | L1.5– | L2β | 0.85 ± 0.03 | −0.4 | 1.40 ± 0.03 | −0.5 | 1.86 ± 0.03 | −0.4 | 2.14 ± 0.03 | −0.4 | 0.54 ± 0.03 | −0.4 |
| 23225299–6151275 | L2 γ | L3 γa | 1.01 ± 0.09 | 0.7 | 1.69 ± 0.07 | 0.8 | 2.30 ± 0.07 | 1.2 | 2.70 ± 0.07 | 1.4 | 0.68 ± 0.07 | 0.8 |
| 01531463–6744181 | L2 – | L3 β | 1.30 ± 0.16 | 2.4 | 1.99 ± 0.17 | 1.7 | 2.70 ± 0.14 | 2.0 | 3.20 ± 0.14 | 2.3 | 0.69 ± 0.13 | 0.2 |
| 02583123–1520536 | – – | L3β | 1.04 ± 0.09 | 0.6 | 1.72 ± 0.09 | 0.5 | 2.29 ± 0.08 | 0.6 | 2.71 ± 0.08 | 0.9 | 0.67 ± 0.08 | 0.2 |
| 04185879–4507413 | – – | L3γ | 1.12 ± 0.11 | 1.1 | 1.57 ± 0.12 | −0.2 | 2.30 ± 0.09 | 0.7 | 2.71 ± 0.09 | 0.8 | 0.45 ± 0.11 | −1.3 |
| 06322402–5010349 | L3β | L4γ | 0.99 ± 0.06 | 0.2 | 1.69 ± 0.05 | 0.3 | 2.41 ± 0.05 | 1.0 | 2.86 ± 0.05 | 1.3 | 0.69 ± 0.05 | 0.3 |
| 09593276+4523309 | – – | L3γ | 1.12 ± 0.10 | 1.2 | 2.21 ± 0.08 | 2.7 | 3.02 ± 0.07 | 3.1 | 3.52 ± 0.07 | 3.2 | 1.09 ± 0.08 | 2.9 |
| G196-3B | L3β | L3γ | 1.18 ± 0.06 | 1.6 | 2.05 ± 0.06 | 2.0 | 3.13 ± 0.05 | 3.5 | 3.70 ± 0.05 | 3.8 | 0.87 ± 0.05 | 1.5 |
| 17260007+1538190 | L3.5γ | L3γ | 1.20 ± 0.08 | 1.7 | 2.01 ± 0.08 | 1.8 | 2.60 ± 0.07 | 1.7 | 2.98 ± 0.07 | 1.6 | 0.81 ± 0.07 | 1.0 |
| 20113196–5048112 | – – | L3γ | 1.17 ± 0.14 | 1.5 | 1.85 ± 0.14 | 1.1 | 2.41 ± 0.11 | 1.0 | 2.76 ± 0.12 | 1.0 | 0.68 ± 0.12 | 0.2 |
| 21265040–8140293 | L3γ | L3γ | 1.14 ± 0.08 | 1.3 | 1.99 ± 0.07 | 1.7 | 2.63 ± 0.06 | 1.8 | 3.07 ± 0.06 | 1.9 | 0.85 ± 0.07 | 1.4 |
| 22081363+2921215 | L3γ | L3γ | 1.00 ± 0.11 | 0.3 | 1.65 ± 0.11 | 0.2 | 2.44 ± 0.09 | 1.1 | 2.91 ± 0.09 | 1.4 | 0.64 ± 0.10 | 0.0 |
| 00011217+1535355 | – – | L4β | 1.02 ± 0.08 | −0.3 | 1.81 ± 0.07 | 0.3 | 2.58 ± 0.07 | 0.5 | 3.01 ± 0.07 | 0.7 | 0.80 ± 0.07 | 0.9 |
| 003323.86–1521309 | L4β | L1 | 1.08 ± 0.08 | 0.0 | 1.88 ± 0.07 | 0.5 | 2.49 ± 0.06 | 0.2 | 2.81 ± 0.06 | 0.2 | 0.80 ± 0.06 | 0.9 |
| 01262109+1428057 | L4γ | L2γ | 0.94 ± 0.31 | −0.8 | 1.83 ± 0.26 | 0.4 | 2.87 ± 0.22 | 1.4 | 3.41 ± 0.22 | 1.7 | 0.89 ± 0.26 | 1.6 |
| 03421621–6817321 | L4 γ | – – | 1.47 ± 0.16 | 2.3 | 2.31 ± 0.16 | 2.3 | 2.90 ± 0.14 | 1.5 | 3.37 ± 0.14 | 1.6 | 0.84 ± 0.12 | 1.2 |
| 05012406–0010452 | L4γ | L3γ | 1.27 ± 0.05 | 1.2 | 2.02 ± 0.05 | 1.1 | 2.93 ± 0.04 | 1.6 | 3.46 ± 0.04 | 1.8 | 0.75 ± 0.05 | 0.6 |
| 10212570–2830427 | – – | L4βγ | 1.06 ± 0.19 | 0.0 | 1.93 ± 0.20 | 0.8 | 2.76 ± 0.16 | 1.0 | 3.24 ± 0.16 | 1.2 | 0.87 ± 0.17 | 1.4 |
| 12563961–2718455 | – – | L4β | 1.04 ± 0.18 | −0.2 | 1.71 ± 0.16 | −0.1 | 2.33 ± 0.13 | −0.2 | 2.72 ± 0.13 | 0.0 | 0.67 ± 0.15 | 0.0 |
| 14252798–3650229 | L3– | L4γ | 1.17 ± 0.04 | 0.6 | 1.94 ± 0.04 | 0.8 | 2.75 ± 0.04 | 1.0 | 3.17 ± 0.03 | 1.1 | 0.77 ± 0.03 | 0.7 |
| 15382417–1953116 | L4γ | L4γ | 1.08 ± 0.09 | 0.1 | 1.93 ± 0.08 | 0.8 | 2.76 ± 0.07 | 1.1 | 3.21 ± 0.07 | 1.2 | 0.85 ± 0.08 | 1.3 |
| 15515237+0941148 | L4γ | >L5γ | 1.21 ± 0.13 | 0.8 | 2.01 ± 0.12 | 1.1 | 2.72 ± 0.11 | 0.9 | 3.20 ± 0.11 | 1.1 | 0.80 ± 0.09 | 1.0 |
| 16154255+4953211 | L4γ | L3-L6γ | 1.46 ± 0.17 | 2.3 | 2.48 ± 0.15 | 3.0 | 3.59 ± 0.14 | 3.5 | 4.17 ± 0.14 | 3.6 | 1.02 ± 0.12 | 2.5 |
| 18212815+1414010 | L4.5– | L4pec | 1.04 ± 0.03 | −0.2 | 1.78 ± 0.03 | 0.2 | 2.58 ± 0.03 | 0.5 | 2.96 ± 0.03 | 0.5 | 0.75 ± 0.03 | 0.5 |
| 21324036+1029494 | – – | L4β | 1.23 ± 0.18 | 0.9 | 1.96 ± 0.17 | 0.9 | 2.56 ± 0.14 | 0.5 | 3.02 ± 0.14 | 0.7 | 0.73 ± 0.15 | 0.4 |
| 21543454–1055308 | L4β | L5γ | 1.37 ± 0.15 | 1.8 | 2.24 ± 0.14 | 2.0 | 3.07 ± 0.12 | 2.0 | 3.52 ± 0.12 | 2.0 | 0.87 ± 0.11 | 1.4 |
| 22064498–4217208 | L4 γ | L4 γa | 1.11 ± 0.09 | 0.2 | 1.95 ± 0.09 | 0.8 | 2.73 ± 0.07 | 1.0 | 3.18 ± 0.07 | 1.1 | 0.84 ± 0.08 | 1.2 |
| 22495345+0044046 | L4γ | L3β | 1.17 ± 0.17 | 0.6 | 2.23 ± 0.14 | 1.9 | 3.01 ± 0.13 | 1.8 | 3.44 ± 0.13 | 1.8 | 1.06 ± 0.13 | 2.8 |
| 23433470–3646021 | – – | L3-L6γ | 1.56 ± 0.14 | 2.9 | 2.37 ± 0.14 | 2.5 | 3.45 ± 0.13 | 3.1 | 3.96 ± 0.13 | 3.0 | 0.82 ± 0.09 | 1.0 |
| 00303013–1450333 | L7– | L4-L6β | 1.01 ± 0.15 | −0.6 | 1.80 ± 0.15 | 0.2 | 2.62 ± 0.11 | 0.6 | 3.02 ± 0.12 | 0.6 | 0.79 ± 0.14 | 1.2 |
| 03264225–2102057 | L5 β | L5βγa | 1.34 ± 0.12 | 1.8 | 2.21 ± 0.11 | 2.1 | 3.18 ± 0.10 | 2.8 | 3.70 ± 0.10 | 2.9 | 0.87 ± 0.10 | 1.9 |
| 03552337+1133437 | L5γ | L3-L6γ | 1.52 ± 0.04 | 3.1 | 2.52 ± 0.03 | 3.5 | 3.52 ± 0.03 | 4.2 | 4.11 ± 0.03 | 4.3 | 1.00 ± 0.03 | 3.1 |
| 04210718–6306022 | L5β | L5γ | 1.28 ± 0.06 | 1.4 | 2.12 ± 0.06 | 1.7 | 3.01 ± 0.05 | 2.1 | 3.43 ± 0.05 | 2.0 | 0.83 ± 0.06 | 1.6 |
| 05120636–2949540 | L5γ | L5β | 1.31 ± 0.07 | 1.5 | 2.17 ± 0.07 | 1.9 | 3.09 ± 0.06 | 2.4 | 3.54 ± 0.06 | 2.4 | 0.87 ± 0.06 | 1.9 |
| 20025073–0521524 | L5β | L5-L7γ | 1.04 ± 0.07 | −0.4 | 1.90 ± 0.06 | 0.7 | 2.78 ± 0.05 | 1.2 | 3.23 ± 0.06 | 1.3 | 0.86 ± 0.06 | 1.8 |
| 00470038+6803543 | L7(γ?) | L6-L8γ | 1.64 ± 0.08 | 4.4 | 2.55 ± 0.07 | 4.6 | 3.73 ± 0.07 | 4.6 | 4.34 ± 0.07 | 4.4 | 0.91 ± 0.05 | 2.4 |
| 01033203+1935361 | L6β | L6β | 1.39 ± 0.10 | 1.4 | 2.14 ± 0.10 | 1.1 | 3.11 ± 0.08 | 1.3 | 3.59 ± 0.08 | 1.1 | 0.75 ± 0.08 | −0.1 |
| 08095903+4434216 | – – | L6p | 1.25 ± 0.15 | 0.7 | 2.02 ± 0.13 | 0.6 | 3.09 ± 0.12 | 1.2 | 3.63 ± 0.12 | 1.2 | 0.77 ± 0.11 | 0.0 |
| 08575849+5708514 | L8– | L8– | 1.25 ± 0.06 | 1.2 | 2.08 ± 0.05 | 1.9 | 3.02 ± 0.04 | 2.3 | 3.62 ± 0.04 | 2.1 | 0.83 ± 0.05 | 1.8 |
| 11193254–1137466 | – | L7γ | 1.67 ± 0.07 | 4.7 | 2.71 ± 0.06 | 5.6 | 3.91 ± 0.06 | 5.3 | 4.58 ± 0.06 | 5.2 | 1.04 ± 0.04 | 3.7 |
| 114724.10−204021.3 | – – | L7γ | 1.87 ± 0.13 | 6.4 | 2.77 ± 0.06 | 6.0 | 3.92 ± 0.06 | 5.3 | 4.55 ± 0.07 | 5.1 | 0.89 ± 0.11 | 2.1 |
| 17410280–4642218 | – – | L6-L8γ | 1.25 ± 0.09 | 1.2 | 2.35 ± 0.08 | 3.4 | 3.49 ± 0.08 | 3.6 | 4.11 ± 0.08 | 3.7 | 1.10 ± 0.06 | 4.4 |
| PSO318 | – – | L6-L8γ | 1.66 ± 0.09 | 4.6 | 2.85 ± 0.09 | 6.5 | 4.07 ± 0.08 | 5.9 | 4.82 ± 0.09 | 6.0 | 1.19 ± 0.06 | 5.4 |
| 22443167+2043433 | L6.5p – | L6-L8 γa | 1.48 ± 0.15 | 1.8 | 2.45 ± 0.16 | 2.2 | 3.70 ± 0.14 | 2.7 | 4.37 ± 0.14 | 2.6 | 0.98 ± 0.10 | 1.4 |
Notes.
A spectral type with a ? indicates questionable or extremely uncertain gravity features.
aValues are the number of σ (as reported in Table 15) from the field sequence that each object differs. A negative (−) number indicates that the color was blueward of the field sequence average, whereas a positive (+) number indicates that the color was redward of the field sequence average.Table 18. Infrared Colors of Low-gravity, Late-type M and L Dwarfs
| Name | SpT | SpT | (H–W1) | # of  a a |
(H–W2) | # of  a a |
(K–W1) | # of  a a |
(K–W2) | # of  a a |
(W1-W2) | # of  a a |
|---|---|---|---|---|---|---|---|---|---|---|---|---|
| (1) | (2) | (3) | (4) | (5) | (6) | (7) | (8) | (9) | (10) | (11) | (12) | (13) |
| 01231125–6921379 | M7.5γ | – – | 0.65 ± 0.03 | 1.1 | 0.89 ± 0.03 | 1.3 | 0.26 ± 0.03 | 0.7 | 0.51 ± 0.03 | 1.0 | 0.24 ± 0.03 | 0.5 |
| 01294256–0823580 | M5– | M7β | 0.54 ± 0.03 | −0.1 | 0.76 ± 0.03 | 0.0 | 0.23 ± 0.03 | 0.3 | 0.44 ± 0.03 | 0.3 | 0.22 ± 0.03 | 0.1 |
| 02501167–0151295 | – – | M7β | 0.59 ± 0.03 | 0.4 | 0.83 ± 0.03 | 0.7 | 0.22 ± 0.03 | 0.2 | 0.46 ± 0.03 | 0.5 | 0.24 ± 0.03 | 0.5 |
| 02530084+1652532 | – – | M7β | 0.56 ± 0.05 | 0.1 | 0.83 ± 0.04 | 0.7 | 0.26 ± 0.05 | 0.7 | 0.53 ± 0.05 | 1.2 | 0.27 ± 0.03 | 0.9 |
| 02535980+3206373 | M7β | M6β | 0.61 ± 0.03 | 0.6 | 0.80 ± 0.03 | 0.4 | 0.23 ± 0.03 | 0.3 | 0.42 ± 0.03 | 0.1 | 0.20 ± 0.03 | −0.2 |
| 03350208+2342356 | M8.5– | M7.5β | 0.61 ± 0.03 | 0.7 | 0.89 ± 0.03 | 1.3 | 0.22 ± 0.03 | 0.2 | 0.49 ± 0.02 | 0.8 | 0.28 ± 0.03 | 1.1 |
| 05181131–3101529 | M6.5– | M7β | 0.59 ± 0.03 | 0.5 | 0.83 ± 0.03 | 0.7 | 0.26 ± 0.03 | 0.7 | 0.50 ± 0.03 | 0.9 | 0.24 ± 0.03 | 0.5 |
| 05264316–1824315 | – – | M7β | 0.64 ± 0.03 | 0.9 | 0.89 ± 0.03 | 1.3 | 0.25 ± 0.03 | 0.5 | 0.50 ± 0.03 | 0.9 | 0.26 ± 0.03 | 0.8 |
| 05575096–1359503 | M7– | M7γ | 0.81 ± 0.03 | 2.9 | 1.34 ± 0.03 | 5.8 | 0.40 ± 0.03 | 2.2 | 0.93 ± 0.03 | 5.2 | 0.53 ± 0.03 | 5.4 |
| 07140394+3702459 | M8– | M7.5β | 0.69 ± 0.04 | 1.5 | 0.91 ± 0.03 | 1.5 | 0.27 ± 0.03 | 0.8 | 0.49 ± 0.03 | 0.8 | 0.22 ± 0.03 | 0.2 |
| 20391314–1126531 | M8– | M7β | 0.66 ± 0.04 | 1.3 | 0.96 ± 0.04 | 2.0 | 0.22 ± 0.04 | 0.2 | 0.51 ± 0.04 | 1.0 | 0.30 ± 0.03 | 1.5 |
| 00192626+4614078 | M8 – | M8 β | 0.68 ± 0.03 | 0.6 | 0.94 ± 0.03 | 0.8 | 0.24 ± 0.03 | 0.2 | 0.50 ± 0.02 | 0.6 | 0.26 ± 0.03 | 0.7 |
| 02212859–6831400 | M8β | – – | 0.80 ± 0.04 | 1.8 | 1.08 ± 0.04 | 2.0 | 0.33 ± 0.04 | 1.3 | 0.61 ± 0.04 | 1.6 | 0.28 ± 0.03 | 1.0 |
| 03550477–1032415 | M8.5– | M8.5β | 0.75 ± 0.03 | 1.3 | 1.04 ± 0.03 | 1.6 | 0.26 ± 0.03 | 0.5 | 0.55 ± 0.03 | 1.0 | 0.29 ± 0.03 | 1.1 |
| 04351455–1414468 | M8γ | M7γ | 0.91 ± 0.04 | 2.9 | 1.35 ± 0.03 | 4.3 | 0.24 ± 0.03 | 0.2 | 0.68 ± 0.03 | 2.2 | 0.44 ± 0.03 | 3.7 |
| 04362788–4114465 | M8 β | M9 γ | 0.69 ± 0.03 | 0.7 | 0.97 ± 0.03 | 1.1 | 0.31 ± 0.03 | 1.0 | 0.59 ± 0.03 | 1.4 | 0.28 ± 0.03 | 1.0 |
| 05341594–0631397 | M8γ | M8γ | 0.58 ± 0.10 | −0.4 | 1.11 ± 0.11 | 2.3 | 0.15 ± 0.10 | −0.7 | 0.68 ± 0.11 | 2.2 | 0.53 ± 0.07 | 5.2 |
| 06085283–2753583 | M8.5γ | L0γ | 0.92 ± 0.03 | 3.0 | 1.27 ± 0.03 | 3.6 | 0.39 ± 0.03 | 1.9 | 0.75 ± 0.03 | 2.8 | 0.35 ± 0.03 | 2.2 |
| 06524851–5741376 | M8β | – – | 0.81 ± 0.03 | 1.9 | 1.11 ± 0.03 | 2.2 | 0.30 ± 0.03 | 0.9 | 0.59 ± 0.03 | 1.4 | 0.30 ± 0.03 | 1.3 |
| 08561384–1342242 | – – | M8γ | 0.82 ± 0.04 | 2.0 | 1.36 ± 0.04 | 4.3 | 0.34 ± 0.03 | 1.3 | 0.87 ± 0.03 | 3.9 | 0.53 ± 0.03 | 5.2 |
| TWA28 | M8.5γ | M9γ | 0.92 ± 0.03 | 3.0 | 1.56 ± 0.03 | 6.0 | 0.46 ± 0.03 | 2.6 | 1.10 ± 0.03 | 6.0 | 0.64 ± 0.03 | 7.0 |
| TWA27A | M8γ | M8γ | 0.83 ± 0.04 | 2.1 | 1.38 ± 0.04 | 4.5 | 0.39 ± 0.04 | 1.9 | 0.94 ± 0.04 | 4.6 | 0.55 ± 0.03 | 5.4 |
| 12271545–0636458 | M9– | M8.5β | 0.87 ± 0.04 | 2.5 | 1.13 ± 0.04 | 2.4 | 0.37 ± 0.05 | 1.6 | 0.63 ± 0.04 | 1.7 | 0.26 ± 0.04 | 0.6 |
| 15291017+6312539 | – – | M8β | 0.65 ± 0.04 | 0.3 | 0.88 ± 0.04 | 0.3 | 0.26 ± 0.03 | 0.5 | 0.50 ± 0.03 | 0.5 | 0.23 ± 0.03 | 0.2 |
| 20282203–5637024 | – – | M8.5γ | 0.77 ± 0.03 | 1.5 | 1.07 ± 0.04 | 1.9 | 0.24 ± 0.03 | 0.2 | 0.54 ± 0.04 | 0.9 | 0.30 ± 0.03 | 1.3 |
| 22353560–5906306 | – – | M8.5 β | 0.90 ± 0.04 | 2.8 | 1.23 ± 0.05 | 3.2 | 0.48 ± 0.04 | 2.9 | 0.81 ± 0.04 | 3.3 | 0.33 ± 0.04 | 1.8 |
| 23231347–0244360 | M8.5– | M8β | 0.69 ± 0.04 | 0.7 | 0.97 ± 0.04 | 1.1 | 0.24 ± 0.04 | 0.3 | 0.53 ± 0.04 | 0.8 | 0.28 ± 0.03 | 1.0 |
| 23520507–1100435 | M7– | M8β | 0.73 ± 0.03 | 1.1 | 1.02 ± 0.03 | 1.5 | 0.30 ± 0.03 | 0.9 | 0.60 ± 0.03 | 1.4 | 0.29 ± 0.03 | 1.2 |
| 00274197+0503417 | M9.5β | L0β | 0.67 ± 0.11 | −0.5 | 1.15 ± 0.11 | 1.3 | 0.34 ± 0.12 | 0.8 | 0.83 ± 0.13 | 2.3 | 0.48 ± 0.06 | 4.1 |
| 00381489–6403529 | – – | M9.5β | 0.96 ± 0.05 | 2.2 | 1.33 ± 0.05 | 2.5 | 0.49 ± 0.04 | 2.3 | 0.86 ± 0.04 | 2.5 | 0.37 ± 0.03 | 2.1 |
| 00425923+1142104 | – – | M9β | 0.84 ± 0.05 | 1.1 | 1.16 ± 0.05 | 1.3 | 0.28 ± 0.04 | 0.2 | 0.60 ± 0.04 | 0.6 | 0.32 ± 0.04 | 1.3 |
| 00464841+0715177 | M9β | L0δ | 1.11 ± 0.04 | 3.5 | 1.54 ± 0.04 | 3.9 | 0.48 ± 0.04 | 2.2 | 0.91 ± 0.03 | 2.9 | 0.43 ± 0.03 | 3.2 |
| 02215494–5412054 | M9 β | – – | 0.90 ± 0.04 | 1.6 | 1.26 ± 0.04 | 2.0 | 0.35 ± 0.04 | 0.9 | 0.71 ± 0.04 | 1.4 | 0.36 ± 0.03 | 2.0 |
| 02251947–5837295 | M9β | M9γ | 0.82 ± 0.03 | 0.9 | 1.13 ± 0.03 | 1.1 | 0.33 ± 0.04 | 0.7 | 0.63 ± 0.03 | 0.9 | 0.31 ± 0.03 | 1.1 |
| 03393521–3525440 | M9β | L0β | 0.88 ± 0.03 | 1.5 | 1.21 ± 0.03 | 1.7 | 0.42 ± 0.03 | 1.6 | 0.74 ± 0.03 | 1.7 | 0.32 ± 0.03 | 1.4 |
| 04433761+0002051 | M9γ | M9γ | 0.98 ± 0.03 | 2.3 | 1.33 ± 0.03 | 2.5 | 0.39 ± 0.03 | 1.3 | 0.74 ± 0.03 | 1.7 | 0.35 ± 0.03 | 1.8 |
| 04493288+1607226 | – – | M9γ | 0.76 ± 0.04 | 0.4 | 1.07 ± 0.04 | 0.7 | 0.35 ± 0.04 | 0.9 | 0.65 ± 0.04 | 1.0 | 0.31 ± 0.04 | 1.1 |
| 05402325–0906326 | – – | M9β | 0.82 ± 0.04 | 0.9 | 1.11 ± 0.04 | 1.0 | 0.30 ± 0.05 | 0.4 | 0.59 ± 0.05 | 0.5 | 0.29 ± 0.04 | 0.8 |
| 09451445–7753150 | – – | M9β | 0.72 ± 0.04 | 0.0 | 0.95 ± 0.04 | 0.0 | 0.28 ± 0.04 | 0.2 | 0.51 ± 0.04 | 0.0 | 0.23 ± 0.03 | −0.1 |
| 09532126–1014205 | M9γ | M9β | 0.89 ± 0.03 | 1.5 | 1.24 ± 0.03 | 1.9 | 0.38 ± 0.03 | 1.2 | 0.74 ± 0.03 | 1.6 | 0.35 ± 0.03 | 1.9 |
| 10220489+0200477 | M9β | M9β | 0.79 ± 0.04 | 0.6 | 1.06 ± 0.04 | 0.7 | 0.29 ± 0.04 | 0.3 | 0.56 ± 0.04 | 0.4 | 0.27 ± 0.04 | 0.5 |
| 11064461–3715115 | – – | M9γ | 0.77 ± 0.04 | 0.5 | 1.09 ± 0.04 | 0.9 | 0.27 ± 0.05 | 0.1 | 0.59 ± 0.05 | 0.5 | 0.32 ± 0.04 | 1.3 |
| TWA26 | M9γ | M9γ | 0.84 ± 0.03 | 1.1 | 1.20 ± 0.03 | 1.6 | 0.35 ± 0.03 | 0.9 | 0.71 ± 0.03 | 1.4 | 0.36 ± 0.03 | 2.0 |
| TWA29 | M9.5γ | L0γ | 0.81 ± 0.04 | 0.8 | 1.18 ± 0.04 | 1.4 | 0.38 ± 0.04 | 1.2 | 0.75 ± 0.04 | 1.7 | 0.37 ± 0.03 | 2.2 |
| 12474428–3816464 | – – | M9γ | 0.99 ± 0.04 | 2.4 | 1.57 ± 0.04 | 4.1 | 0.47 ± 0.05 | 2.1 | 1.05 ± 0.05 | 3.9 | 0.59 ± 0.03 | 5.8 |
| 12535039–4211215 | – – | M9.5γ | 1.02 ± 0.11 | 2.7 | 1.38 ± 0.11 | 2.8 | 0.46 ± 0.11 | 2.0 | 0.82 ± 0.11 | 2.2 | 0.36 ± 0.05 | 2.0 |
| 14112131–2119503 | M9β | M8β | 0.75 ± 0.03 | 0.3 | 1.01 ± 0.03 | 0.3 | 0.25 ± 0.03 | −0.1 | 0.52 ± 0.03 | 0.0 | 0.26 ± 0.03 | 0.4 |
| 15104786–2818174 | M9– | M9β | 0.80 ± 0.04 | 0.7 | 1.10 ± 0.04 | 0.9 | 0.37 ± 0.04 | 1.1 | 0.67 ± 0.04 | 1.2 | 0.30 ± 0.03 | 1.0 |
| 15470557–1626303A | – – | M9β | 0.81 ± 0.04 | 0.8 | 1.10 ± 0.04 | 0.9 | 0.30 ± 0.04 | 0.4 | 0.59 ± 0.04 | 0.6 | 0.29 ± 0.04 | 0.9 |
| 15474719–2423493 | M9γ | L0β | 0.86 ± 0.04 | 1.3 | 1.17 ± 0.05 | 1.4 | 0.33 ± 0.03 | 0.7 | 0.64 ± 0.04 | 0.9 | 0.30 ± 0.04 | 1.0 |
| 15575011–2952431 | M9δ | L1γ | 1.02 ± 0.11 | 2.7 | 1.38 ± 0.12 | 2.8 | 0.41 ± 0.12 | 1.5 | 0.78 ± 0.13 | 2.0 | 0.37 ± 0.07 | 2.2 |
| 19355595–2846343 | M9γ | M9γ | 0.83 ± 0.03 | 1.0 | 1.27 ± 0.03 | 2.1 | 0.36 ± 0.04 | 1.0 | 0.80 ± 0.04 | 2.1 | 0.44 ± 0.04 | 3.3 |
| 20004841–7523070 | M9 γ | M9 γa | 0.86 ± 0.03 | 1.3 | 1.17 ± 0.03 | 1.4 | 0.40 ± 0.03 | 1.4 | 0.71 ± 0.03 | 1.4 | 0.31 ± 0.03 | 1.2 |
| 20135152–2806020 | M9γ | L0γ | 0.94 ± 0.04 | 2.0 | 1.30 ± 0.04 | 2.3 | 0.41 ± 0.04 | 1.5 | 0.78 ± 0.04 | 1.9 | 0.36 ± 0.04 | 2.0 |
| 21544859–7459134 | – – | M9.5 β | 0.86 ± 0.05 | 1.3 | 1.19 ± 0.05 | 1.5 | 0.38 ± 0.04 | 1.2 | 0.71 ± 0.04 | 1.4 | 0.33 ± 0.04 | 1.5 |
| 21572060+8340575 | L0– | M9γ | 0.98 ± 0.04 | 2.3 | 1.39 ± 0.04 | 2.8 | 0.50 ± 0.03 | 2.4 | 0.90 ± 0.03 | 2.8 | 0.41 ± 0.03 | 2.8 |
| 22025794–5605087 | – – | M9γ | 0.81 ± 0.04 | 0.8 | 1.06 ± 0.04 | 0.7 | 0.35 ± 0.04 | 0.9 | 0.61 ± 0.04 | 0.7 | 0.25 ± 0.04 | 0.2 |
| 23360735–3541489 | – – | M9β | 0.81 ± 0.03 | 0.8 | 1.16 ± 0.04 | 1.3 | 0.38 ± 0.05 | 1.2 | 0.74 ± 0.05 | 1.6 | 0.36 ± 0.04 | 1.9 |
| 23453903+0055137 | M9– | M9β | 0.91 ± 0.04 | 1.7 | 1.24 ± 0.03 | 1.9 | 0.37 ± 0.04 | 1.1 | 0.70 ± 0.04 | 1.4 | 0.33 ± 0.03 | 1.6 |
| 00182834–6703130 | – – | L0γ | 1.31 ± 0.07 | 3.8 | 1.71 ± 0.07 | 3.7 | 0.54 ± 0.05 | 1.7 | 0.94 ± 0.05 | 2.6 | 0.40 ± 0.04 | 1.7 |
| 00325584–4405058 | L0γ | L0β | 1.04 ± 0.04 | 1.7 | 1.37 ± 0.04 | 1.7 | 0.45 ± 0.04 | 0.9 | 0.78 ± 0.04 | 1.3 | 0.33 ± 0.04 | 0.8 |
| 00374306–5846229 | L0γ | – – | 1.13 ± 0.06 | 2.5 | 1.52 ± 0.06 | 2.6 | 0.47 ± 0.05 | 1.0 | 0.85 ± 0.05 | 1.9 | 0.39 ± 0.04 | 1.5 |
| 01244599–5745379 | L0γ | L0γ | 1.29 ± 0.09 | 3.7 | 1.72 ± 0.09 | 3.7 | 0.55 ± 0.09 | 1.7 | 0.98 ± 0.09 | 2.8 | 0.43 ± 0.04 | 2.0 |
| 01415823–4633574 | L0 γ | L0 γ | 1.32 ± 0.03 | 4.0 | 1.71 ± 0.03 | 3.7 | 0.55 ± 0.04 | 1.7 | 0.93 ± 0.04 | 2.5 | 0.38 ± 0.03 | 1.4 |
| 02103857–3015313 | L0 γ | L0 γa | 1.16 ± 0.05 | 2.7 | 1.51 ± 0.05 | 2.5 | 0.50 ± 0.05 | 1.3 | 0.85 ± 0.05 | 1.8 | 0.35 ± 0.04 | 1.0 |
| 02235464–5815067 | L0γ | – – | 1.18 ± 0.04 | 2.9 | 1.57 ± 0.04 | 2.9 | 0.60 ± 0.05 | 2.2 | 0.99 ± 0.05 | 2.9 | 0.39 ± 0.03 | 1.5 |
| 02265658–5327032 | – – | L0δ | 1.13 ± 0.06 | 2.4 | 1.56 ± 0.06 | 2.8 | 0.53 ± 0.05 | 1.6 | 0.97 ± 0.05 | 2.8 | 0.44 ± 0.04 | 2.1 |
| 02292794–0053282 | – – | L0γ | 1.03 ± 0.10 | 1.7 | 1.42 ± 0.11 | 2.0 | 0.46 ± 0.14 | 1.0 | 0.85 ± 0.15 | 1.9 | 0.39 ± 0.06 | 1.5 |
| 02340093–6442068 | L0 γ | L0β γ | 1.20 ± 0.06 | 3.0 | 1.54 ± 0.06 | 2.7 | 0.60 ± 0.07 | 2.2 | 0.95 ± 0.07 | 2.6 | 0.34 ± 0.04 | 0.9 |
| 02411151–0326587 | L0γ | L1γ | 1.17 ± 0.06 | 2.8 | 1.56 ± 0.06 | 2.8 | 0.40 ± 0.06 | 0.5 | 0.78 ± 0.06 | 1.3 | 0.38 ± 0.04 | 1.4 |
| 03231002–4631237 | L0γ | L0 γa | 1.25 ± 0.07 | 3.4 | 1.66 ± 0.07 | 3.4 | 0.63 ± 0.06 | 2.4 | 1.04 ± 0.06 | 3.3 | 0.41 ± 0.03 | 1.8 |
| 03420931–2904317 | – – | L0β | 1.38 ± 0.11 | 4.4 | 1.81 ± 0.11 | 4.3 | 0.41 ± 0.09 | 0.6 | 0.84 ± 0.09 | 1.8 | 0.43 ± 0.04 | 2.0 |
| 03572695–4417305 | L0β | L0β | 1.06 ± 0.03 | 1.9 | 1.45 ± 0.03 | 2.1 | 0.44 ± 0.03 | 0.8 | 0.82 ± 0.03 | 1.6 | 0.39 ± 0.03 | 1.5 |
| 04062677–3812102 | L0γ | L1γ | 1.26 ± 0.11 | 3.5 | 1.61 ± 0.11 | 3.1 | 0.66 ± 0.12 | 2.7 | 1.01 ± 0.12 | 3.1 | 0.35 ± 0.05 | 1.0 |
| 04400972–5126544 | – – | L0γ | 1.19 ± 0.06 | 3.0 | 1.59 ± 0.06 | 3.0 | 0.59 ± 0.06 | 2.0 | 0.98 ± 0.07 | 2.8 | 0.39 ± 0.04 | 1.5 |
| 06272161–5308428 | – – | L0βγ | 1.35 ± 0.09 | 4.2 | 1.73 ± 0.10 | 3.8 | 0.81 ± 0.09 | 3.9 | 1.19 ± 0.09 | 4.4 | 0.38 ± 0.04 | 1.4 |
| 11271382–3735076 | – – | L0δ | 1.11 ± 0.11 | 2.3 | 1.47 ± 0.12 | 2.3 | 0.77 ± 0.16 | 3.6 | 1.13 ± 0.16 | 4.0 | 0.36 ± 0.06 | 1.1 |
| 11544223–3400390 | L0β | L1β | 0.98 ± 0.04 | 1.3 | 1.29 ± 0.04 | 1.3 | 0.50 ± 0.04 | 1.3 | 0.81 ± 0.04 | 1.6 | 0.31 ± 0.03 | 0.5 |
| 12074836–3900043 | L0 γ | L1 γ | 0.97 ± 0.06 | 1.3 | 1.39 ± 0.06 | 1.8 | 0.41 ± 0.07 | 0.5 | 0.82 ± 0.07 | 1.7 | 0.42 ± 0.04 | 1.9 |
| 15525906+2948485 | L0β | L0β | 1.06 ± 0.03 | 1.9 | 1.40 ± 0.03 | 1.9 | 0.48 ± 0.03 | 1.1 | 0.81 ± 0.03 | 1.6 | 0.34 ± 0.03 | 0.8 |
| 17111353+2326333 | L0γ | L1β | 1.09 ± 0.04 | 2.1 | 1.44 ± 0.04 | 2.1 | 0.48 ± 0.04 | 1.2 | 0.83 ± 0.04 | 1.7 | 0.35 ± 0.03 | 1.1 |
| 19564700–7542270 | L0γ | L2γ | 1.34 ± 0.10 | 4.1 | 1.79 ± 0.10 | 4.2 | 0.54 ± 0.07 | 1.6 | 0.98 ± 0.07 | 2.9 | 0.44 ± 0.04 | 2.2 |
| 20334473–5635338 | – – | L0γ | 1.32 ± 0.11 | 3.9 | 1.72 ± 0.11 | 3.8 | 0.43 ± 0.09 | 0.7 | 0.83 ± 0.09 | 1.7 | 0.40 ± 0.04 | 1.7 |
| 22134491–2136079 | L0γ | L0γ | 1.18 ± 0.06 | 2.8 | 1.57 ± 0.06 | 2.9 | 0.53 ± 0.05 | 1.6 | 0.93 ± 0.05 | 2.4 | 0.40 ± 0.04 | 1.6 |
| 23153135+0617146 | L0γ | L0γ | 1.21 ± 0.07 | 3.0 | 1.66 ± 0.08 | 3.4 | 0.52 ± 0.07 | 1.5 | 0.98 ± 0.07 | 2.8 | 0.46 ± 0.04 | 2.3 |
| 23224684–3133231 | L0β | L2β | 0.82 ± 0.03 | 0.0 | 1.08 ± 0.03 | 0.0 | 0.35 ± 0.03 | 0.1 | 0.62 ± 0.03 | 0.1 | 0.27 ± 0.03 | 0.0 |
| 00040288–6410358 | L1 γ | L1 γa | 1.46 ± 0.08 | 3.7 | 1.89 ± 0.08 | 4.0 | 0.64 ± 0.05 | 2.5 | 1.07 ± 0.05 | 3.2 | 0.43 ± 0.04 | 2.9 |
| 00191296–6226005 | – – | L1 γ | 1.27 ± 0.06 | 2.4 | 1.74 ± 0.06 | 3.1 | 0.61 ± 0.06 | 2.1 | 1.07 ± 0.06 | 3.2 | 0.47 ± 0.04 | 3.5 |
| 00344300–4102266 | – – | L1β | 1.31 ± 0.07 | 2.7 | 1.71 ± 0.07 | 3.0 | 0.59 ± 0.06 | 2.0 | 0.99 ± 0.06 | 2.5 | 0.40 ± 0.04 | 2.3 |
| 00584253–0651239 | L0– | L1β | 0.88 ± 0.04 | −0.2 | 1.20 ± 0.04 | 0.1 | 0.34 ± 0.04 | −0.3 | 0.66 ± 0.04 | 0.2 | 0.31 ± 0.04 | 0.9 |
| 01174748–3403258 | L1 β | L1 βa | 1.18 ± 0.05 | 1.8 | 1.59 ± 0.05 | 2.3 | 0.46 ± 0.04 | 0.8 | 0.87 ± 0.04 | 1.7 | 0.41 ± 0.04 | 2.4 |
| 01205114–5200349 | – – | L1 γ | 1.43 ± 0.08 | 3.5 | 1.88 ± 0.08 | 4.0 | 0.52 ± 0.06 | 1.4 | 0.97 ± 0.06 | 2.5 | 0.45 ± 0.04 | 3.2 |
| 02410564–5511466 | – – | L1 γ | 1.14 ± 0.06 | 1.5 | 1.52 ± 0.06 | 1.9 | 0.55 ± 0.04 | 1.7 | 0.93 ± 0.05 | 2.1 | 0.38 ± 0.03 | 1.9 |
| 03164512–2848521 | L0– | L1β | 1.12 ± 0.04 | 1.4 | 1.46 ± 0.04 | 1.6 | 0.47 ± 0.04 | 0.9 | 0.80 ± 0.04 | 1.2 | 0.34 ± 0.03 | 1.3 |
| 05184616–2756457 | L1γ | L1γ | 1.25 ± 0.05 | 2.3 | 1.63 ± 0.05 | 2.6 | 0.57 ± 0.05 | 1.9 | 0.96 ± 0.05 | 2.4 | 0.38 ± 0.04 | 2.1 |
| 06023045+3910592 | L1– | L1β | 1.02 ± 0.03 | 0.7 | 1.33 ± 0.03 | 0.9 | 0.43 ± 0.03 | 0.5 | 0.74 ± 0.03 | 0.8 | 0.31 ± 0.03 | 0.8 |
| 07123786–6155528 | L1β | L1γ | 1.40 ± 0.05 | 3.3 | 1.77 ± 0.05 | 3.3 | 0.68 ± 0.05 | 2.8 | 1.04 ± 0.05 | 3.0 | 0.37 ± 0.03 | 1.8 |
| 10224821+5825453 | L1β | L1β | 0.88 ± 0.04 | −0.2 | 1.15 ± 0.04 | −0.1 | 0.40 ± 0.03 | 0.3 | 0.66 ± 0.03 | 0.2 | 0.27 ± 0.03 | 0.1 |
| 11083081+6830169 | L1γ | L1γ | 1.13 ± 0.03 | 1.5 | 1.48 ± 0.03 | 1.7 | 0.48 ± 0.03 | 1.0 | 0.83 ± 0.03 | 1.4 | 0.35 ± 0.03 | 1.5 |
| 11480096–2836488 | – – | L1β | 1.05 ± 0.09 | 0.9 | 1.41 ± 0.09 | 1.3 | 0.42 ± 0.09 | 0.5 | 0.79 ± 0.09 | 1.1 | 0.37 ± 0.05 | 1.8 |
| 19350976–6200473 | – – | L1γ | 1.23 ± 0.10 | 2.2 | 1.64 ± 0.10 | 2.6 | 0.67 ± 0.10 | 2.7 | 1.07 ± 0.11 | 3.2 | 0.41 ± 0.05 | 2.5 |
| 22351658–3844154 | – – | L1.5 γ | 1.27 ± 0.05 | 2.4 | 1.63 ± 0.05 | 2.5 | 0.62 ± 0.05 | 2.3 | 0.98 ± 0.05 | 2.5 | 0.36 ± 0.04 | 1.7 |
| 23255604–0259508 | L3– | L1γ | 1.24 ± 0.07 | 2.2 | 1.59 ± 0.08 | 2.3 | 0.42 ± 0.06 | 0.5 | 0.77 ± 0.07 | 1.0 | 0.35 ± 0.04 | 1.4 |
| 00452143+1634446 | L2β | L2γ | 1.29 ± 0.04 | 1.4 | 1.67 ± 0.04 | 1.5 | 0.60 ± 0.03 | 1.3 | 0.98 ± 0.03 | 1.5 | 0.38 ± 0.03 | 1.2 |
| 00550564+0134365 | L2γ | L2γ | 1.59 ± 0.08 | 3.2 | 2.07 ± 0.08 | 3.3 | 0.76 ± 0.07 | 2.6 | 1.24 ± 0.08 | 3.1 | 0.48 ± 0.04 | 2.7 |
| 03032042–7312300 | L2γ | – – | 1.32 ± 0.09 | 1.6 | 1.75 ± 0.09 | 1.8 | 0.54 ± 0.09 | 0.8 | 0.97 ± 0.09 | 1.4 | 0.43 ± 0.04 | 2.0 |
| 05104958–1843548 | – – | L2β | 1.09 ± 0.06 | 0.2 | 1.40 ± 0.06 | 0.3 | 0.56 ± 0.06 | 0.9 | 0.87 ± 0.06 | 0.8 | 0.32 ± 0.04 | 0.4 |
| 05361998–1920396 | L2γ | L2γ | 1.43 ± 0.07 | 2.2 | 1.90 ± 0.08 | 2.6 | 0.59 ± 0.07 | 1.1 | 1.06 ± 0.07 | 2.0 | 0.47 ± 0.04 | 2.6 |
| 20575409–0252302 | L1.5– | L2β | 1.01 ± 0.03 | −0.3 | 1.29 ± 0.03 | −0.2 | 0.46 ± 0.03 | 0.1 | 0.74 ± 0.03 | 0.0 | 0.28 ± 0.03 | −0.1 |
| 23225299–6151275 | L2 γ | L3 γa | 1.29 ± 0.07 | 1.4 | 1.69 ± 0.07 | 1.6 | 0.62 ± 0.05 | 1.4 | 1.02 ± 0.05 | 1.7 | 0.40 ± 0.04 | 1.6 |
| 01531463–6744181 | L2 – | L3 β | 1.40 ± 0.09 | 1.2 | 1.89 ± 0.09 | 1.8 | 0.71 ± 0.11 | 1.4 | 1.21 ± 0.11 | 2.2 | 0.50 ± 0.04 | 3.1 |
| 02583123–1520536 | – – | L3β | 1.24 ± 0.07 | 0.4 | 1.67 ± 0.07 | 0.8 | 0.57 ± 0.06 | 0.4 | 1.00 ± 0.06 | 1.0 | 0.43 ± 0.04 | 2.0 |
| 04185879–4507413 | – – | L3γ | 1.18 ± 0.08 | 0.1 | 1.59 ± 0.08 | 0.5 | 0.73 ± 0.09 | 1.6 | 1.14 ± 0.09 | 1.8 | 0.41 ± 0.04 | 1.7 |
| 06322402–5010349 | L3β | L4γ | 1.42 ± 0.04 | 1.3 | 1.86 ± 0.04 | 1.6 | 0.73 ± 0.04 | 1.6 | 1.17 ± 0.04 | 1.9 | 0.44 ± 0.03 | 2.2 |
| 09593276+4523309 | – – | L3γ | 1.90 ± 0.07 | 3.7 | 2.40 ± 0.07 | 3.9 | 0.81 ± 0.05 | 2.2 | 1.31 ± 0.05 | 2.7 | 0.50 ± 0.04 | 3.1 |
| G196-3B | L3β | L3γ | 1.95 ± 0.05 | 3.9 | 2.51 ± 0.05 | 4.4 | 1.08 ± 0.04 | 4.1 | 1.64 ± 0.04 | 4.6 | 0.57 ± 0.03 | 4.3 |
| 17260007+1538190 | L3.5γ | L3γ | 1.39 ± 0.05 | 1.2 | 1.77 ± 0.05 | 1.3 | 0.59 ± 0.06 | 0.6 | 0.97 ± 0.06 | 0.8 | 0.38 ± 0.04 | 1.1 |
| 20113196–5048112 | – – | L3γ | 1.25 ± 0.09 | 0.4 | 1.59 ± 0.09 | 0.5 | 0.57 ± 0.09 | 0.4 | 0.91 ± 0.09 | 0.5 | 0.34 ± 0.05 | 0.5 |
| 21265040–8140293 | L3γ | L3γ | 1.50 ± 0.06 | 1.7 | 1.93 ± 0.06 | 1.9 | 0.64 ± 0.05 | 0.9 | 1.08 ± 0.05 | 1.4 | 0.44 ± 0.03 | 2.1 |
| 22081363+2921215 | L3γ | L3γ | 1.44 ± 0.08 | 1.4 | 1.91 ± 0.08 | 1.8 | 0.80 ± 0.08 | 2.0 | 1.26 ± 0.08 | 2.5 | 0.47 ± 0.04 | 2.6 |
| 00011217+1535355 | – – | L4β | 1.57 ± 0.06 | 0.9 | 1.99 ± 0.06 | 1.1 | 0.77 ± 0.05 | 0.7 | 1.19 ± 0.05 | 1.0 | 0.42 ± 0.03 | 1.2 |
| 003323.86–1521309 | L4β | L1 | 1.41 ± 0.06 | 0.3 | 1.73 ± 0.06 | 0.2 | 0.61 ± 0.05 | −0.5 | 0.93 ± 0.05 | −0.4 | 0.32 ± 0.04 | −0.3 |
| 01262109+1428057 | L4γ | L2γ | 1.94 ± 0.22 | 2.5 | 2.47 ± 0.22 | 2.8 | 1.04 ± 0.15 | 2.6 | 1.58 ± 0.15 | 3.2 | 0.54 ± 0.05 | 2.8 |
| 03421621–6817321 | L4 γ | – – | 1.43 ± 0.09 | 0.4 | 1.90 ± 0.09 | 0.8 | 0.59 ± 0.09 | −0.7 | 1.06 ± 0.09 | 0.3 | 0.47 ± 0.04 | 1.9 |
| 05012406–0010452 | L4γ | L3γ | 1.66 ± 0.04 | 1.3 | 2.20 ± 0.04 | 1.8 | 0.91 ± 0.04 | 1.6 | 1.44 ± 0.04 | 2.4 | 0.53 ± 0.03 | 2.7 |
| 10212570–2830427 | – – | L4βγ | 1.69 ± 0.12 | 1.5 | 2.17 ± 0.12 | 1.7 | 0.82 ± 0.13 | 1.0 | 1.30 ± 0.13 | 1.6 | 0.48 ± 0.05 | 2.0 |
| 12563961–2718455 | – – | L4β | 1.29 ± 0.12 | −0.2 | 1.68 ± 0.13 | 0.0 | 0.62 ± 0.10 | −0.4 | 1.01 ± 0.10 | 0.0 | 0.39 ± 0.04 | 0.8 |
| 14252798–3650229 | L3– | L4γ | 1.58 ± 0.03 | 1.0 | 2.00 ± 0.03 | 1.1 | 0.81 ± 0.03 | 0.9 | 1.23 ± 0.03 | 1.2 | 0.42 ± 0.03 | 1.2 |
| 15382417–1953116 | L4γ | L4γ | 1.68 ± 0.07 | 1.4 | 2.13 ± 0.07 | 1.6 | 0.83 ± 0.06 | 1.1 | 1.28 ± 0.06 | 1.5 | 0.45 ± 0.04 | 1.6 |
| 15515237+0941148 | L4γ | >L5γ | 1.51 ± 0.08 | 0.7 | 1.99 ± 0.08 | 1.1 | 0.71 ± 0.06 | 0.2 | 1.19 ± 0.06 | 1.0 | 0.48 ± 0.04 | 2.0 |
| 16154255+4953211 | L4γ | L3-L6γ | 2.13 ± 0.10 | 3.3 | 2.71 ± 0.10 | 3.6 | 1.11 ± 0.07 | 3.1 | 1.69 ± 0.07 | 3.8 | 0.58 ± 0.03 | 3.4 |
| 18212815+1414010 | L4.5– | L4pec | 1.54 ± 0.03 | 0.8 | 1.92 ± 0.03 | 0.9 | 0.80 ± 0.03 | 0.8 | 1.18 ± 0.03 | 0.9 | 0.38 ± 0.03 | 0.5 |
| 21324036+1029494 | – – | L4β | 1.34 ± 0.12 | 0.0 | 1.79 ± 0.12 | 0.4 | 0.60 ± 0.11 | −0.5 | 1.06 ± 0.11 | 0.3 | 0.45 ± 0.05 | 1.6 |
| 21543454–1055308 | L4β | L5γ | 1.70 ± 0.09 | 1.5 | 2.15 ± 0.09 | 1.7 | 0.83 ± 0.07 | 1.1 | 1.28 ± 0.07 | 1.5 | 0.45 ± 0.04 | 1.6 |
| 22064498–4217208 | L4 γ | L4 γa | 1.62 ± 0.07 | 1.2 | 2.07 ± 0.07 | 1.4 | 0.79 ± 0.06 | 0.8 | 1.23 ± 0.06 | 1.2 | 0.45 ± 0.03 | 1.5 |
| 22495345+0044046 | L4γ | L3β | 1.85 ± 0.11 | 2.1 | 2.28 ± 0.12 | 2.1 | 0.78 ± 0.08 | 0.7 | 1.22 ± 0.09 | 1.1 | 0.43 ± 0.06 | 1.3 |
| 23433470–3646021 | – – | L3-L6γ | 1.89 ± 0.07 | 2.3 | 2.40 ± 0.07 | 2.5 | 1.07 ± 0.07 | 2.8 | 1.58 ± 0.07 | 3.2 | 0.51 ± 0.04 | 2.4 |
| 00303013–1450333 | L7– | L4-L6β | 1.62 ± 0.10 | 1.5 | 2.01 ± 0.11 | 1.4 | 0.82 ± 0.10 | 0.7 | 1.22 ± 0.11 | 0.8 | 0.39 ± 0.04 | 0.6 |
| 03264225–2102057 | L5 β | L5βγa | 1.84 ± 0.08 | 3.0 | 2.36 ± 0.08 | 3.1 | 0.97 ± 0.07 | 1.9 | 1.49 ± 0.07 | 2.3 | 0.51 ± 0.03 | 2.1 |
| 03552337+1133437 | L5γ | L3-L6γ | 2.00 ± 0.04 | 4.1 | 2.59 ± 0.04 | 4.2 | 1.00 ± 0.03 | 2.2 | 1.59 ± 0.03 | 2.8 | 0.59 ± 0.03 | 2.9 |
| 04210718–6306022 | L5β | L5γ | 1.73 ± 0.05 | 2.2 | 2.15 ± 0.05 | 2.0 | 0.89 ± 0.05 | 1.3 | 1.32 ± 0.05 | 1.3 | 0.42 ± 0.03 | 0.9 |
| 05120636–2949540 | L5γ | L5β | 1.78 ± 0.05 | 2.6 | 2.24 ± 0.05 | 2.5 | 0.91 ± 0.05 | 1.4 | 1.37 ± 0.05 | 1.6 | 0.46 ± 0.03 | 1.3 |
| 20025073–0521524 | L5β | L5-L7γ | 1.75 ± 0.06 | 2.4 | 2.19 ± 0.06 | 2.2 | 0.89 ± 0.04 | 1.2 | 1.33 ± 0.04 | 1.4 | 0.44 ± 0.03 | 1.2 |
| 00470038+6803543 | L7(γ?) | L6-L8γ | 2.09 ± 0.05 | 3.4 | 2.70 ± 0.05 | 3.3 | 1.18 ± 0.04 | 3.0 | 1.79 ± 0.04 | 3.0 | 0.61 ± 0.03 | 1.8 |
| 01033203+1935361 | L6β | L6β | 1.72 ± 0.06 | 0.8 | 2.20 ± 0.06 | 0.7 | 0.97 ± 0.06 | 1.0 | 1.45 ± 0.06 | 1.0 | 0.48 ± 0.04 | 0.6 |
| 08095903+4434216 | – – | L6p | 1.84 ± 0.10 | 1.2 | 2.37 ± 0.10 | 1.2 | 1.07 ± 0.06 | 1.5 | 1.61 ± 0.06 | 1.6 | 0.53 ± 0.04 | 1.0 |
| 08575849+5708514 | L8– | L8– | 1.77 ± 0.05 | 1.9 | 2.38 ± 0.05 | 1.8 | 0.94 ± 0.04 | 1.3 | 1.55 ± 0.04 | 1.3 | 0.60 ± 0.03 | 0.4 |
| 11193254–1137466 | – | L7γ | 2.24 ± 0.04 | 4.2 | 2.91 ± 0.04 | 4.1 | 1.20 ± 0.03 | 3.2 | 1.87 ± 0.03 | 3.4 | 0.67 ± 0.04 | 2.4 |
| 114724.10−204021.3 | – – | L7γ | 2.05 ± 0.11 | 3.1 | 2.67 ± 0.12 | 3.2 | 1.15 ± 0.03 | 2.8 | 1.78 ± 0.03 | 3.0 | 0.63 ± 0.04 | 2.0 |
| 17410280–4642218 | – – | L6-L8γ | 2.23 ± 0.06 | 4.1 | 2.86 ± 0.06 | 4.0 | 1.14 ± 0.04 | 2.7 | 1.76 ± 0.04 | 2.9 | 0.63 ± 0.03 | 2.0 |
| PSO318 | – – | L6-L8γ | 2.41 ± 0.05 | 5.0 | 3.16 ± 0.05 | 5.2 | 1.22 ± 0.05 | 3.3 | 1.97 ± 0.05 | 4.0 | 0.75 ± 0.04 | 3.4 |
| 22443167+2043433 | L6.5p – | L6-L8 γa | 2.22 ± 0.07 | 2.4 | 2.89 ± 0.07 | 2.6 | 1.25 ± 0.08 | 2.4 | 1.91 ± 0.08 | 2.8 | 0.67 ± 0.03 | 2.2 |
Notes.
A spectral type with a ? indicates questionable or extremely uncertain gravity features.
aValues are the number of σ (as reported in Table 16) from the field sequence that each object differs. A negative (−) number indicates that the color was blueward of the field sequence average, whereas a positive (+) number indicates that the color was redward of the field sequence average.In general, the γ and β sources are systematically redder than the mean for their subtype with the deviation from "normal" increasing with later spectral subtypes. Objects are most deviant from normal in the (J–W2) color (Figure 8) where they are an average of 2σ (or up to 1.85 mag) redder than the subtype mean value across all types, and least deviant in the (J–H) color (Figure 5) where they are an average of ∼0.7σ (or up to 0.6 mag) redder than the subtype mean value across all types. Typically, the γ sources mark the extreme red photometric outliers for each subtype bin, although there are a handful of extreme β sources (e.g., 0153-6744, an infrared L3 β).
The difference in age between the oldest moving group investigated and the average age for field sources is more than ∼3 Gyr (field age references Faherty et al. 2009; Seifahrt et al. 2010; Burgasser et al. 2015). As shown in Figures 5–14, the difference in photometric properties across this large age gap is distinct. We also investigated the more subtle age difference changes to the photometric properties across the 5–130 Myr sample. Isolating the sources that are confidently associated with a moving group, we conclude that there is no obvious correlation between the extreme color of an object and the age of the group. For example, 5–15 Myr TW Hydrae late-type M and L dwarfs, 25 Myr β Pictoris spectral equivalents, and 30–50 Myr Tucana Horologium spectral equivalents have similar photometric colors. The exceptions are TWA27A and TWA28, which are 2–5σ redder than similar objects in several colors. We note that Schneider et al. (2012a, 2012b) postulate that these sources may have disks, and hence their surroundings may be contributing to the colors.
Comparing internally within the same moving group (assumed to have the same age and metallicity) we find that objects of the same spectral subtype show a large diversity in their photometric colors. The best example is at L0 where there are 5 Tucana Horologium members. The objects have systematically redder colors, but they are distributed between 1 and 4σ from the field mean indicating that since this is a co-eval group, diversity must be driven by yet another parameter. We note that depending on the exact formation mechanism, metallicity variations cannot be completely outruled as also contributing to the diversity among objects in the same group.
Plotted as gray symbols throughout Figures 5–14 are objects that are kinematically ambiguous or unassociated with any known group. Many of these sources (such as the L4γ 1615+4953 and the very oddly reddened M8γ 0435–1441; see discussion in Allers & Liu 2013 and Cruz et al. 2003) are among the reddest objects for their spectral bins and rival the associated kinematic members in their spectral and photometric peculiarities. Conversely, there are several β sources, such as the L2β 0510–1843, that fall within the normal range in each color and are only subtly spectrally different than field sources. Unfortunately, with no group association, we cannot comment on the likelihood of age differences driving the diversity. It is likely that within this sample, there are objects in moving groups not yet recognized, as well as sources that are not young but mimic low surface gravity features due to secondary parameters (e.g., atmosphere or metallicity variations).
7.3. Flux Redistribution to Longer Wavelengths for Younger Objects
As discussed in Section 7.2 above, low surface gravity brown dwarfs are systematically redder for their given spectral types. Hence, one might expect that they would not logically follow the absolute magnitude sequence of field equivalents. Figures 15–20 show MJ through MW3 versus spectral type for all low surface gravity sources with parallaxes or, in a select few cases, with kinematic distances. In Table 13, we mark the 25 sources for which we lack a parallax but have assumed the kinematic distance to a moving group since the object was assessed as a HLM. The gray area throughout each figure is the polynomial relation for the field population at each band recalculated with all known brown dwarfs with parallaxes. We list all new relations for both field and low-gravity objects used in or calculated for this work in Table 19. Throughout Figures 15–20, individual low surface gravity objects are overplotted and color-coded by group membership and given a symbol representing their gravity designation. The lower portion of each figure shows the deviation of each low-gravity source from the mean absolute magnitude value of the spectral subtype.

Figure 15. Spectral type vs. MJ plot. The field polynomial listed in Table 19 is represented by the gray area. All JHK photometry is from 2MASS. Overplotted are objects in this work with measured parallaxes or estimated kinematic distances from high confidence group membership. Symbols distinguish very low (γ) from intermediate (β) gravity sources. Objects are color-coded by group membership. For demonstration on the MJ plot only, we also overplot individual field objects (with MJer < 0.5) as black filled circles. Residuals of individual γ and β objects against the field polynomial are shown in the lower panel.
Download figure:
Standard image High-resolution image
Figure 16. Spectral type vs. MH plot with residuals against polynomial relations (lower panel). Symbols are as described in Figure 15.
Download figure:
Standard image High-resolution image
Figure 17. Spectral type vs.  plot with residuals against polynomial relations (lower panel). Symbols are as described in Figure 15.
Download figure:
Standard image High-resolution image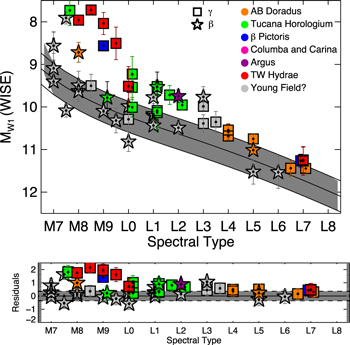
Figure 18. Spectral type vs. MW1 plot with residuals against polynomial relations (lower panel). Symbols are as described in Figure 15.
Download figure:
Standard image High-resolution image
Figure 19. Spectral type vs. MW2 plot with residuals against polynomial relations (lower panel). Symbols are as described in Figure 15.
Download figure:
Standard image High-resolution image
Figure 20. Spectral type vs. MW3 plot with residuals against polynomial relations (lower panel). Symbols are as described in Figure 15.
Download figure:
Standard image High-resolution imageTable 19. Coefficients of Polynomial Fits for M6 -T9 Dwarfs
| MFilter | x | rms | c0 | c1 | c2 | c3 | c4 | c5 | c6 |
|---|---|---|---|---|---|---|---|---|---|
 |
6.0 < SpT < 29.0 | 0.402 | −8.350e+00 | 7.157e+00 | −1.058e+00 | 7.771e–02 | −2.684e–03 | 3.478e–05 | ⋯ |
 |
7.0 < SpT < 17.0 | 0.647 | 4.032e–03 | −1.416e–01 | 2.097e+00 | 8.478e–01 | ⋯ | ⋯ | ⋯ |
 |
7.0 < SpT < 17.0 | 0.660 | −3.825e–03 | 1.370e–01 | −9.279e–01 | 10.141e+00 | ⋯ | ⋯ | ⋯ |
 |
6.0 < SpT < 29.0 | 0.389 | −7.496e+00 | 6.406e+00 | −9.174e–01 | 6.551e–02 | −2.217e–03 | 2.841e–05 | ⋯ |
 |
7.0 < SpT < 17.0 | 0.634 | 2.642e–03 | −1.049e–01 | 1.753e+00 | 1.207e+00 | ⋯ | ⋯ | ⋯ |
 |
7.0 < SpT < 17.0 | 0.603 | −3.909e–03 | 1.346e–01 | −9.347e–01 | 9.728e+00 | ⋯ | ⋯ | ⋯ |
 |
6.0 < SpT < 29.0 | 0.537 | −6.704e+00 | 5.970e+00 | −8.481e–01 | 5.978e–02 | −1.997e–03 | 2.540e–05 | ⋯ |
 |
7.0 < SpT < 17.0 | 0.640 | −1.585e–02 | 7.338e–01 | 4.537e+00 | ⋯ | ⋯ | ⋯ | ⋯ |
 |
7.0 < SpT < 17.0 | 0.556 | −4.006e–03 | 1.378e–01 | −1.031e+00 | 9.916e+00 | ⋯ | ⋯ | ⋯ |
 |
6.0 < SpT < 29.0 | 0.365 | −1.664e–01 | 2.991e+00 | −3.603e–01 | 2.258e–02 | −6.897e–04 | 8.337e–06 | ⋯ |
 |
7.0 < SpT < 17.0 | 0.648 | −1.397e–02 | 5.955e–01 | 5.247e+00 | ⋯ | ⋯ | ⋯ | ⋯ |
 |
7.0 < SpT < 17.0 | 0.551 | −4.483e–03 | 1.505e–01 | −1.208e+00 | 10.403e+00 | ⋯ | ⋯ | ⋯ |
 |
6.0 < SpT < 29.0 | 0.398 | −5.043e–01 | 3.032e+00 | −3.655e–01 | 2.283e–02 | −6.938e–04 | 8.190e–06 | ⋯ |
 |
7.0 < SpT < 17.0 | 0.694 | −1.507e–02 | 5.944e–01 | 5.061e+00 | ⋯ | ⋯ | ⋯ | ⋯ |
 |
7.0 < SpT < 17.0 | 0.616 | −6.821e–03 | 2.322e–01 | −2.133e+00 | 13.322e+00 | ⋯ | ⋯ | ⋯ |
 |
6.0 < SpT < 29.0 | 0.446 | 6.462e+00 | 3.365e–01 | 1.520e–02 | −2.573e–03 | 9.477e–05 | −1.024e–06 | ⋯ |
 |
7.0 < SpT < 17.0 | 0.717 | −1.003e–04 | −1.670e–03 | 2.023e–01 | 7.529e+00 | ⋯ | ⋯ | ⋯ |
 |
7.0 < SpT < 17.0 | 0.427 | −5.684e–03 | 1.993e–01 | −1.987e+00 | 13.972e+00 | ⋯ | ⋯ | ⋯ |
 |
6.0 < SpT < 29.0 | 113.431 | 4.747e+03 | −7.005e+02 | 1.155e+02 | −1.191e+01 | 6.318e–01 | −1.606e–02 | 1.546e–04 |
 |
7.0 < SpT < 17.0 | 180.457 | 1.330e+00 | −66.8637 | 1235.42 | −10068.8 | 32766.4 | ⋯ | ⋯ |
 |
7.0 < SpT < 28.0 | 197.737 | 2.795e+04 | −9.183e+03 | 1.360e+03 | −1.066e+02 | 4.578e+00 | −1.016e–01 | 9.106e–04 |
 |
7.0 < SpT < 17.0 | 172.215 | 7.383e+00 | −344.522 | 4879.86 | ⋯ | ⋯ | ⋯ | ⋯ |
 |
7.0 < SpT < 28.0 | 0.133 | 2.787e+00 | −2.310e+00 | 3.727e–01 | −3.207e–02 | 1.449e–03 | −3.220e–05 | 2.736e–07 |
 |
7.0 < SpT < 17.0 | 0.335 | −6.514e–03 | 2.448e–01 | −3.113e+00 | 9.492e+00 | ⋯ | ⋯ | ⋯ |
 |
7.0 < SpT < 28.0 | 0.206 | 2.059e–01 | 9.585 | −3.985 | 4.923e–01 | −3.048e–02 | 9.134e–04 | −1.056e–05 |
 |
7.0 < SpT < 17.0 | 0.221 | 6.194e–03 | −3.757e–01 | 2.728e–02 | ⋯ | ⋯ | ⋯ | ⋯ |
 a a |
7.0 < SpT < 28.0 | −3.46623e–01 | 3.40366e–02 | −3.072e–03 |
Notes. Relations use 2MASS or WISE magnitudes. Polynomial fits to optical M/L dwarfs and NIR T dwarfs (L dwarfs with no optical spectral type have NIR spectral types) excluding subdwarfs, low-gravity dwarfs, and binaries for the field (FLD) relations. We present polynomials inclusive of (1) all γ and β sources under the YNG polynomials as well as (2) only High-Likelihood/bona fide moving group members under the GRP polynomials (see Table 13). The function is defined as  =
=  ci(SpT)i and is valid for varying spectral types M6-T9, where 6 = M6, 10 = L0, 20 = T0, etc. An FTEST was used to determine the goodness of fit for each polynomial. In the case of all FLD polynomials, the sample of Filippazzo et al. (2015) is used. In the case of all YNG or GRP polynomials, they are valid from M7 to L7. We list a second Lbol and Teff for the YNG polynomial (captioned YNG2) that includes planetary-mass companions (e.g., HN Peg b, Gu Psc b, Ross 458C, etc.) from Filippazzo et al. (2015) and allows us to extend the polynomial from M7-T8.
 = W1 +
  ci(SpT)i.
Download table as: ASCIITypeset image
7.3.1. Trends with Spectral Type
Focusing on the objects associated with known groups, there is a distinct difference between the behavior of low-gravity, late-type M dwarfs and L dwarfs. In Figure 15, which shows the MJ-band trend, the TW Hydrae and Tucana Horologium late-type M(s) are ∼2 mag brighter than the field relations, whereas the L dwarfs are normal to ∼1 mag fainter than the field relations. Moving to longer wavelengths, the flux shifts. By MW3, nearly all sources regardless of spectral type have brighter absolute magnitudes than the field polynomial. One plausible explanation for this redistribution of flux is dust grains in the photosphere that absorb and reradiate at cooler temperatures (hence longer wavelengths). Equally likely is the possibility that there exist thicker clouds or that there are higher-lying clouds in the atmospheres of these sources (e.g., Faherty et al. 2013; Marocco et al. 2013; Hiranaka et al. 2016).
One main consequence of the young sources deviating from the field in some bands and not in others, is that the polynomial relations that use spectral type and photometry to obtain distances, are inappropriate for low surface gravity objects. At bluer near-infrared bands, they would overestimate distances, whereas at redder near-infrared bands they would underestimate. In Table 19, we have taken this into account and present new spectrophotometric polynomials for suspected young sources at the Jthrough W3 bands. As discussed in Filippazzo et al. (2015), the flux redistribution hinges around the K band. As a result, we recommend this spectral distance polynomial relation for suspected young sources.
7.3.2. Trends with Age
Overall, we find that there is a clear difference in the behavior of the absolute magnitudes as a function of spectral type for the >∼3 Gyr field trends in each band compared to the behavior of the low surface gravity sources. Narrowing in on the 5–130 Myr range and comparing equivalent spectral type sources in differing groups (such as the L7 sources in AB Doradus and β Pictoris or the Tucana Horologium late- M and L dwarfs) we find that there is no obvious correlation with age and absolute magnitude trend. In the case of PSO318 (∼25 Myr), 1119–1137, and 1147–2040 (∼5–15 Myr) versus 0047 + 6803 (∼110–130 Myr) or TWA 27A (∼5–15 Myr) versus 0123–6921 (∼30–50 Myr), the sources switch in brightness depending on the band, but stay within 1σ of each other from J (∼1.25 μm) through W2 (∼4.6 μm). By MW3 (∼11.56 μm), TWA 27A is over 1 mag brighter than 0123–6921, although this might be due to a disk and not due to the source (Schneider et al. 2012a, 2012b). Regardless, it does not appear that the younger sources show an extreme version of the overall trend indicating that whatever causes the flux redistribution compared to the field (>3 Gyr sample) has a near equal impact from ∼5–15 Myr through ∼110–130 Myr.
7.3.3. Trends with Non-group Members and Expanded Explanations for Diversity
The sources with non-conforming group kinematics (gray points) do not all trace the behavior of the bona fide/high-likelihood members. For instance, all but 2 of the γ or β "Young Field?" M7-L1 objects stay within the polynomial for each band. Furthermore, all but one of those are classified as β, which is the more subtly altered gravity type. Conversely, the L3 and L4 γ and β sources move from within the field polynomial band to being 1–2σ brighter than equivalent sources between MJ and MW3.
There are several explanations for why a spectroscopically classified low-gravity object looks normal in other parameters. Photometric variability may contribute slightly to their position on spectrophotometric diagrams (e.g., Allers et al. 2016) but it is unlikely to contribute in a significant way. As shown in works such as Radigan et al. (2014) and Metchev et al. (2015), large-amplitude photometric variations (>5%) among brown dwarfs are rare. Alternatively, rotational velocity could contribute in a substantial way because it influences global circulation on a given source which causes or disrupts cloud patterns. In this same vein, the distribution of clouds by latitude on a given object may not be homogeneous in structure or grain size. Consequently, (as first proposed by Kirkpatrick et al. 2010) our viewing angle (e.g., pole-on or equatorial on) would impact the spectral and photometric appearance. Unfortunately, there is little information on the rotational velocity distribution of the young brown dwarf sample so testing this parameter will require additional data.
The simplest explanation is that sources falling within "normal" absolute magnitude and luminosity plots with non-conforming kinematics to any known group may not be young. Aganze et al. (2016) showed this to be the case for the d/sdM7 object GJ 660.1B that had a peculiar near-infrared spectrum which hinted that it was young. However this object was co-moving with a higher mass, low-metallicity star refuting that suggestion. In the case of GJ 660.1 B, a low-metallicity likely helped to mimic certain spectral features of youth. Considering the fact that there may be some older contaminants in the sample, we present all new relations in Table 19 to be inclusive of all objects in this work with parallaxes as well as only objects that are considered bona fide or high likely members of groups.
7.4. Color-magnitude Trends for Young Brown Dwarfs
Color-magnitude diagrams have been discussed at length in the literature as a diagnostic of temperature, gravity, metallicity, and atmosphere properties of the brown dwarf population (e.g., Patten et al. 2006; Dupuy & Liu 2012; Faherty et al. 2012, 2013; Liu et al. 2013; Filippazzo et al. 2015; G15). Figures 21– 31 show the full suite of infrared color–magnitude diagrams using JHK (2MASS) and W1W2 (WISE) photometry for the field parallax sample omitting binaries, subdwarfs, spectrally peculiar sources, and those with absolute magnitude uncertainties >0.5 in any band. On each plot, we color code objects by spectral ranges of < M9, L0-L4, L5-L9, T0-T4, and >T5, and we highlight the low surface gravity objects by their gravity classification. The latest-type sources in our sample are labeled on each plot. On select plots, we have also labeled the M dwarf members of β Pictoris and TW Hydrae.

Figure 21. (J–H) vs. MJ (left) and MH (right) color–magnitude diagram for late-type M through T dwarfs (Y dwarfs where photometry is available). All JHK photometry is on the MKO system. Objects have been color-coded by spectral subtype. Binaries, subdwarfs, spectrally peculiar sources, and those with absolute magnitude uncertainties >0.5 have been omitted. Low-gravity objects are highlighted as bold filled circles throughout. Objects of interest discussed in detail within the text have been labeled.
Download figure:
Standard image High-resolution image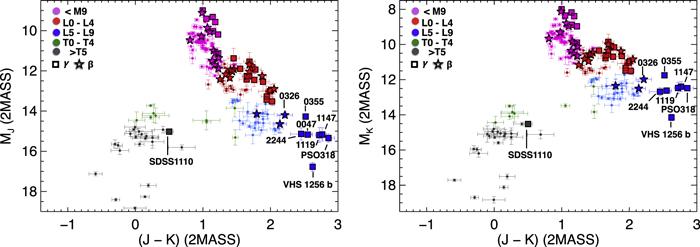
Figure 22. (J–K) vs. MJ (left) and MK (right) color–magnitude diagram. Symbols are as described in Figure 21.
Download figure:
Standard image High-resolution image
Figure 23. (J–W1) vs. MJ (left) and MW1 (right) color–magnitude diagram. Symbols are as described in Figure 21.
Download figure:
Standard image High-resolution image
Figure 24. (J–W2) vs. MJ color–magnitude diagram. Symbols are as described in Figure 21.
Download figure:
Standard image High-resolution image
Figure 25. (J–W2) vs. MW2 (right) color–magnitude diagram. Symbols are as described in Figure 21.
Download figure:
Standard image High-resolution image
Figure 26. (H–K) vs. MH (left) and MK (right) color–magnitude diagram. Symbols are as described in Figure 21.
Download figure:
Standard image High-resolution image
Figure 27. (H–W1) vs. MH (left) and MW1 (right) color–magnitude diagram. Symbols are as described in Figure 21.
Download figure:
Standard image High-resolution image
Figure 28. (H–W2) vs. MH (left) and MW2 (right) color–magnitude diagram. Symbols are as described in Figure 21.
Download figure:
Standard image High-resolution image
Figure 29. (K–W1) vs. MK (left) and MW1 (right) color–magnitude diagram. Symbols are as described in Figure 21.
Download figure:
Standard image High-resolution image
Figure 30. (K–W2) vs. MK (left) and MW2 (right) color–magnitude diagram. Symbols are as described in Figure 21.
Download figure:
Standard image High-resolution image
Figure 31. (W1-W2) vs. MW1 (left) and MW2 (right) color–magnitude diagram. Symbols are as described in Figure 21.
Download figure:
Standard image High-resolution imageFor completeness, we have included the one confirmed isolated T dwarf member of a moving group in the analysis (SDSS1110, T5.5; Gagné et al. 2015a) as well as the L7 wide companion VHS 1256 B (Gauza et al. 2015). While the latest-type L dwarfs push the elbow of the L/T transition to an extreme red/faint color/magnitude, SDSS1110 falls near spectral equivalents on all color–magnitude diagrams. As discussed in Gagné et al. (2015c) and Filippazzo et al. (2015), this source appears ∼150 K cooler than equivalents but does not exhibit the extreme color–magnitude properties as seen with the L dwarfs.
Looking at a given absolute magnitude across all plots and comparing field objects to low surface gravity objects, we find that the latter can be more than a 1 mag redder. The most extreme behavior can be seen in Figures 24 and 25, which exploits the largest wavelength difference in color (J − W2) and, as discussed in Section 7.2, is where the low-gravity objects are the most extreme photometric outliers.
As was discussed in Section 7.3, there is a distinct difference in the diversity of absolute magnitudes between young M dwarfs and L dwarfs. Using the color coding as a visual queue in Figures 21– 31, the M dwarfs fall redder than the field sequence but they also scatter to brighter magnitudes. For the W2 color difference plots (e.g., MJHK versus (J–W2), (H–W2), or (K–W2)), we label the position of the M dwarfs in TW Hydrae and β Pictoris as they are strikingly red and bright at these wavelengths and well separated from the field population.
Comparatively, the L dwarfs flip in their behavior and can be seen as redder but fainter than field sources. Focusing on Figures 21– 22, and 26 which use JHK photometry only, the latest-type sources (e.g., PSO318, 0047+6803, 2244+2043, 1119–1137, 1147–2040) are not only redder but they also drive the elbow of the L/T transition ∼1 mag fainter than the field (notably in MJ). Moving to longer wavelengths, this behavior reverses. By Figures that evaluate colors against MW1 (∼3.4 μm) or MW2 (e.g., Figures 23 or 28) the latest-type sources are consistent with or slightly brighter than the elbow. Hence, as discussed in Section 7.3, and Filippazzo et al. (2015), the flux redistribution of young L dwarfs seems to hinge very close to the K band. Indeed the color–magnitude diagram that appears to smoothly and monotonically transition objects from late- M to T dwarfs is the MK versus (K–W2) plot in Figure 30. There is a 10 mag difference between the warmest to the coolest objects and the magnitude seems to monotonically decrease with reddening color showing only a hint of an L/T transition elbow at MK = 13/MW2 = 12. On this plot, the low surface gravity sequence lies ∼1 mag brighter than the field with the exception of a small fraction of the sample appearing normal (including the AB Doradus T dwarf SDSS1110).
The L/T transition induces a turning elbow on most color–magnitude plots. This feature is brought on when the clouds dissipate as one moves from warmer L dwarfs to cooler T dwarfs and CH4 begins to dominate as an opacity source, all conspiring to drive the source colors blueward. The demonstration that these young sources are redder and fainter than the field sequence in the near-infrared indicates that the clouds must persist through lower temperatures (fainter) and represent an extreme version of the conditions present for field age equivalents (redder). The brightening of sources at W1 and W2 at extreme red colors likely holds clues to the composition and structure of the clouds as it is a reflection of the flux redistribution to longer wavelengths as discussed in Section 7.3 above.
For colors and magnitudes evaluated across JH or K and W1 or W2 (e.g., Figure 27 which shows MH versus H–W1), the latest-type objects pull the low-gravity sequence redder than the field while maintaining a small spread in absolute magnitude from 0103 + 1935 through PSO318. Interestingly this indicates similarities in these sources not readily apparent in current spectral data.
Lastly, on Figures 21– 31 we have given γ and β classified sources different symbols to investigate whether trends between the two could be identified. Throughout, there is a hint that the sequence of γ classified objects is redder than that of the β sources. This is most prominent on Figures 23–24 where only four β L dwarfs rival γ sources in color and/or magnitude. On other figures such as 21, there appears to be more mixing between the two gravity classifications. As has been stated throughout this work, spectral type and the corresponding gravity classification are difficult to evaluate and can differ between optical and infrared spectra or from low-resolution to medium resolution data. The data as viewed in this work, seems to indicate that the γ classified sources are distinct on color–magnitude diagrams from the β classified sources with some mixing likely due to a non-uniform spectral typing methodology.
7.5. The Bolometric Luminosities and Effective Temperatures of Young Objects
One expects that younger brown dwarfs should have inflated radii compared to equivalent temperature sources given that they are still contracting. Consequently, one would expect that γ and β objects would be overluminous when compared to their field age equivalents. A rough estimate using the Burrows et al. (2001) evolutionary models indicates that 10 Myr (50 Myr) objects with masses ranging from 10 to 75 MJup have radii that are 25%–75% (13%–50%) larger than 1–3 Gyr dwarfs with equivalent temperatures. Since Lbol scales as R2, one might expect that this age difference translates into younger objects being 1.5x–3.0x (1.3x–2.3x) overluminous compared to the field.
Initially, studies categorized low surface gravity brown dwarfs as "underluminous" compared to field sources based on examining near-infrared absolute magnitude trends alone (e.g., Faherty et al. 2012). However, as discussed in Section 7.3, the flux shifts to longer wavelengths beyond the H and K bands at lower gravities, so that some absolute magnitude bands might be fainter but Lbol's are not underluminous compared to the field (Faherty et al. 2013; Filippazzo et al. 2015). In fact, Filippazzo et al. (2015) carefully evaluated Lbol values for all brown dwarfs with parallaxes (or kinematic distances in the case of high-likelihood moving group members) and presented up to date relations between observables and calculated Lbols. In that work, β and γ objects were found to split along the M/L transition whereby M dwarfs were overluminous and L dwarfs were within to slightly below the sequence when compared to field objects.
To investigate Lbol trends among the age-calibrated sample, we first calculate values for the sources reported herein using the technique described in Filippazzo et al. (2015). In that work, the authors integrate under the combined optical and near-infrared photometry and spectra as well as the WISE photometry and mid-infrared spectra where available. As described in previous sections, we use parallaxes where available but supplement with kinematic distances when a source was regarded as a HLM to a group (see values in parentheses in Tables 13 and 10). All Lbol, Teff, and mass values are listed in Table 14 as well as Table 13 for members only.
Figure 32 shows Lbol as a function of spectral type for all objects compared to the field polynomial from Filippazzo et al. (2015). Also overplotted is the polynomial fit for objects in groups (labeled as GRP in Table 19). We highlight bona fide and high-likelihood brown dwarf moving group members as well as the unassociated γ and β objects with differing symbols and colors.

Figure 32. Spectral type vs. bolometric luminosity plot. The field polynomial and residuals from Filippazzo et al. (2015) is represented by the gray area. Overplotted are objects in this work with measured parallaxes or estimated kinematic distances from high confidence group membership. Lbol values were calculated as described in Filippazzo et al. (2015). Symbols distinguish very low- (γ) from intermediate- (β) gravity sources. Objects are color-coded by group membership.
Download figure:
Standard image High-resolution imageFocusing on the age-calibrated sample, we find that late-type M dwarfs assigned to groups are overluminous compared to the field. The L dwarfs assigned to a group are mixed, with the majority falling within the field polynomial relations and a small number falling slightly above. Comparing group-to-group differences, the 5–15 Myr TW Hydrae M8 and M9 objects are ∼5x more luminous than the field, while the 30–50 Myr Tucana Horologium source is ∼2x more luminous. Interestingly, the TW Hydrae, β Pictoris, and AB Doradus L7's have nearly equal Lbol values, all near the mean value for their subtype.
Comparing the γ and β gravity sources without membership to the field and high-likelihood group members, we find that—with the exception of the M7.5 0335 + 2342 which is highly suspect to be a β Pictoris member (see note in Table 13)—all NMs fall within the polynomial relations for the field. This trend indicates that the late- M NM γ and β sources may not be young (see discussion in Sections 7.3.3 and 7.6). Indeed, 1022 + 0200 is a late-M NM with full kinematics. When we compare the UV velocity of this source to that of the Eggen & Iben (1989) criterion for young stars, we find that it falls outside of it, hinting that it may be drawn from the older disk population. It remains unclear how to interpret the NM L dwarfs as this trend is in line with group assigned equivalents.
The result of Lbol's for γ and β gravity L dwarfs looking like field sources or in some cases underluminous, implies that they are cooler than their field spectral equivalents. In other words, low-gravity or atmospheric conditions potentially induced at a younger age mimic spectral features of a warmer object. As young sources are typed on a scheme anchored by field objects, they are incorrectly grouped with warmer sources. They certainly stand out in photometric, spectroscopic, and band-by-band absolute magnitude comparisons with field sources (e.g., all of Section 7). However the low gravity sequence does not logically or easily follow off of the field sequence. Figure 33 shows the Teff values for γ and β sources calculated using the method described in Filippazzo et al. (2015) along with the polynomial and residuals for field objects (from Filippazzo et al. 2015) and group members (from Table 19). As noted in Filippazzo et al. (2015)—with a few exceptions—while M dwarfs are similar if not warmer for their given spectral subtype, the L dwarfs are up to 100-300K cooler. Examining the 5–130 Myr age-calibrated objects within this sample, we cannot isolate a trend of younger objects being increasingly cooler than older equivalent sources. For example, PSO318 and 0047 + 6803 are equivalent temperatures even though there is a ∼100 Myr difference in age.

Figure 33. Spectral type vs. Teff plot. Symbols are as described in Figure 32.
Download figure:
Standard image High-resolution image
Figure 34. Age vs. bolometric luminosity plot with model isochrone tracks at constant mass from Saumon & Marley (2008; solid lines) and Baraffe et al. (2015; dashed lines). We have color-coded <13 MJup tracks in red, 13 MJup < M < 75 MJup tracks in green, and >75 MJup blue. Overplotted are both the young brown dwarfs discussed in this work and directly imaged exoplanets with measured quantities.
Download figure:
Standard image High-resolution image7.6. Unmatched objects with Signatures of Youth
Among the 152 objects in this sample with reported spectral signatures of youth in either the optical or the near-infrared, we confidently find that 39 (∼25%) are high-likelihood or BMs of nearby moving groups. There are 92 (∼61%) dubbed ambiguous either because their kinematics overlap with more than one group (including the old field) and they need better astrometric measurements to differentiate, or becuase there is not strong enough evidence with the current astrometry to definitively call it high likelihood or bona fide. There are 21 objects (∼14%) for which we have enough information to declare them as NMs to any known group assessed in this work. Among the NMs, there are 4 optically classified (3 infrared classified) M dwarfs and 15 optically classified (17 infrared classified) L dwarfs with 12 optically (10 infrared) classified γ objects and 5 optically (8 infrared) classified β objects. Several of these objects have extreme infrared colors (see Figures 5–14). For instance, 1615 + 4953 is classified in the optical as an L4γ and rivals the most exciting late-type objects in its deviant infrared colors. However, current kinematics do not show a high probability of membership in any group despite its having a proper motion and radial velocity. Similarly, 0435–1441 is strikingly red in JHK, shows both optical and infrared signatures of youth, and its spectrum needs to be de-reddened (E(B–V) = 1.8). While it is in the direction of the nearby star-forming region MBM 20, the distance noted for that cluster (112–161 pc) would drive unrealistic absolute magnitudes and Lbol values for this source.
The current census of young, but, unassociated late- M and L dwarfs is similar to what has emerged in studies of early M dwarfs with multiple signatures of youth (e.g., X-ray, UV, and IR excess, Lithium). A significant portion of objects in the studies of Rodriguez et al. (2013) and Shkolnik et al. (2011, 2012) are strong candidates for being 5–130 Myr objects via their spectral and photometric properties but their kinematics are inconclusive and their age cannot be determined by a group assignment. Likely, there are a number of groups waiting to be uncovered that may account for this overabundance of young, low-mass objects. Alternatively, after 5–130 Myr sources have been dynamically moved from their origins such that tracing back their history to any collection of objects is beyond our capability.
8. COMPARISONS WITH DIRECTLY IMAGED EXOPLANETS
Several of the objects discussed herein are in the same moving groups as directly imaged exoplanets or planetary-mass companions. For example, there are two bona fide or high-likelihood brown dwarfs in the β Pictoris moving group which is home to the 11–13 Jupiter mass planet β Pictoris b and the newly discovered 2–3 Jupiter mass planet 51 Eri b (Bonnefoy et al. 2013, 2014; Males et al. 2014; Macintosh et al. 2015), 20 in the Tucana Horologium association which houses the 10–14 MJup planetary-mass companion AB Pictoris b (Chauvin et al. 2005; Bonnefoy et al. 2010) as well as the 12–15 MJup planetary-mass companion 2M0219 b (Artigau et al. 2015), and 7 in the TW Hydrae Association which is the home of the 3–7 MJup planetary-mass companion 2M1207b (Chauvin et al. 2004; Patience et al. 2012). As such, the brown dwarfs discussed herein should be considered siblings of the directly imaged planets as one can assume that they are co-eval and share formation conditions and dynamical histories. The mode of formation for the brown dwarfs versus the directly imaged exoplanets remains a question but will likely drive distinct differences in the observables of each population. In this section, we look to place the young brown dwarf sample in context with related exoplanet members.
8.1. Similarities of Brown Dwarfs and Imaged Exoplanets on Color Magnitude Diagrams
Young, isolated brown dwarfs are far easier to accumulate data on than directly imaged exoplanet equivalents because they do not have a bright star to block when observing. The collection of currently known giant exoplanets generally have only infrared ( ) photometric measurements. Near-infrared spectroscopy is possible for some, although this requires considerable telescope time and advanced instrumentation (e.g., Patience et al. 2012; Bonnefoy et al. 2013; Oppenheimer et al. 2013; Hinkley et al. 2015; Macintosh et al. 2015).
Figures 35–41 show a full suite of near-infrared color–magnitude diagrams with the same brown dwarf sample as in Figures 21– 31; however, we now compliment each with directly imaged exoplanets and color code sources by their respective moving groups. For L'-band photometry of the brown dwarfs, we have used the small sample of MLT sources with measured MKO L'—primarily from Golimowski et al. (2004)—to convert the WISE W1-band photometry which has comparable wavelength coverage. The polynomial relation used for converting between bands is listed in Table 19.

Figure 35. (J–H) vs. MJ color–magnitude diagram for brown dwarfs and directly imaged planetary-mass companions. All photometry is on the MKO system. For the brown dwarfs lacking MKO L' photometry, WISE W1 mags were converted using a polynomial listed in Table 19. Objects have been color-coded by nearby moving group membership and those of interest discussed in detail within the text have been labeled.
Download figure:
Standard image High-resolution imageAs with the young brown dwarfs discussed herein, an observable feature of note for the exoplanets is that they are redder and fainter than the field brown dwarf population in near-infrared color–magnitude diagrams. This is exemplified by the positions of HR8799 b and 2M1207b both of which sit ∼1 mag below the L dwarf sequence in Figures 35–37. To explain their position on near-infrared color–magnitude diagrams, several authors have proposed thick or high-lying photospheric clouds in their atmospheres (Bowler et al. 2010b; Hinz et al. 2010; Currie et al. 2011; Madhusudhan et al. 2011; Marley et al. 2012; Skemer et al. 2012). An alternative theory proposed by Tremblin et al. (2016) has recently emerged that proposes cloudless atmospheres with thermo-chemical instabilities may invoke some of the features seen herein. Further investigation of those models is required before we can appropriately comment on how well they may reproduce the large sample presented in this work.

Figure 36. (J–H) vs. MH (right) color–magnitude diagram for brown dwarfs and directly imaged planetary-mass companions. Symbols are as described in Figure 35.
Download figure:
Standard image High-resolution image
Figure 37. (J–K) vs. MJ (left) and MK (right) color–magnitude diagram for brown dwarfs and directly imaged planetary-mass companions. Symbols are as described in Figure 35.
Download figure:
Standard image High-resolution imageThe young brown dwarf sequence in many ways mirrors that of the directly imaged exoplanets but for warmer (or older) objects. From the warmest (at M7) to the coolest (at L7) the low-gravity brown dwarfs are redder and fainter than their field counterparts. As can be seen on each Figure, the low-gravity sequence appears to logically extend through many of the directly imaged exoplanets. Interestingly, the youngest exoplanets (those in Taurus, Upper Scorpius, and ρ Ophiuchus; Currie et al. 2014; Kraus et al. 2014) are redder than either the field or the low-gravity sequences indicating—assuming formation differences do not drastically alter the available compositions—that the atmosphere or gravity effects are most pronounced close to formation.
By color combinations using L' band, the youngest planetary-mass objects such as ROXs12 b, DH Tau b, and GQ Lup b are nearly 2 mag redder and >2 mag brighter than the field sequence. Conversely, the lowest-temperature planets around HR8799 fall within or close to the T dwarf sequence. The exception is HR8799 b which has a singificantly redder (J–L) color than the field sequence as well as the young brown dwarf sequence. It is also ∼2 mag fainter in ML than the low-gravity sequence which extends redward in Figure 38 with minimal scatter in ML. Skemer et al. (2012) have noted that the 3.3 μm photometry (not plotted) for the HR8799 planets is brighter than predicted by evolutionary or atmosphere models. As in Barman et al. (2011a), Skemer et al. (2012) use thick cloudy non-equilibrium chemistry models and remove CH4 to fit the data. Similarly, none of the isolated late-type L dwarfs labeled on Figures 35–41 have CH4 in their near-infrared spectra even though 1119–1137, 1147–2040, PSO318, and 0047 + 6803 have calculated Teff(s) which should allow for detectable CH4. Interestingly, only the planetary-mass companion 2M1207b rivals the far-reaching red sequence of the young brown dwarfs, yet that source is lacking an L' or equivalent band detection. Hence, at this point, the late-type young brown dwarf sequence prevails over the exoplanet sequence in their extreme L' colors even as the earliest type youngest planetary-mass sources prevail at slightly bluer magnitudes.

Figure 38. (J–L) vs. MJ (left) and ML (right) color–magnitude diagram for brown dwarfs and directly imaged planetary-mass companions. Symbols are as described in Figure 35.
Download figure:
Standard image High-resolution image
Figure 39. (H–K) vs. MH (left) and MK (right) color–magnitude diagram for brown dwarfs and directly imaged planetary-mass companions. Symbols are as described in Figure 35.
Download figure:
Standard image High-resolution image
Figure 40. (H–L) vs. MH (left) and ML (right) color–magnitude diagram for brown dwarfs and directly imaged planetary-mass companions. Symbols are as described in Figure 35.
Download figure:
Standard image High-resolution image
Figure 41. (K-L) vs. MK (left) and ML (right) color–magnitude diagram for brown dwarfs and directly imaged planetary-mass companions. Symbols are as described in Figure 35.
Download figure:
Standard image High-resolution imageThe latest-type, low-gravity brown dwarfs and the known directly imaged exoplanets push the L/T transition to cooler temperatures and redder colors. Interestingly, we have two sets of objects in the same group that span either side of the famed L/T transition. 0047 + 6803 (Teff = 1227 ± 30 K, Mass = 9–15 MJup) and SDSS1110 (Teff = 926 ± 18, Mass = 7–11 MJup) are both in the ∼110–130 Myr AB Doradus moving group. PSO318 (Teff = 1210 ± 41, Mass = 5–9 MJup) and 51 Eri b (Teff = 675 ± 75, Mass = 2–12MJup) are both in the ∼25 Myr β Pictoris moving group. The two sets differ by ∼100 Myr in age. Comparing 0047 + 6803 to PSO318 we find they have similar spectral types, have Teff within 1σ but may differ in mass by up to ∼10 MJup . Both push the L/T transition redder on multiple color–magnitude diagrams in Figures 21– 31 and 35–41. Overall PSO318 and 0047 + 6803 have similar absolute magnitudes (see Figures 15–20) although PSO318 can be significantly redder in specific colors. 51 Eri b and SDSS1110 are thought to have similar spectral types but differ in mass and Teff by as much as 344 K and 5 MJup, respectively. Interestingly, 51 Eri b is ∼2 mag fainter in MJHL than SDSS1110. Comparing its position on Figures 35, 38, and 40, 51 Eri b appears much more like the T8 Ross 458C thought to be 150–800 Myr (Burgasser et al. 2010b). Regardless for both groups we see that by the time we have reached the mid to late-T dwarf phase, sources are back on or very close to, the field sequence. As cloud clearing is thought to happen at the L/T transition, we surmise that this is further evidence that much of the diversity seen among the young, warm exoplanet and brown dwarf population is atmosphere related.
A note of caution when looking for similarities on color–magnitude diagrams between brown dwarfs and giant exoplanets comes in the way of comparing the newly discovered L7 companion VHS1256 B to HR8799 b. In Gauza et al. (2015), the authors noted a similarity of this companion and the giant exoplanet. On Figure 37, the two have enticingly similar near-infrared values. However, Figure 42 shows the near-infrared spectrum of each object as well as a field L7 to demonstrate strong differences in H band. Clearly there is some commonality between the two sources, but color–magnitude combinations alone do not give a full enough picture to draw conclusions.
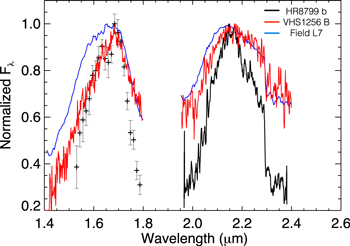
Figure 42. Near-infrared spectrum comparison of HR8799 b (black, from Barman et al. 2011a; Oppenheimer et al. 2013), VHS 1256 B (red, from Gauza et al. 2015), and a field L7 (Gagné et al. 2015b).
Download figure:
Standard image High-resolution imageThe directly imaged companion GJ 504 b is another example of how we require multiple color–magnitude diagram plots to begin exploring the potential characteristics of a single object (Kuzuhara et al. 2013). GJ 504 b is nearly 1 mag redder than late-type T dwarfs in MJHK versus (J–K) or (H–K) diagrams (Figures 37 and 39), but it appears normal in MJH versus (J–H) plots (Figure 35). Recent work by Fuhrmann & Chini (2015) suggest the primary may not be young therefore this source may not be planetary mass. Regardless, it is a low-mass T dwarf orbiting at <50 AU, potentially formed in a disk around a nearby star, and hence it may be characteristically different than equivalent temperature T dwarfs (see, e.g., Skemer et al. 2015).
8.1.1. Bolometric Luminosities
Comparing the bolometric luminosities (Lbol) across the sample of field objects, new bona fide or high-likelihood moving group members, and directly imaged exoplanets allows us to investigate how the flux varies across the sample. For the directly imaged exoplanets, we use the Lbol values reported in the literature (see Bonnefoy et al. 2014; Currie et al. 2014; Males et al. 2014).
As discussed in both Section 7.5 and Filippazzo et al. (2015), the young M dwarfs are overluminous for their spectral type while the young Ls are normal to slightly underluminous. Several authors have noted this peculiarity among the directly imaged exoplanets as well (e.g., Bowler et al. 2013; Males et al. 2014). Examining the two populations together allows us to investigate whether there is an obvious age-associated correlation within the scatter. The youngest objects in Figure 43 are the directly imaged exoplanets such as ROXs 42B b, and 1RXS1609b which belong to star-forming regions at just a few Myr of age. These sources appear overluminous in comparison to equivalent sources regardless of how late their spectral type (e.g., 1RXS1609b which is thought to resemble an L4). The latest-type planets that have direct, comparable data—2M1207b, HR8799 b, 51 Eri b—are all ∼1σ or more below the field sequence indicating that they are either far cooler than the latest L dwarfs or there is unaccounted flux in the bolometric luminosity calculations. Interestingly, this appears to be where the young brown dwarf and the directly imaged exoplanet comparisons diverge. The latest-type exoplanets in equivalent age groups to the isolated brown dwarfs, are either far cooler than any currently discovered young brown dwarf equivalent, or the physical conditions diverge (e.g., atmosphere conditions, chemistry, other).

Figure 43. Spectral type vs. bolometric luminosity plot for brown dwarfs and directly imaged planets. Lbol values and spectral types for planets have been taken from the literature with the exception of HR8799bd and 2M1207b, which we designate as L8 objects to represent their nature as late-type objects. Symbols are as in Figure 32.
Download figure:
Standard image High-resolution image8.1.2. Masses from Combining Evolutionary Models with LBol and Age
In Figure 34, we combine the Lbol values with the ages of the moving group members to estimate masses. In Table 14 we also list masses calculated from the spectral energy distribution analysis as described in Filippazzo et al. (2015). Overplotted on Figure 34 with the young brown dwarfs are directly imaged planetary and brown dwarf mass companions with Lbol values collected from the literature. The models from Saumon & Marley (2008; solid) and Baraffe et al. (2015; dashed) are shown with lines of equal mass color-coded as stars (>75 MJup, blue), brown dwarfs (>13 MJup, green), and planets (<13 MJup, red).
It is unclear how each one of the objects in this sample formed, however, using the 13 MJup boundary as a mass distinguisher between brown-dwarf and planet-type objects, we find that there are close to nine solitary objects with masses <13 MJup. Several of those sources lie in an ambiguous area where low-mass brown dwarfs and planetary-mass objects cross (30–130 Myr between masses of 10–20 MJup).
With the exception of Y type objects whose age is still undetermined (e.g., W0855, Luhman 2014), 1119–1137, 1147–2040, and PSO318 are the lowest-mass, isolated sources categorized. PSO318 has a lower luminosity than β Pictoris b, the 11–13 MJup planet in the same association, while 1119–1137 and 1147–2040 are significantly more luminous than their sibling exoplanet 2M1207b. Interestingly, the AB Doradus equivalently typed L7 member, 0047 + 6803, is of higher mass than all of these sources, even though its bolometric luminosity is comparable. Similarly, 0355 + 1133, which is in the same group as 0047 + 6803, shares photometric anomalies with PSO318 (near-infrared and mid-infrared color) and spectral anomalies with 2M1207b, and yet it is much higher mass.
The overlap in masses of the directly imaged exoplanets and isolated brown dwarfs invites questions of formation given co-evolving groups. Whether the latter was formed via star formation processes or ejected after planetary formation processes is yet to be seen and requires further investigation.
9. CONCLUSIONS
In this work, we investigate the kinematics and fundamental properties of a sample of 152 suspected young brown dwarfs. We present near-infrared spectra and confirm low surface gravity features for 43 of the objects designating them either intermediate (β) or very low (γ) gravity sources. We report 18 new parallaxes (10 field objects for comparison and 8 low surface gravity), 19 new proper motions, and 38 new radial velocities and investigate the likelihood of membership in a nearby moving group. We use four kinematic membership codes (1) BANYAN I, (2) BANYAN II, (3) LACEwING, and (4) Convergent method, as well as a visual check of the available space motion for each target against known members of well known nearby kinematic groups to determine the likelihood of co-membership for our sources. We categorize objects as (1) BM, (2) HLM, (2) AM, or (3) NM of nearby moving groups. We find 39 sources are bona fide or HLMs of known associations (8 in AB Doradus, 1 in Argus, 2 in β Pictoris, 1 in Columba, 7 in TW Hydrae, and 20 in Tucana Horologium). A further 92 objects have an ambiguous status and 21 objects are not members of any known group evaluated in this work.
Examining the distribution of gravity classifications between different groups we find that the youngest association (TW Hydrae) has only very low-gravity (γ) sources associated with it but slightly older groups such as Tucana Horologium (9 optically classified, 10 infrared classified γ objects, and 3 optically classified, 5 infrared classified β objects) and AB Doradus (4 optically classified, 6 infrared classified γ objects, and 1 optically classified, 2 infrared classified β objects) show a mix of both intermediate- (β) and very low-gravity sources. This diversity is evidence that classically delegated gravity features in the spectra of brown dwarfs are influenced by other parameters such as metallicity or (more likely) atmospheric conditions.
We investigate colors for the full sample across the suite of MKO, 2MASS and WISE photometry ( ). In color versus spectral type diagrams, we find that the γ and β classified objects are distinct from the field (>3 Gyr sources). They are most deviant from the field sequence in the (J–W2) color where they are an average of 2σ redder than the subtype mean. They are least deviant in the (J–H) color where they are an average of 0.7σ redder than the subtype mean. Based on the 5–130 Myr age-calibrated sample, we conclude that the extent of deviation in infrared color is not indicative of the age of the source (meaning redder does not translate to younger). In any given color, a γ or a β object—whether confirmed in a group or not—may mark the extreme outlier for a given subtype. We find that the L0 dwarfs in Tucana Horologium (expected to have the same, Teff, age and metallicity) deviate from the field sequence of infrared colors by between 1 and 4σ (depending on the particular color examined). Assuming clouds are the source of the diversity, we conclude that there is a variation in cloud properties between otherwise similar objects.
Examination of the absolute magnitudes for the parallax sample indicates a clear flux redistribution for low- and intermediate-gravity brown dwarfs (compared to field brown dwarfs) from near-infrared to wavelengths at (and longer than) the WISE W3 band. There is also a clear correlation of this trend with spectral subtype. The M dwarfs are 1–2σ brighter than field equivalents at J band but 4-5σ brighter at W3. The L dwarfs are 1–2σ fainter in theJ band but 1–2σ brighter at W3. Clouds, which are a far more dominant opacity source for L dwarfs, are likely the cause.
Sources that are not confirmed in groups do not all trace the same behavior in absolute magnitude or color indicating that some sources may not be young. Variations in atmospheric conditions or metallicity likely drive the diversity.
On color–magnitude diagrams, the low surface gravity brown dwarfs pull the elbow of the field L/T transition significantly redder and fainter, with the most extreme case being the MJ versus (J–W2) plot where young objects are up to 1 mag redder than the field sequence. Conversely, the MK versus (K–W2) plot shows a 10 mag difference between the warmest and coolest brown dwarfs, yet seems to monotonically decrease in magnitude with reddening color. On this figure there is little evidence for an L/T transition elbow and the young objects form a secondary sequence that is ∼1 mag redder than the field sequence. Interestingly as we move to longer wavelengths the effect reverses and the latest-type objects pull the elbow of the L/T transition back up as they are equivalent or slightly brighter than field equivalents at  . Comparing the sequence of γ and β classified sources on color-magnitude diagrams (CMDs) to the field, we find a hint that the two are distinct, with the former appearing to be redder than the latter. This trend is clearest on the MJ versus (J–W2) figure, although there is still a small mix of γ and β sources at extreme colors for a given absolute magnitude.
Comparing the low-gravity sample with directly imaged exoplanets on color–magnitude diagrams, we find that the former sequence logically extends through the latest-type planets on multiple color–magnitude diagrams. The small collection of hot, planetary-mass objects in star-forming regions such as ρ Ophiuchus and Taurus is strikingly red, bright, and luminous compared to either the field sequence or the low-gravity objects, indicating that the atmosphere and/or gravity effects that drive the population diversity may be pronounced close to formation. Comparing β Pictoris members 51 Eri b (mid T dwarf) and PSO318 (late L dwarf) with AB Doradus members SDSS1110 (mid T dwarf) and 0047 + 6803 (late L dwarf), we find that even though the members differ by ∼100 Myr, the late-type Ls similarly push the elbow of the L/T transition redder and fainter, whereas the T dwarfs appear on or very close to the field sequence. We surmise that this behavior, seen in two sets of objects at different ages across the L/T transition where cloud clearing is thought to be significant, is evidence that much of the diversity seen among young, warm exoplanets and brown dwarfs is atmosphere-related.
This publication has made use of the Carnegie Astrometric Program parallax reduction software as well as the data products from the Two Micron All-Sky Survey, which is a joint project of the University of Massachusetts and the Infrared Processing and Analysis Center/California Institute of Technology, funded by the National Aeronautics and Space Administration and the National Science Foundation. This research has alsp made use of the NASA/ IPAC Infrared Science Archive, which is operated by the Jet Propulsion Laboratory, California Institute of Technology, under contract with the National Aeronautics and Space Administration. Furthermore, this publication makes use of data products from the Wide-field Infrared Survey Explorer (WISE), which is a joint project of the University of California, Los Angeles, and the Jet Propulsion Laboratory/California Institute of Technology, and NEOWISE, which is a project of the Jet Propulsion Laboratory/California Institute of Technology. WISE and NEOWISE are funded by the US National Aeronautics and Space Administration. Australian access to the Magellan Telescopes was supported through the National Collaborative Research Infrastructure and Collaborative Research Infrastructure Strategies of the Australian Federal Government. C.G.T. acknowledges the support in this research of Australian Research Council grants DP0774000 and DP130102695. J.R.T. gratefully acknowledges support from NSF grants AST-0708810 and AST-1008217.
Footnotes
-
*
This paper includes data gathered with the 6.5 m Magellan Telescopes located at Las Campanas Observatory, Chile.
-
13
Our group maintains a listing of known isolated field objects noted as having gravity sensitive features on a web-based compendium http://www.bdnyc.org/young_bds.
-
14
While this paper was awaiting acceptance, Aller et al. (2016) reported a sample of AB Doradus late-type M and L dwarfs. Those objects are not included in this analysis but should be considered in future work.
-
15
Available at http://www.stsci.edu/~inr/ultracool.html.
-
16
-
17
-
18
See the G14 paper for a detailed description of how to interpret each probability category.
-
19
 urles/www/MIKE/checked 2014 June 19
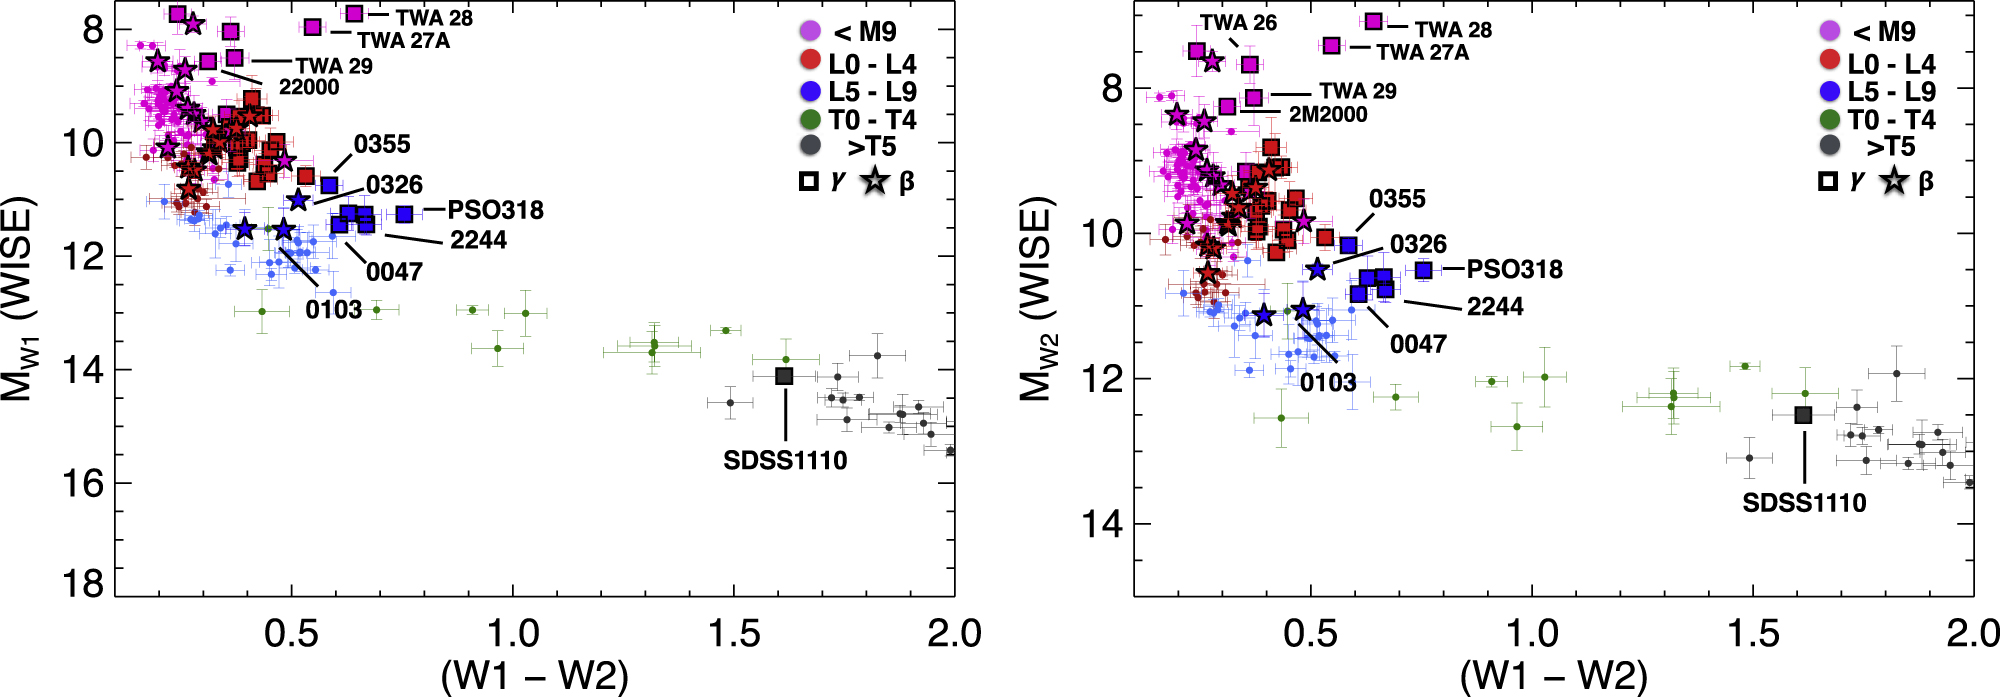