The Great Recession versus the Great Depression

Reading this article about the global manufacturing plunge, I wondered: how does the current slump stack up against the early stages of the Great Depression? The US has consistent industrial production data back to 1919, so it’s a fairly straightforward exercise. Below is the change in industrial production, measured in logs, from the previous peak in 1929-30 and 2007-9.

INSERT DESCRIPTION

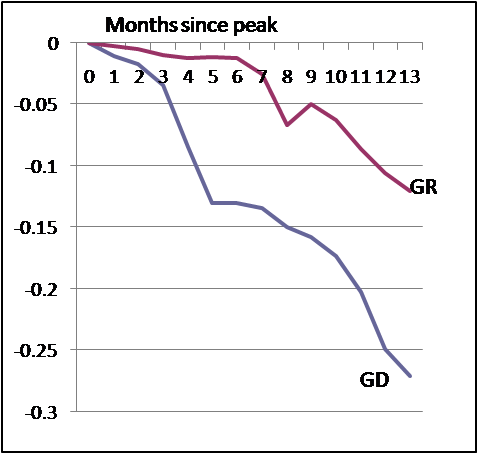
At first, the current recession didn’t hit industrial production all that hard. But the pace accelerated dramatically last fall, so that at this point we’re sort of experiencing half a Great Depression. That’s pretty bad.

Clarification: Those are natural logs — sorry, economists use them so frequently I forgot to explain. So basically multiply by 100 to get the percent change.

Comments are no longer being accepted.

Move the GR chart 6 months to the left and you have a perfect sync. You are forgetting the “recession ? yeah, Bernanke will handle it in no time” factor.

We are seeing many avoidable, costly errors in steps by the Obama administration to fix our economic decline, with future indebtedness for our children from money often wasted today. President Obama is headed for failure if this keeps up, just what Rush Limbaugh wants.

This president has all the qualifications for turning this mess around, but one. He has prejudicially picked his key financial experts from his old college, Harvard. What other reason could there be for not picking the best? One of his most important appointments resigned in 2006 as president of Harvard, mired in controversy over insensitivity to humans. Another helped cause this mess in the first place and now appears to be protecting that attitude of “entitlement” to riches held by financial executives that Barack spoke of on The Tonight show this week. His appointments in the financial area would be like my selecting experts from only the University of Michigan, whether actually qualified or not.

President Obama needs to admit a mistake in staffing, and replace some of his financial managers with more practical experts (let me suggest he begin with selecting pragmatic realist Paul Krugman for a leading position).

Some say temporary nationalization of banks is unwise – it’s close-mindedly called socialism by many politically-manipulating (and willingly unpatriotic) members of the opposition party. Highly respected economists disagree. We can’t ignore good solutions – this one rejected by the administration’s current experts – even if they have been one part of a discredited ism. Every theory has its good points as well as bad. At this critical time in America’s history, we must all let our minds be very open to solutions, monitored by our love of democracy.

President Obama is likely endangering the new start we all hoped for. He mustn’t let that happen because of staffing with inadequate experts through a biased allegiance to his alma mater.

Paul,

Why are oil prices increasing if manufacturing and shipping continues to decline? Is this more speculation or does it point to a recovery in demand?

Nick

Does the “Great Recession” moniker really make sense? It kind of seems like the recession in the early 80s was perhaps a “great recession” but that what we have now is more of a moderate depression. I realize there isn’t a formal definition of depression, but I believe a certain someone recently wrote a book called “Depression Economics” that fits our current situation fairly well.

If you translate the GR graph back 4 months, it almost exactly matches the GD graph. So maybe disaster is just delayed a few months.

It’s been a depression, at my house at least, since last summer.

*sigh*

This really just looks like a straight translation of the same function (a 6 month delay)… I also think depressions aren’t measured in the time it takes to bottom out. If it takes 6 months longer to reach to same minima, it just prolongs the pain. Although, it may be analogous to pulling off a band-aid…

Perhaps this is just my ignorance, but if it is half on a log graph, wouldn’t it be several orders of magnitude less in actual terms?

America isn’t quite the industrial powerhouse it once was. Maybe you could put up a graph of the number of burgers flipped?

The core of the American economy has shifted dramatically from industrial production towards services since the 1930s. I’m not sure looking at industrial production today will give you a meaningful comparison to what happened over 70 years ago …

I also don’t know what “measured in logs” means?

The issues of today haven’t reached the bottom of the food chain (YET) quite like the GD. There is plenty of time for that. If it is posible, I am sure everything that can be done, to make it happen, will be pursued. You can’t make an omlett without cracking a few eggs. You can’t fix it right until it is really broken. Based on what I am seeing…..full speed ahead we can see the iceberg, and we need ice for the straight up drinks in first class.

One thing keeps running through my mind and that is that this recession is man-made and that it is up to man to work his way out of this.

Mike said – “if it is half on a log graph, wouldn’t it be several orders of magnitude less in actual terms?”

In general, to get from logs back to the real world, you raise ten by the power of the log. So on Paul’s figure a value of 0.25 (i.e. industrial production fell by that much in the GD), in real numbers this is 10^0.25 or 1.77 (percent, I guess?). The current crisis is 10^0.13 or 1.35 (percent?). Usually people put things on a log scale when they’re dealing with a huge spread in the numbers or trying to compare big numbers with a cluster of small numbers. In this case, I’m not sure why it’s on a log scale b/c the numbers seem quite comparable in magnitude. There may be something else going on that I don’t understand.

You say, “measured in logs”? What does that mean? The graph’s scale is not logarithmic.

Now that inflation is starting to pick up, maybe it’s time to talk about one feature of depression economics that’s been ignored–the failure of prices to respond to declines in demand , known as administered pricing.

During the ’74-5 recession GM made news (not to the same extent as “What’s good for GM…”) by defending car price increases on the basis that they had to make more profit per car because people were buying fewer cars, thus turning the law of supply and demand on its head.

In classic capitalism, production remains high while prices are adjusted for demand. OK, this doesn’t work if nobody wants your product. But what we have now is petulant capitalism, where we produce only for those willing to pay preset prices, leading to more layoffs sooner.

If you look at the 4 Bad Bears graph of stock market declines in the worst recessions/depression since 1929 you find that the market (SP500) is now down just as much as was the Dow in 1929 in the same time period.

Isn’t that comparing apples to oranges? They’re both fruit of course, but… A better comparison, which might yield the same result, would be to compare US industrial production decline in the 30s vs. East Asia today. The best comparison would be world production then vs. world production now. If we’ve off-shored a significant amount of production, you would expect the big production declines to happen in the places we shipped production, not here.

I think this is a good comparison. The difference between how much our economy now depends on manufacturing is a good question, but it should be noted that during the depression – the graph moved twice as low in the same amount of time.

We should not speculate that the graph will continue to look exactly the same or much worse (in a downward trend) in the future. Wait and see- and while you are doing that, learn something new so you can be ready to change jobs if necessary.

-joel

Workaday Joe forgot the negtive sign of the log values, so here are some handy numbers:

-0.1 log10 on the graph means production is down to ~80% of what it was at the peak.

-0.25 log10 on the graph means it is down to ~56% of what it was at the peak.

John, calling it “the Great Recession” is sort of a compromise. For weeks — months — we had a situation where it was clearly “the greatest economic crisis SINCE the Great Depression”, but at the same time not AS BAD AS the Great Depression — so you had a lot of pushback that things, gee, weren’t really that bad.

Of course, you’re right that what we have to date is probably a mild to moderate depression by several metrics. But the concept of “THE Depression” is fixed in many minds at the moment. I’ve said for months that if we call it the Great Depression, that actually implies that there is plenty of room for a not-so-great depression. But without a formal definition it ends up being semantics.

With the IMF and some economists starting to adopt this Great Recession moniker, I think it helps to have a consensus, for one thing, and it helps to have a name that tells us something useful — namely, that this is a recession that is deeper than any in recent memory.

For small values (such as those in this graph), log changes are more or less the same as percentage changes. (i.e., .05 log points=5%.) Here it makes sense to use the percentage change measure because total industrial production has changed dramatically since the 1920s.

The underlying assets for most of these derivative transactions are consumer mortgages. In the cases where the underlying assets are not consumer mortgages, the underlying assets are businesses dependent on consumer spending.

Why invest taxpayer dollars in the intermediaries who have created this mess by building their businesses on transactions that just trade those consumer mortgages/consumer buying habits around the table in a large game of Bridge, rather than invest taxpayer dollars in the underlying assets – THE TAXPAYERS?

If you bail-out consumers, you’ve helped to strengthen the underlying assets that are supporting this financial house of cards. That’s how you solve the financial crisis. If you support the banks, and consumers continue to default and defer spending, the only thing you’ve accomplished is to CREATE a financial black hole.

Why not target the root of the problem by GIVING THE MONEY TO THE PEOPLE!?

I’m with Mike. While I can understand marking off peak to trough comparisons, the critical event is the actual movements in the financial markets. (That is, I think your day one month zero for the GD is 09/01/1929. 7 weeks later there was a crash (except ing the early September micropanic), and then, off we go to the races. Day zero in this chart is 12/01/07 (I think). Our crash would be either Bear-Sterns, Fannie and Freddie bailout, or Lehmann, which should give a month zero of 03/01/08, 07/01, or 08/01.) Going with one of those and discounting the initial slump gives a curve with slightly better perfomance than GD, or initially worse, and somewhat smoothed, or wow, I didn’t think it could slump that fast. Then we’re really looking at, so far, 2/3rds of a GD or 3/4ths of a GD. Ditto with Justin Fox’s employment figures.

I think we’re doing better but it looks to me like the bailout (and interest rate cuts) activity mostly just delayed the inevitable financial panic – when that happened, the liquidity trap snapped shut like a steel trap and the only thing supporting the curve so far is the automatic stabilizers, which have had an unquestionably positive impact.

(I keep saying that, but going over and over these kinds of curves for all those recessions, it looks to me like the auto stabilizers, plus minimizing the impact of finance (and implicitly, the Fed) are what have saved the day over and over. All the volitility comes from finance, and the killer blow (during the GD & GD) has come from finance, but finance bounces back or at least stabilizes as soon as the real economy shapes up. If the real economy isn’t working, finance isn’t working. It really seems like Bernanke wasted his time; he was looking at the map upside down.)

max
[‘Through a mirror, darkly.’]

How has industrial production changed in ways that might be relevant to this graph? Aren’t we more integrated into a global economy and thus did our production remain higher because other countries were having an effect? Or was the character of production then such that it would have more of a cliff effect, as in we made all our own steel then and that was, presumably, a big part of total production so a slowdown in steel would make the overall numbers worse.

Don’t want to pile on. But a general comment — specify the base. 10? e? 2?