The most important things we learned in our first two years of chartbuildering
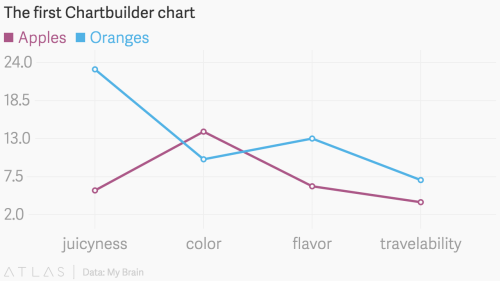
In July 2013, we released a simple charting tool with a simple premise: great-looking charts, fast, easy enough for anyone to use. Since then, Chartbuilder has caught on. At Quartz, reporters have published thousands of charts that make their stories more compelling and the data they’re writing about more understandable. Elsewhere, Chartbuilder has been used or forked to suit the needs of news organizations large and small.
Today, we’re releasing a fully rewritten version of the software as open source. (It’s connected with the launch of a new platform for charts, Atlas, that we’re also launching today.) While there are lots of new things to get excited about with this release, more exciting are all of the things we’ve learned since version one.
Maintaining an open source project is hard
Between responding to people’s off-topic questions, never being able to find time to work on new features, and dealing with small bugs, it can be difficult to stay motivated to push the project forward. Not to mention the conflict of interest between what is a high priority for us at Quartz to build versus what is a priority for those outside of the organization. We also want to encourage more people who make use of the project to contribute back to it. This new release is intended to encourage all of that.
Don’t write your own charting framework
The biggest impediment to adding new features to Chartbuilder was our own bad code, a lot of which was written before we had any idea that Chartbuilder was going to become a open-sourced tool or even a newsroom-wide tool. Now, instead of having to code a new chart type from scratch, we can rely on the work of countless others who have done the work already in a way significantly better than we ever could have—namely, D4, a charting library by Mark Daggett.
The idea has caught on
Since we open sourced Chartbuilder, the New York Times, Wall Street Journal, and Bloomberg, have built their own custom software to allow more people in their newsrooms to make charts more quickly. Organizations like NPR, CNBC, and The New Yorker have created customized versions of Chartbuilder.
The initial constraints we set were much too loose.
When we first rolled out Chartbuilder to the Quartz newsroom we allowed for an unlimted amount of data to be plotted in 56 different colors. This level of flexibility ran counter to our ethos: Chartbuilder was creating ugly and hard to understand charts. Our current version of Chartbuilder has 11 colors (two hues in four values plus three grays) and allows no more than 11 data series.
Reporters can make charts just fine
At Quartz, where every reporter is empowered to make her own charts, it’s not that we never make bad data visualizations, but they have turned out to be few and far between. Part of the reason is that Chartbuilder really only allows for simple charts. These are much harder to screw up than abstract visualizations.
It’s made us faster and a little lazier.
Medium-sized data that might have been turned into a more complex visualization now tend to get squeezed through Chartbuilder. That’s certainly faster, and most of the time, it’s the right call. When our reporting gives us lemons, we make lemonade instead of lemon meringue pie. We’ve also found Chartbuilder to be a great tool in creating more complex static graphics. Instead of manually drawing shapes and layouts in Illustrator, we create a Chartbuilder chart and heavily modify it into something completely unique.
It’s been a successful platform to teach reporters new skills
We’ve trained our top Chartbuilder users how to use Adobe Illustrator to annotate and make basic customizations to their charts. It has allowed them to gain further control over the crafting of their content, and removed a burden from the team I’m on.
Where will Chartbuilder be in another two years? Who knows. But we look forward to learning and coding with you. If you’re interested in giving Chartbuilder 2 a spin, you can download or fork it from our Github repo, or for the less technically inclined test it out on the hosted version.

