

Uncle Sam takes his cut of our past year’s earnings every April, and since the tax code is so complicated, it’s hard for the average person to tell how they will be impacted. One simple ratio known as the “tax burden” helps cut through the confusion. Unlike tax rates, which vary widely based on an individual’s circumstances, tax burden measures the proportion of total personal income that residents pay toward state and local taxes. It isn’t uniform across the U.S., either.
To determine the residents with the biggest tax burdens, WalletHub compared the 50 states based on the cost of three types of taxes — property taxes, individual income taxes, and sales and excise taxes — as a share of total personal income in the state.
Key Findings
- New York has the highest overall tax burden, while Alaska has the lowest.
- Maine has the highest property tax burden, while Alabama has the lowest.
- California has the highest individual income tax burden, while seven states (including Texas, Florida and Washington) have the lowest.
- Washington has the highest sales and excise tax burden, while New Hampshire has the lowest.
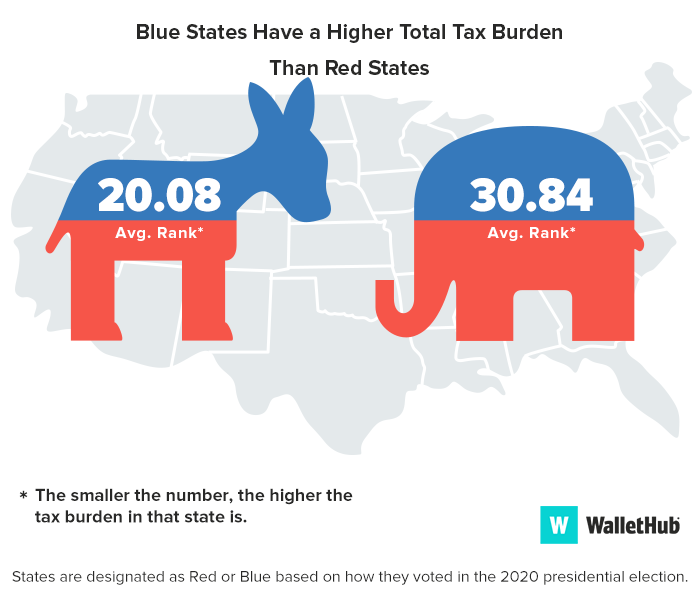
- Red states have a lower tax burden than blue states, on average.
For more fun (or not so fun) facts about 2024’s tax landscape, check out WalletHub’s Tax Day Facts infographic.

Cassandra Happe, WalletHub Analyst
Main Findings
Overall Tax Burden by State
| Overall Rank* | State | Total Tax Burden (%) |
Property Tax Burden (%) |
Individual Income Tax Burden (%) |
Total Sales & Excise Tax Burden (%) |
|---|---|---|---|---|---|
| 1 | New York | 12.02% | 4.36% (5) |
4.63% (2) |
3.03% (31) |
| 2 | Hawaii | 11.80% | 2.64% (25) |
3.82% (6) |
5.34% (3) |
| 3 | Vermont | 11.12% | 4.85% (2) |
3.09% (11) |
3.18% (27) |
| 4 | Maine | 10.74% | 4.86% (1) |
2.59% (21) |
3.29% (24) |
| 5 | California | 10.40% | 2.73% (23) |
4.87% (1) |
2.80% (37) |
| 6 | Connecticut | 10.08% | 3.95% (6) |
3.42% (9) |
2.71% (40) |
| 7 | Minnesota | 9.95% | 2.82% (22) |
4.01% (4) |
3.12% (28) |
| 8 | Illinois | 9.67% | 3.67% (9) |
2.57% (22) |
3.43% (21) |
| 9 | New Jersey | 9.47% | 4.59% (3) |
2.36% (30) |
2.52% (44) |
| 10 | Rhode Island | 9.38% | 3.83% (7) |
2.49% (24) |
3.06% (30) |
| 11 | Utah | 9.35% | 2.19% (38) |
3.57% (7) |
3.59% (16) |
| 12 | Kansas | 9.29% | 3.04% (16) |
2.67% (17) |
3.58% (17) |
| 13 | Maryland | 9.26% | 2.60% (30) |
4.00% (5) |
2.66% (41) |
| 14 | Iowa | 9.21% | 3.39% (12) |
2.39% (29) |
3.43% (21) |
| 15 | Nebraska | 9.16% | 3.55% (10) |
2.60% (20) |
3.01% (32) |
| 16 | Ohio | 8.92% | 2.72% (24) |
2.48% (26) |
3.72% (13) |
| 17 | Indiana | 8.85% | 2.14% (39) |
3.06% (12) |
3.65% (14) |
| 18 | Arkansas | 8.79% | 1.65% (48) |
2.26% (32) |
4.88% (6) |
| 19 | Mississippi | 8.76% | 2.63% (26) |
1.86% (36) |
4.27% (8) |
| 20 | Massachusetts | 8.55% | 3.35% (13) |
3.37% (10) |
1.83% (45) |
| 21 | Virginia | 8.45% | 2.89% (21) |
2.98% (14) |
2.58% (43) |
| 21 | West Virginia | 8.45% | 2.22% (37) |
2.61% (19) |
3.62% (15) |
| 23 | Oregon | 8.44% | 2.95% (18) |
4.30% (3) |
1.19% (48) |
| 24 | Colorado | 8.42% | 2.93% (20) |
2.49% (24) |
3.00% (33) |
| 25 | Pennsylvania | 8.36% | 2.62% (28) |
2.64% (18) |
3.10% (29) |
| 26 | Wisconsin | 8.32% | 2.98% (17) |
2.57% (22) |
2.77% (39) |
| 27 | Louisiana | 8.29% | 1.83% (46) |
1.57% (39) |
4.89% (5) |
| 28 | Kentucky | 8.26% | 1.89% (43) |
2.98% (14) |
3.39% (23) |
| 29 | Washington | 8.04% | 2.58% (31) |
0.00% (44) |
5.46% (1) |
| 30 | New Mexico | 8.03% | 1.86% (44) |
1.13% (40) |
5.04% (4) |
| 31 | Michigan | 8.02% | 2.94% (19) |
2.23% (33) |
2.85% (36) |
| 32 | North Carolina | 7.89% | 2.00% (42) |
2.68% (16) |
3.21% (26) |
| 33 | Idaho | 7.86% | 2.12% (40) |
2.47% (27) |
3.27% (25) |
| 34 | Arizona | 7.79% | 2.26% (36) |
1.62% (38) |
3.91% (10) |
| 35 | Missouri | 7.76% | 2.41% (35) |
2.40% (28) |
2.95% (34) |
| 36 | Georgia | 7.65% | 2.50% (33) |
2.36% (30) |
2.79% (38) |
| 37 | Texas | 7.56% | 3.71% (8) |
0.00% (44) |
3.85% (12) |
| 38 | Alabama | 7.52% | 1.33% (50) |
2.01% (34) |
4.18% (9) |
| 39 | Montana | 7.50% | 3.24% (14) |
3.00% (13) |
1.26% (47) |
| 39 | South Carolina | 7.50% | 2.63% (26) |
2.00% (35) |
2.87% (35) |
| 41 | Nevada | 7.37% | 2.02% (41) |
0.00% (44) |
5.35% (2) |
| 42 | Oklahoma | 7.04% | 1.71% (47) |
1.75% (37) |
3.58% (17) |
| 43 | North Dakota | 6.80% | 2.44% (34) |
0.90% (41) |
3.46% (19) |
| 44 | South Dakota | 6.44% | 2.58% (31) |
0.00% (44) |
3.86% (11) |
| 45 | Delaware | 6.43% | 1.85% (45) |
3.57% (7) |
1.01% (49) |
| 46 | Tennessee | 6.07% | 1.64% (49) |
0.05% (43) |
4.38% (7) |
| 47 | Florida | 6.05% | 2.61% (29) |
0.00% (44) |
3.44% (20) |
| 48 | Wyoming | 5.70% | 3.10% (15) |
0.00% (44) |
2.60% (42) |
| 49 | New Hampshire | 5.63% | 4.51% (4) |
0.15% (42) |
0.97% (50) |
| 50 | Alaska | 4.93% | 3.54% (11) |
0.00% (44) |
1.39% (46) |
Note: *No. 1 = Highest

- Highest
- 1. Maine
- 2. Vermont
- 3. New Jersey
- 4. New Hampshire
- 5. New York
- Lowest
- 46. Louisiana
- 47. Oklahoma
- 48. Arkansas
- 49. Tennessee
- 50. Alabama

- Highest
- 1. California
- 2. New York
- 3. Oregon
- 4. Minnesota
- 5. Maryland
- Lowest
- T-44. Alaska
- T-44. Florida
- T-44. Nevada
- T-44. South Dakota
- T-44. Texas

- Highest
- 1. Washington
- 2. Nevada
- 3. Hawaii
- 4. New Mexico
- 5. Louisiana
- Lowest
- 46. Alaska
- 47. Montana
- 48. Oregon
- 49. Delaware
- 50. New Hampshire
In-Depth Look at State Tax Burdens
Total Tax Burden
New York has the highest total tax burden, with residents paying out around 12% of their income to state and local governments. That includes 4.6% on income taxes, 4.4% on property taxes, and 3% in sales and excise taxes.
Alaska has the lowest total tax burden, as its residents pay no income tax. They also pay out only 3.5% of their income in property taxes and 1.4% in sales and excise taxes, for a total of 4.9%.
Income Tax Burden
California has the costliest state and local income taxes in the nation, at 4.9% of its residents’ income. On the other end of the spectrum, Alaska, Florida, Nevada, South Dakota, Texas, Washington, and Wyoming do not charge any income tax. This makes them attractive states to move to.
Property Tax Burden
Maine charges the most in property taxes, at nearly 4.9% of residents’ income. All states have some sort of property tax, but Alabama’s is by far the lowest, at just 1.3%.
Sales and Excise Tax Burden
Residents of Washington pay out around 5.5% of their income in sales and excise taxes every year. New Hampshire residents have the lowest burden – the state does not charge a general sales tax, and other excise taxes only work out to less than 1% of the average resident’s income each year.
Blue States vs. Red States
Ask the Experts
For more insight on the differences in state tax policies, we asked a panel of taxation experts to weigh in with their thoughts on the following key questions:
- What state and local tax instruments are most fair? Least fair?
- What’s the relationship between state tax burden and economic growth?
- Should states and localities tax property at different marginal rates like they do income?
- What makes some state and local tax systems better able to weather economic downturns?
- How has inflation affected local governments' tax revenues?
Ask the Experts

Assistant Professor of Law, Moritz College of Law – Ohio State University
Read More

Robert B. & Helen S. Meyner Professor of Government and Public Service and Director of the Meyner Center for the Study of State and Local Government – Lafayette College
Read More

Distinguished Professor; Director, School of Public Administration and Co-Editor Public Finance Journal, Understanding Municipal Fiscal Health – University of Nebraska at Omaha
Read More

Public Finance Policy Expert and Former Mayor of Highland Park, IL and Head of Fitch Rating’s Public Finance Group
Read More

Adjunct Faculty, Masters in Taxation Program, Portland State University; Chair, Taxation Practice, Samuels Yoelin Kantor LLP
Read More

Ph.D. – Professor of Public Administration; Director of Part-Time Faculty Affairs – University of La Verne
Read More
Methodology
In order to determine the states that tax their residents the most and least aggressively, WalletHub compared the 50 states across the following three tax burdens and added the results to obtain the overall tax burden for each state:
- Property Tax as a Share of Personal Income
- Individual Income Tax as a Share of Personal Income
- Total Sales & Excise Tax as a Share of Personal Income
Sources: Data used to create this ranking were collected as of March 12, 2024 from the Tax Policy Center.
WalletHub experts are widely quoted. Contact our media team to schedule an interview.