The Herald's Spring 2020 poll was conducted over the course of two days from March 10-11, the two days before the University announced its transition to remote learning and limited on-campus housing, as previously reported by The Herald.
1. Do you approve or disapprove of the way Christina Paxson is handling her job as the president of the University?
7.4% Strongly approve
35.7% Somewhat approve
26.6% Somewhat disapprove
7.1% Strongly disapprove
23.2% No opinion

14.6% Strongly approve
43.6% Somewhat approve
7.7% Somewhat disapprove
1.6% Strongly disapprove
32.6% No opinion
Questions 1 and 2 appear on The Herald’s poll every semester.
3. In classes you have taken at the University, how effective or ineffective were teaching assistants in facilitating your understanding of course materials?
29.2% Extremely effective
56.5% Somewhat effective
10.5% Somewhat ineffective
1.8% Extremely ineffective
2% No opinion
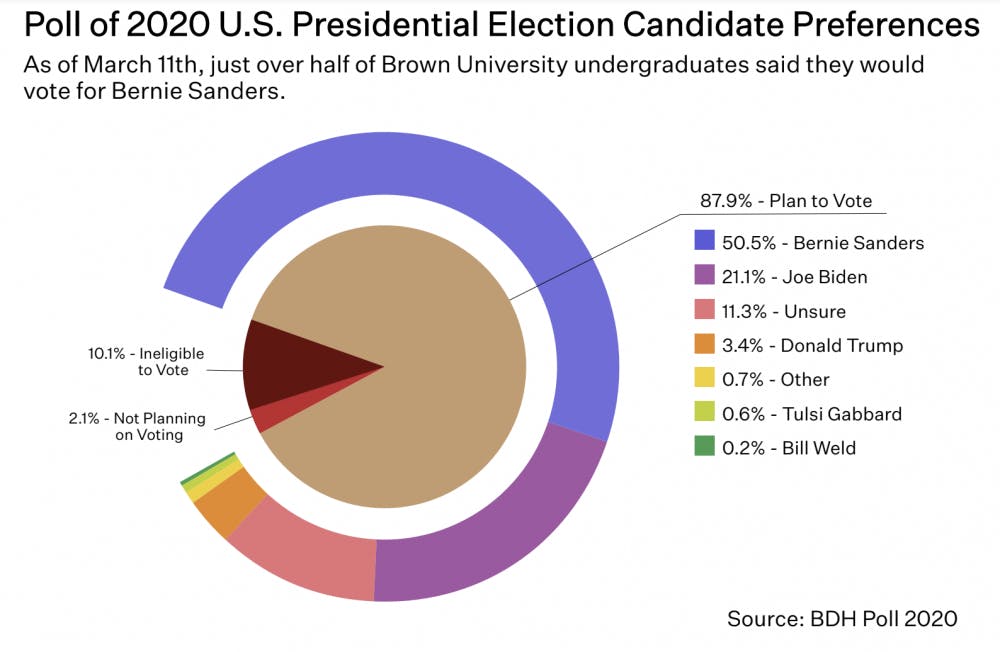
4. If the 2020 U.S. Presidential Election was held today, which candidate would you vote for?
21.1% Joe Biden
0.6% Tulsi Gabbard
50.5% Bernie Sanders
3.4% Donald Trump
0.2% Bill Weld
0.7% Other
11.3% I am unsure
2.1% I do not plan on voting
10.1% I am ineligible to vote
Question 4 was modified from the Fall 2015 poll.
5. In the past year at Brown, which types of parties have you attended?
49.5% University-recognized Greek Life
45.9% Off-campus/unrecognized Greek Life
64.3% Student organization event
35.6% Small Victories (SV) event
70.7% Dormitory party
67.5% Off-campus house party
41.7% Varsity sports house
41% Providence/downtown bars or clubs
18.8% Graduate Center Bar
17.7% Whiskey Republic
7.9% Other
9.7% I do not attend parties
6. What is your preferred method of notetaking in class?
58% Handwriting on paper
23.4% Typing on a computer
10.1% Handwriting on a tablet (e.g. iPad with stylus)
5.3% I do not usually take notes
2.7% I do not have a preference
0.5% Other
7. During a typical class, about how long do you pay full attention to the lecture?
25.3% The entire class
54.4% More than half of the class
14.9% Half of the class
4.5% Less than half of the class
0.9% None of the class
8. How often do you meet with an academic advisor? (e.g. department advisor, Meiklejohn peer advisor, first-year advisor, sophomore advisor, etc.)
0.2% Daily
1.2% A few times per week
6.9% A few times per month
35.6% A few times per semester
33.2% Once per semester
10.8% Once per year
12.2% Never
9. Do you approve or disapprove of the University’s requirement that all undergraduates live in on-campus housing for their first six semesters (with the exception of the off-campus permission lottery for juniors)?
8% Strongly approve
26.7% Somewhat approve
34.4% Somewhat disapprove
24.5% Strongly disapprove
6.4% No opinion
10. Which of the following dating apps have you used? (Select all that apply)
21.7% Bumble
3.8% Grindr
1.5% HER
44.4% Tinder
1.5% Other
53.2% I do not use dating apps

25.8% Always
15.6% Most of the time
8.1% Sometimes
6.3% Rarely
13.4% Never
30.9% I do not engage in oral or penetrative sexual intercourse
12. How often do you use barrier methods (e.g. condoms, dental dams) and/or contraceptives (e.g. birth control pills, IUDs) to prevent pregnancy during vaginal sexual intercourse?
41.4% Always
11% Most of the time
4.3% Sometimes
2.5% Rarely
4.9% Never
36% I do not engage in vaginal sexual intercourse
The margin of error is 3.1 percent with 95 percent confidence. The margins of error for specific subsets are as follows: 4.0 percent for females, 4.6 percent for males, 5.3 percent for first-years, 5.5 percent for sophomores, 6.9 percent for juniors, 7.3 percent for seniors, 4.5 percent for students who receive financial aid and 4.0 percent for students who do not receive financial aid.
The sample of undergraduate students who took the poll is demographically similar to the student body. The sample was 43.1 percent male and 54.8 percent female, with 2.1 percent identifying as other. First-years made up 32.6 percent, sophomores 30.5 percent, juniors 19.4 percent and seniors 17.4 percent of the poll. Of the students polled, 35.2 percent receive grants from the University covering some costs, 9.3 percent receive grants covering all costs and 55.5 percent receive no financial aid. Varsity athletes made up 7.7 percent, while non-athletes made up 92.3 percent of the sample. Of students surveyed, 73.1 percent identify as heterosexual, 6.8 percent as gay, 16 percent as bisexual and 4.2 percent as other. Those involved in a Greek life organization made up 13.1 percent of all surveyed.
In the sample, 50 percent identify as white, 38.8 percent as Asian, 10.6 percent as Hispanic, 11.1 percent as Black, 0.9 percent as American Indian/Alaska Native, 1.1 percent as Native Hawaiian/Pacific Islander and 4 percent as other. The percentages add up to more than 100 percent because some students selected more than one race/ethnicity. Students surveyed also marked their concentration area(s): 32.8 percent are in the humanities/arts, 20.7. percent in life sciences, 39.6 percent in physical sciences, 15.5 percent in business (Business, Entrepreneurship and Organizations or economics) and 22.1 percent in social sciences (not including BEO or economics). Of the students polled, 13.3 percent are legacy students, meaning they have a parent, grandparent or sibling who attended Brown, while 86.7 percent are not. First-generation students made up 16 percent of students who took the poll, and non-first-generation students made up 84 percent of the sample. Statistical significance was established at the 0.05 level. All cross-tabulations are statistically significant.
University News Editor Spencer Schultz ’22 and Arts and Culture Editor Emily Teng ’22 coordinated the poll. The poll was conducted on campus by Herald section editors, senior staff writers and other staff members.
Over the next few weeks, The Herald will release a series of articles about individual poll questions.
ADVERTISEMENT