The Centre for Evidence-Based Medicine
Evidence Service to support the COVID-19 response
Evidence Service to support the COVID-19 response
August 21, 2020
Daniel Howdon, Jason Oke, Carl Heneghan
Summary
We recently presented an estimate of recent declining trends in the case fatality ratio (CFR) in England. But there is a question of much greater interest: what is the probability of death conditional on infection, or the infection fatality ratio (IFR)?
Variation in testing behaviour and case ascertainment over time means that any trends in cases do not necessarily reflect trends in infections. Similarly, trends in the CFR do not necessarily reflect trends in the IFR. The CFR is also an overestimate of the IFR, being scaled up by the ratio of actual infections to infections detected.
This article presents data from two models estimating daily infections in England, deriving recent IFRs estimates of 0.30% using the MRC unit’s data and 0.49% using ONS data.
Results
The Office for National Statistics (ONS) publishes weekly infection survey data which contains estimates of the daily number of new infections in England from 11 May to (at time of latest release) 9 August, meaning weekly moving averages can be calculated up to 6 August. The Medical Research Council (MRC) Biostatistics Unit at the University of Cambridge also provides semi-regular modelled estimates of the number of new infections in England from 11 February to latest release 31 July (weekly moving averages can be calculated up to 28 July).
Using these two data sets, we derive profiles for the last eight weeks for deaths within 28 days of a positive test and the implied IFR. These are presented in Figures 1 (ONS) and Figure 2 (MRC), with IFRs implied by the upper and lower 95% credible intervals stated for each model also presented (dotted lines).
In both cases, we observe an estimated IFR that falls over time, with estimates derived from ONS data higher than those from the MRC data.
Figure 1: IFR trend implied by ONS infection estimates

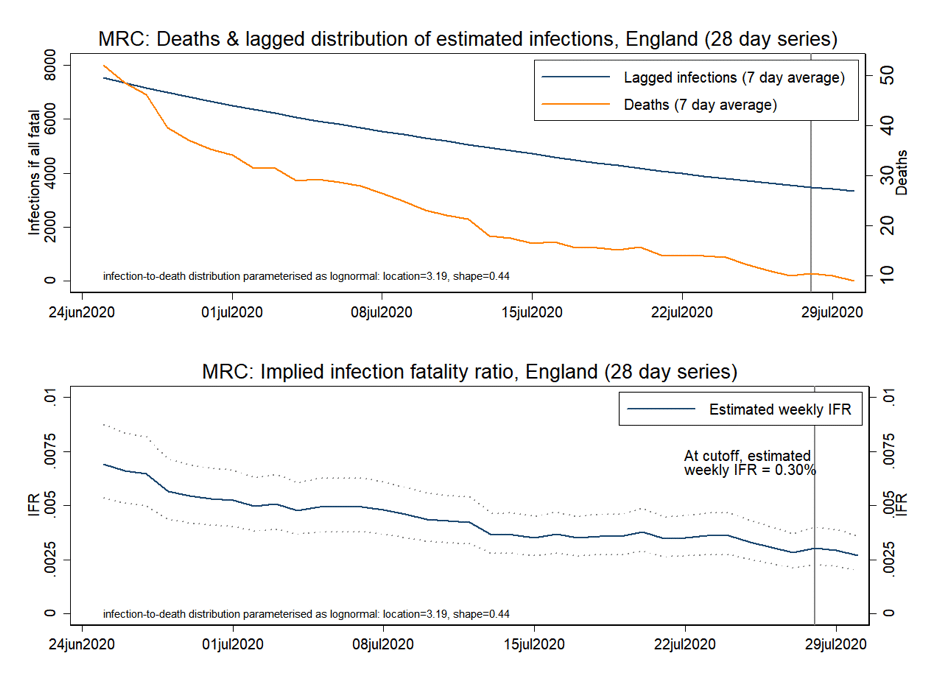
Estimates from the MRC data appear to be more stable over time, having fallen by around 55% in the six weeks to 4 August, compared to a fall of over 80% for estimates based on the ONS data.
How we estimated the daily IFR.
In a prospective cohort study, the IFR can be calculated directly by observing the number of deaths occurring from the number at risk; the people infected or test positives. The daily IFR extends the idea to be the number of deaths in those infected on a single day. With aggregate numbers of daily infections and deaths, a direct calculation is not possible.
A crude estimate can be made by simply dividing the number of deaths by the number of infected on the same day, but this ignores the fact that there is a lag between infection and death and people dying on one day represent infections that started days or weeks before. Therefore, we are required to estimate the number at risk that would correspond to the number dying on a given day.
To do this, we assume that the infection to death distribution follows a lognormal distribution as per Wood (2020). We use this distribution and the infection numbers to reverse engineer the number at risk (i.e.the denominator in the IFR calculation). As the number at risk at day x is a mixture of people infected previously we calculate the number of risk by the following:
No. at risk (day x) = No. infections (day x -1) * m(x-1) + No. infections (day x -2) * m(x-2),…..,No. infections(day x – n)*m(x – n).
Where m(x) is the probability that the time from infection to deaths is x days long as per a log-normal density function with mean 26.8 days and standard deviation 12.4 days (location 3.19, shape 0.44)
As with our estimate of trends in the CFR, we use data on deaths following a COVID-19 positive test within the previous 28 days to estimate an IFR reflecting the contemporaneous state of the epidemic. We present IFRs based on the median and lower and upper 95% credible interval estimates of daily infections derived from each model.
Further assumptions are required in addition to these modelled estimates of infections in order to establish an estimate of the IFR. We again use distributional parameters published in Wood (2020), this time of the infection-to-death distribution, derived from data held in the COVID-19 Hospitalisation in England Surveillance System (CHESS).
In this case, this implies the use of a lognormal distribution with mean 26.8 days and a standard deviation of 12.4 days (location 3.19, shape 0.44). To obtain an appropriate cutoff for infections in line with Public Health England’s (PHE) figures of 88% of deaths resulting within 28 days of a confirmed case, we use infections from the past 40 days (at which point the cumulative probability of this lognormal distribution reaches 88%) lagged forward as implied by our assumed distribution.
While reporting lags based on the 28-day measure of COVID-19 deaths are not yet apparent due to the relative novelty of this dataset, we can infer these from past datasets published from PHE records. Except in extremely rare cases, such reports for previous all-settings mortality formed a near-complete record after 14 days – indeed in most cases, this lag was much shorter. We, therefore, treat a 14 day-lagged measure of deaths as the point at which this value can be established with high confidence.
This means that using deaths data published as of 18 August, we use 4 August as our cutoff for ONS estimates. Due to the greater lag in data availability, we use 28 July as our cutoff for MRC estimates.
While estimates in Wood (2020), being trained on UK data, appear to be most appropriate for our purposes, these results again appear to be robust to alternative parameterisations of the infection-to-death distribution, with Stockholm-trained parameter estimates [https://twitter.com/cheianov/status/1275824447669391360] yielding an IFR of 0.30% for the MRC model and a lower 0.40% for the ONS model.
We will update these IFR estimates in future weeks as we access new outputs from the ONS and MRC models.
Reference
Wood, S. N. (2020). Did COVID-19 infections decline before UK lockdown? ArXiv:2005.02090 [q-Bio, Stat]. http://arxiv.org/abs/2005.02090
Authors
Daniel Howdon is a Researcher, Health Economics, LIHS UCU Department Representative, Academic Unit of Health Economics, University of Leeds. Bio here
Carl Heneghan is Professor of Evidence-Based Medicine, Director of the Centre for Evidence-Based Medicine and Director of Studies for the Evidence-Based Health Care Programme. (Full bio and disclosure statement here)
Jason Oke is a Senior Statistician at the Nuffield Department of Primary Care Health Sciences and Module Coordinator for Statistical Computing with R and Stata (EBHC Med Stats), and Introduction to Statistics for Health Care Research (EBHC), as part of the Evidence-Based Health Care Programme.
Disclaimer: the article has not been peer-reviewed; it should not replace individual clinical judgement, and the sources cited should be checked. The views expressed in this commentary represent the views of the authors and not necessarily those of the host institution, the NHS, the NIHR, or the Department of Health and Social Care. The views are not a substitute for professional medical advice.