
SUBSCRIBE to the Fact of the Week
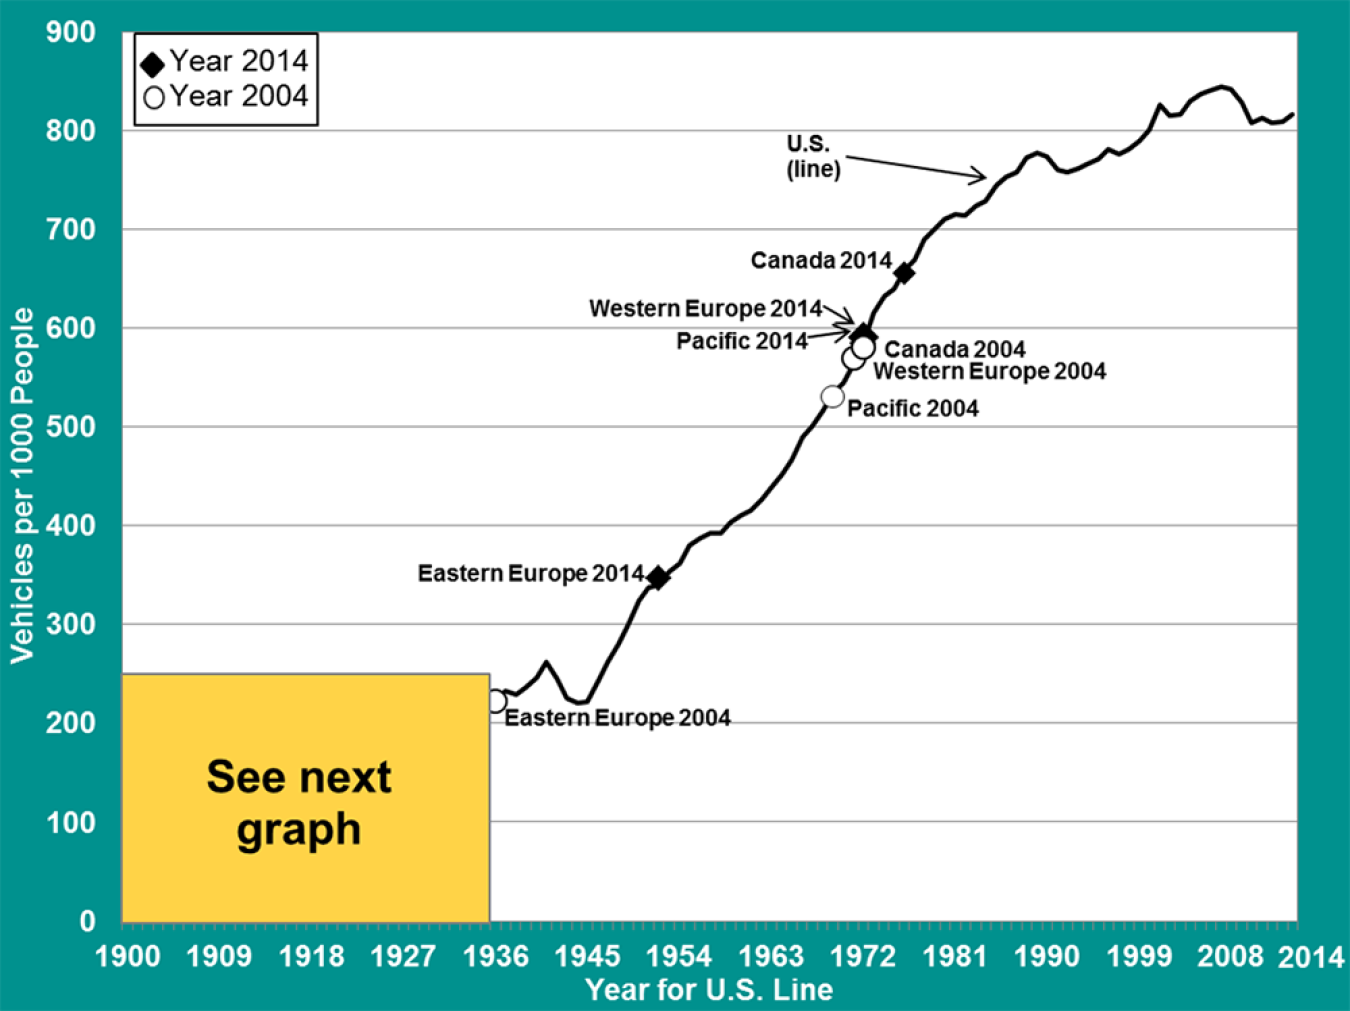
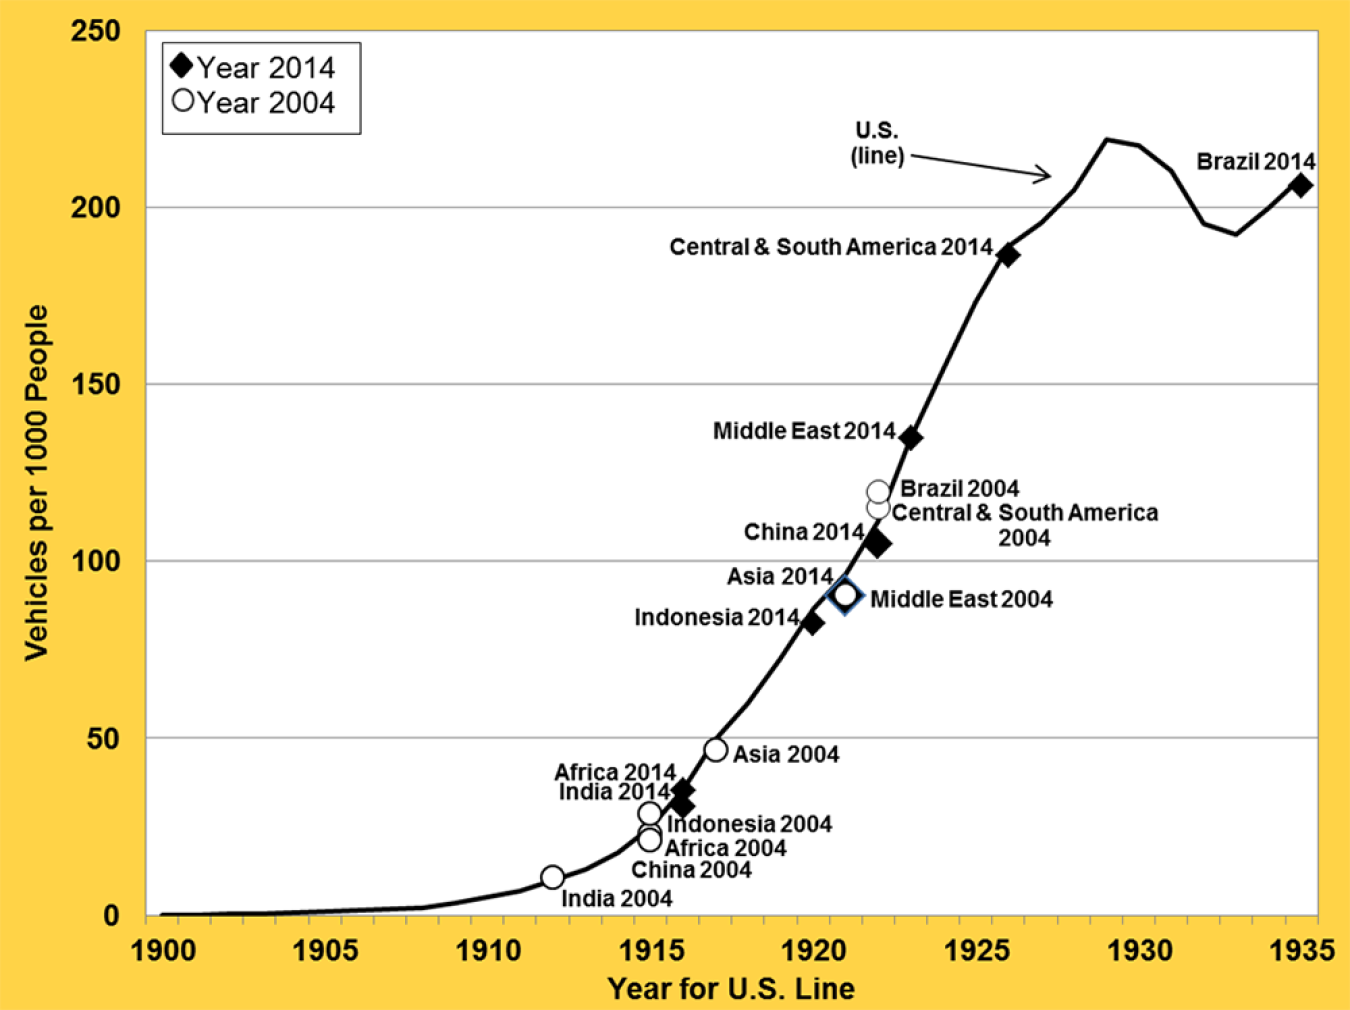
The graphs below show the number of motor vehicles per thousand people for various countries and regions. The annual data for the United States from 1900 to 2014 are displayed in the solid line. The points labeled on that line show data for other countries/regions around the world in 2004 and 2014 and how their vehicles per capita compare to the United States. For instance, the graph shows that in 2004, Eastern Europe’s vehicles per thousand people was about where the United States was in 1936, but by 2014 it was about where the United States was in 1952. The lower part of the graph (1900-1935) is shown enlarged on the second graph.
Vehicles per Thousand People: U.S. (Over Time) and Other Countries (in 2004 and 2014)
Supporting Information
| Country/Region | Vehicles per 1,000 people | |
|---|---|---|
| 2004 | 2014 | |
| Africa | 23.1 | 35.1 |
| Asia, Far East | 46.6 | 90.4 |
| Asia, Middle East | 90.7 | 134.8 |
| Brazil | 119.7 | 206.0 |
| Canada | 580.8 | 655.9 |
| Central & South America | 115.1 | 186.5 |
| China | 21.4 | 104.9 |
| Europe, East | 222.5 | 346.8 |
| Europe, West | 569.5 | 590.9 |
| India | 10.7 | 30.8 |
| Indonesia | 28.8 | 82.3 |
| Pacific | 530.6 | 584.2 |
| United States | 829.9 | 816.4 |
Note: Though some countries are listed separately in this table, those countries are also included in the regional total. For instance, China is listed separately, but is also included in the Asia, Far East region.
| Year | U.S. vehicles per 1,000 people |
Year | U.S. vehicles per 1,000 people |
Year | U.S. vehicles per 1,000 people |
Year | U.S. vehicles per 1,000 people |
Year | U.S. vehicles per 1,000 people |
|---|---|---|---|---|---|---|---|---|---|
| 1900 | 0.11 | 1923 | 134.90 | 1946 | 243.11 | 1969 | 533.37 | 1992 | 757.96 |
| 1901 | 0.19 | 1924 | 154.35 | 1947 | 262.56 | 1970 | 545.35 | 1993 | 761.94 |
| 1902 | 0.29 | 1925 | 173.26 | 1948 | 280.20 | 1971 | 562.45 | 1994 | 766.94 |
| 1903 | 0.41 | 1926 | 189.10 | 1949 | 299.56 | 1972 | 585.60 | 1995 | 770.99 |
| 1904 | 0.67 | 1927 | 195.77 | 1950 | 323.71 | 1973 | 615.19 | 1996 | 781.16 |
| 1905 | 0.94 | 1928 | 204.87 | 1951 | 337.14 | 1974 | 632.32 | 1997 | 776.02 |
| 1906 | 1.27 | 1929 | 219.31 | 1952 | 340.57 | 1975 | 640.07 | 1998 | 781.20 |
| 1907 | 1.65 | 1930 | 217.34 | 1953 | 353.67 | 1976 | 659.47 | 1999 | 790.07 |
| 1908 | 2.24 | 1931 | 210.37 | 1954 | 361.40 | 1977 | 669.03 | 2000 | 800.32 |
| 1909 | 3.45 | 1932 | 195.38 | 1955 | 379.77 | 1978 | 690.17 | 2001 | 825.81 |
| 1910 | 5.07 | 1933 | 192.38 | 1956 | 387.58 | 1979 | 700.42 | 2002 | 815.73 |
| 1911 | 6.81 | 1934 | 199.90 | 1957 | 392.11 | 1980 | 710.71 | 2003 | 816.11 |
| 1912 | 9.90 | 1935 | 208.61 | 1958 | 392.17 | 1981 | 715.22 | 2004 | 829.94 |
| 1913 | 12.94 | 1936 | 222.62 | 1959 | 402.83 | 1982 | 713.95 | 2005 | 837.25 |
| 1914 | 17.79 | 1937 | 233.33 | 1960 | 410.37 | 1983 | 724.30 | 2006 | 840.69 |
| 1915 | 24.77 | 1938 | 229.65 | 1961 | 415.11 | 1984 | 728.20 | 2007 | 844.54 |
| 1916 | 35.48 | 1939 | 236.93 | 1962 | 426.06 | 1985 | 744.50 | 2008 | 841.57 |
| 1917 | 49.57 | 1940 | 245.63 | 1963 | 438.75 | 1986 | 753.33 | 2009 | 828.67 |
| 1918 | 59.69 | 1941 | 261.57 | 1964 | 451.57 | 1987 | 758.58 | 2010 | 808.38 |
| 1919 | 72.50 | 1942 | 244.73 | 1965 | 466.90 | 1988 | 772.92 | 2011 | 812.32 |
| 1920 | 86.78 | 1943 | 225.89 | 1966 | 489.34 | 1989 | 776.99 | 2012 | 807.50 |
| 1921 | 96.68 | 1944 | 220.23 | 1967 | 500.66 | 1990 | 773.40 | 2013 | 808.64 |
| 1922 | 111.53 | 1945 | 221.80 | 1968 | 516.49 | 1991 | 760.19 | 2014 | 816.38 |
Source (both tables): Oak Ridge National Laboratory, Transportation Energy Data Book: Edition 35, ORNL-6990, Oak Ridge, TN, September 2016, Tables 3.5 and 3.6.